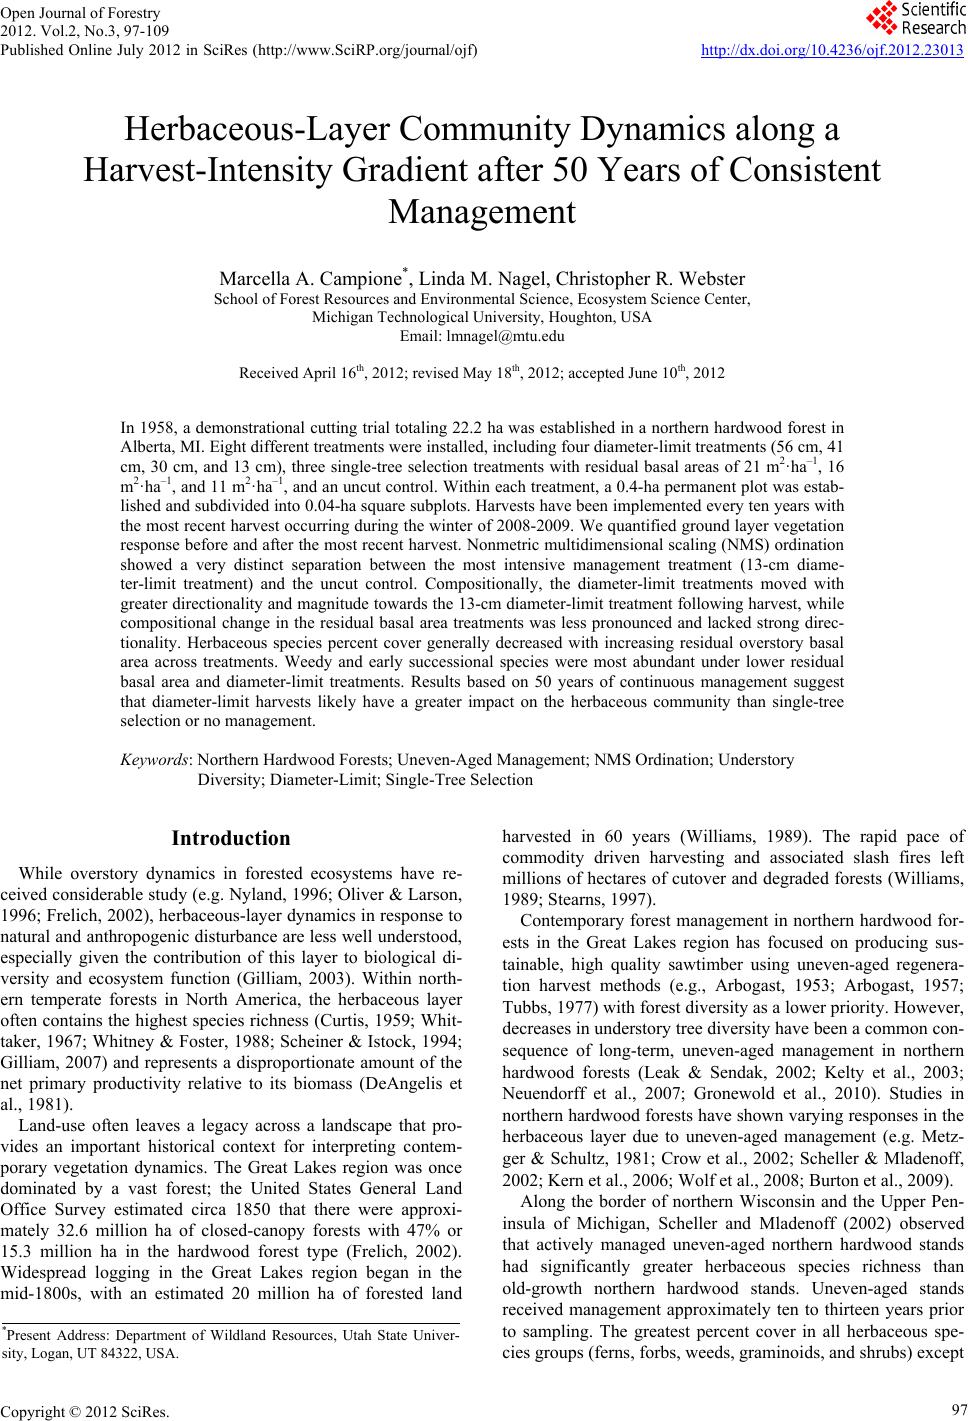
 Open Journal of Forestry 2012. Vol.2, No.3, 97-109 Published Online July 2012 in SciRes (http://www.SciRP.org/journal/ojf) http://dx.doi.org/10.4236/ojf.2012.23013 Copyright © 2012 SciRes. 97 Herbaceous-Layer Community Dynamics along a Harvest-Intensity Gradient after 50 Years of Consistent Management Marcella A. Campione*, Linda M. Nagel, Christopher R. Webster School of Forest Resources and Environm en tal Science, Ecosystem Science Center, Michigan Technological University, Houghton, USA Email: lmna ge l @mtu.edu Received April 16th, 2012; revised May 18th, 2012; accepted June 10th, 2012 In 1958, a demonstrational cutting trial totaling 22.2 ha was established in a northern hardwood forest in Alberta, MI. Eight different treatments were installed, including four diameter-limit tre atments (56 cm, 41 cm, 30 cm, and 13 cm), three single-tree selection treatments with residual basal areas of 21 m2·ha–1, 16 m2·ha–1, and 11 m2·ha–1, and an uncut control. Within each treatment, a 0.4-ha permanent plot was estab- lished and subdivided into 0.04-ha square subplots. Harvests have been implemented every ten years with the most recent harvest occurring during the winter of 2008-2009. We quantified ground layer vegetation response before and after the most recent harvest. Nonmetric multidimensional scaling (NMS) ordination showed a very distinct separation between the most intensive management treatment (13-cm diame- ter-limit treatment) and the uncut control. Compositionally, the diameter-limit treatments moved with greater directionality and magnitude towards the 13-cm diameter-limit treatment following harvest, while compositional change in the residual basal area treatments was less pronounced and lacked strong direc- tionality. Herbaceous species percent cover generally decreased with increasing residual overstory basal area across treatments. Weedy and early successional species were most abundant under lower residual basal area and diameter-limit treatments. Results based on 50 years of continuous management suggest that diameter-limit harvests likely have a greater impact on the herbaceous community than single-tree selection or no management. Keywords: Northern Hardwood Forests; Uneven-Aged Management; NMS Ordination; Understory Diversity; Diameter-Limit; Single-Tree Selection Introduction While overstory dynamics in forested ecosystems have re- ceived considerable study (e.g. Nyland, 1996; Oliver & Larson, 1996; Frelich, 2002), herbaceous-layer dynamics in response to natural and anthropogenic disturbance are less well understood, especially given the contribution of this layer to biological di- versity and ecosystem function (Gilliam, 2003). Within north- ern temperate forests in North America, the herbaceous layer often contains the highest species richness (Curtis, 1959; Whit- taker, 1967; Whitney & Foster, 1988; Scheiner & Istock, 1994; Gilliam, 2007) and represents a disproportionate amount of the net primary productivity relative to its biomass (DeAngelis et al., 1981). Land-use often leaves a legacy across a landscape that pro- vides an important historical context for interpreting contem- porary vegetation dynamics. The Great Lakes region was once dominated by a vast forest; the United States General Land Office Survey estimated circa 1850 that there were approxi- mately 32.6 million ha of closed-canopy forests with 47% or 15.3 million ha in the hardwood forest type (Frelich, 2002). Widespread logging in the Great Lakes region began in the mid-1800s, with an estimated 20 million ha of forested land harvested in 60 years (Williams, 1989). The rapid pace of commodity driven harvesting and associated slash fires left millions of hectares of cutover and degraded forests (Williams, 1989; Stearns, 1997). Contemporary forest management in northern hardwood for- ests in the Great Lakes region has focused on producing sus- tainable, high quality sawtimber using uneven-aged regenera- tion harvest methods (e.g., Arbogast, 1953; Arbogast, 1957; Tubbs, 1977) with forest diversity as a lower priority. However, decreases in understory tree diversity have been a common con- sequence of long-term, uneven-aged management in northern hardwood forests (Leak & Sendak, 2002; Kelty et al., 2003; Neuendorff et al., 2007; Gronewold et al., 2010). Studies in northern hardwood forests have shown varying responses in the herbaceous layer due to uneven-aged management (e.g. Metz- ger & Schultz, 1981; Crow et al., 2002; Scheller & Mladenoff, 2002; Kern et al., 2006; Wolf et al., 2008; Burton et al., 2009). Along the border of northern Wisconsin and the Upper Pen- insula of Michigan, Scheller and Mladenoff (2002) observed that actively managed uneven-aged northern hardwood stands had significantly greater herbaceous species richness than old-growth northern hardwood stands. Uneven-aged stands received management approximately ten to thirteen years prior to sampling. The greatest percent cover in all herbaceous spe- cies groups (ferns, forbs, weeds, graminoids , and shrubs) except *Present Address: Department of Wildland Resources, Utah State Univer- sity, Logan, UT 84322, U S A. 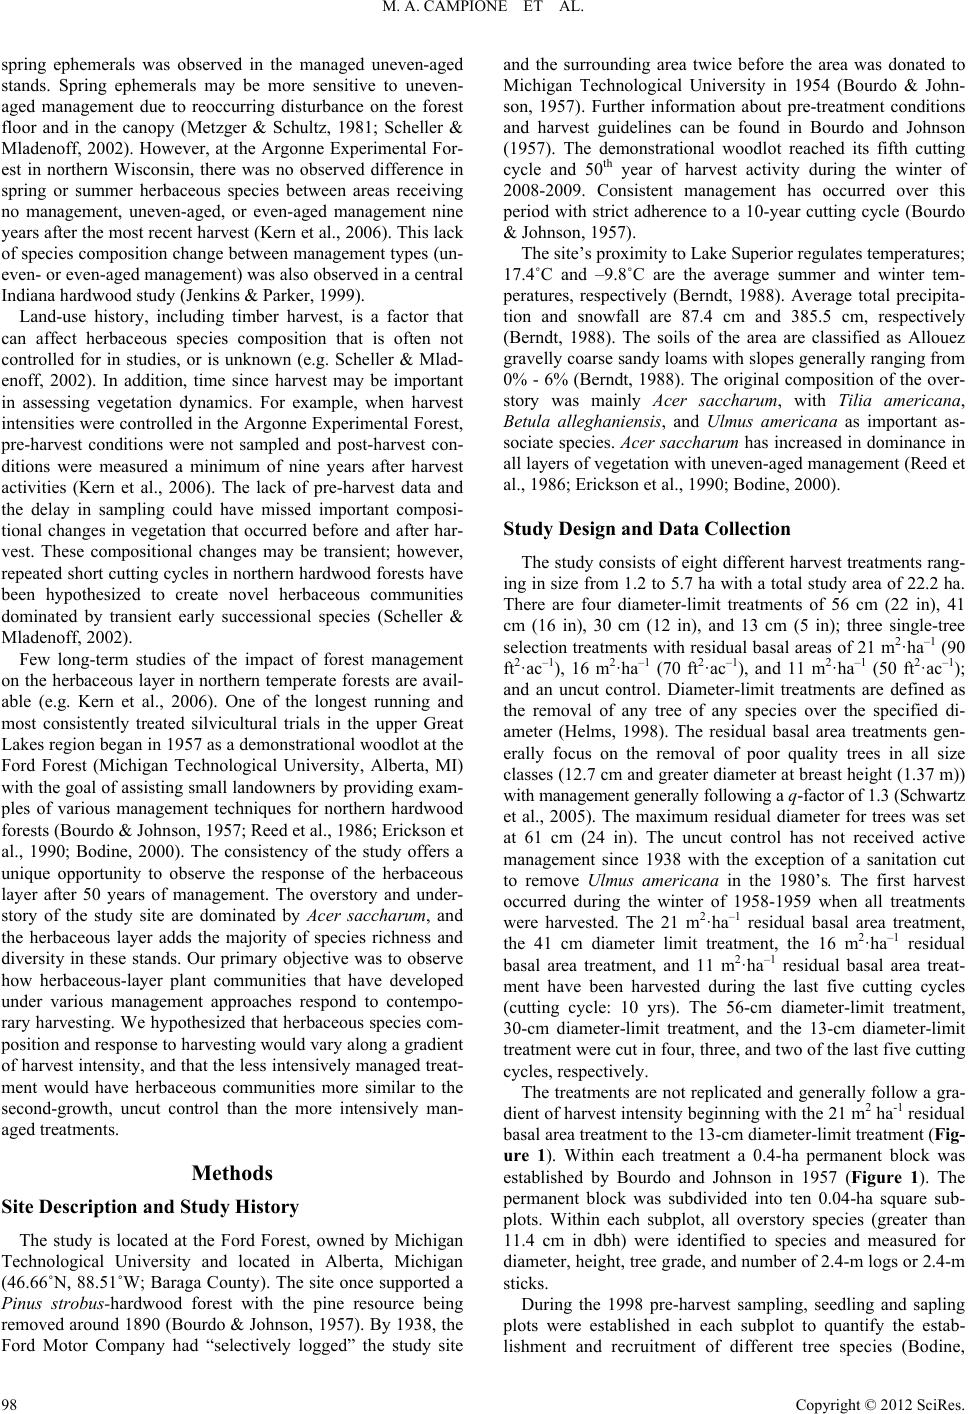 M. A. CAMPIONE ET AL. spring ephemerals was observed in the managed uneven-aged stands. Spring ephemerals may be more sensitive to uneven- aged management due to reoccurring disturbance on the forest floor and in the canopy (Metzger & Schultz, 1981; Scheller & Mladenoff, 2002). However, at the Argonne Experimental For- est in northern Wisconsin, there was no observed difference in spring or summer herbaceous species between areas receiving no management, uneven-aged, or even-aged management nine years after the most recent harvest (Kern et al., 2006). This lack of species composition change between management types (un- even- or even-aged management) was also observed in a central Indiana hardwood study (Jenkins & Parker, 1999). Land-use history, including timber harvest, is a factor that can affect herbaceous species composition that is often not controlled for in studies, or is unknown (e.g. Scheller & Mlad- enoff, 2002). In addition, time since harvest may be important in assessing vegetation dynamics. For example, when harvest intensities were controlled in the Argonne Experimental Forest, pre-harvest conditions were not sampled and post-harvest con- ditions were measured a minimum of nine years after harvest activities (Kern et al., 2006). The lack of pre-harvest data and the delay in sampling could have missed important composi- tional changes in vegetation that occurred before and after har- vest. These compositional changes may be transient; however, repeated short cutting cycles in northern hardwood forests have been hypothesized to create novel herbaceous communities dominated by transient early successional species (Scheller & Mladenoff, 2002). Few long-term studies of the impact of forest management on the herbaceous layer in northern temperate forests are avail- able (e.g. Kern et al., 2006). One of the longest running and most consistently treated silvicultural trials in the upper Great Lakes region began in 1957 as a demonstrational woodlot at the Ford Forest (Michigan Technological University, Alberta, MI) with the goal of assisting small landowners by providing exam- ples of various management techniques for northern hardwood forests (Bourdo & Johnson, 1957; Reed et al., 1986; Erickson et al., 1990; Bodine, 2000). The consistency of the study offers a unique opportunity to observe the response of the herbaceous layer after 50 years of management. The overstory and under- story of the study site are dominated by Acer saccharum, and the herbaceous layer adds the majority of species richness and diversity in these stands. Our primary objective was to observe how herbaceous-layer plant communities that have developed under various management approaches respond to contempo- rary harvesting. We hypothesized that herbaceous species com- position and response to harvesting would vary along a gradient of harvest intensity, and that the less intensively managed treat- ment would have herbaceous communities more similar to the second-growth, uncut control than the more intensively man- aged treatments. Methods Site Description an d S tudy History The study is located at the Ford Forest, owned by Michigan Technological University and located in Alberta, Michigan (46.66˚N, 88.51˚W; Baraga County). The site once supported a Pinus strobus-hardwood forest with the pine resource being removed around 1890 (Bourdo & Johnson, 1957). By 1938, the Ford Motor Company had “selectively logged” the study site and the surrounding area twice before the area was donated to Michigan Technological University in 1954 (Bourdo & John- son, 1957). Further information about pre-treatment conditions and harvest guidelines can be found in Bourdo and Johnson (1957). The demonstrational woodlot reached its fifth cutting cycle and 50th year of harvest activity during the winter of 2008-2009. Consistent management has occurred over this period with strict adherence to a 10-year cutting cycle (Bourdo & Johnson, 1957). The site’s proximity to Lake Superior regulates temperatures; 17.4˚C and –9.8˚C are the average summer and winter tem- peratures, respectively (Berndt, 1988). Average total precipita- tion and snowfall are 87.4 cm and 385.5 cm, respectively (Berndt, 1988). The soils of the area are classified as Allouez gravelly coarse sandy loams with slopes generally ranging from 0% - 6% (Berndt, 1988). The original composition of the over- story was mainly Acer saccharum, with Tilia americana, Betula alleghaniensis, and Ulmus americana as important as- sociate species. Acer saccharum has increased in dominance in all layers of vegetation with uneven-aged management (Reed et al., 1986; Erickson et al., 1990; Bodine, 2000). Study Design an d D at a C ol l ecti on The study consists of eight different harvest treatments rang- ing in size from 1.2 to 5.7 ha with a total study area of 22.2 ha. There are four diameter-limit treatments of 56 cm (22 in), 41 cm (16 in), 30 cm (12 in), and 13 cm (5 in); three single-tree selection treatments with residual basal areas of 21 m2·ha–1 (90 ft2·ac–1), 16 m2·ha–1 (70 ft2·ac–1), and 11 m2·ha–1 (50 ft2·ac–1); and an uncut control. Diameter-limit treatments are defined as the removal of any tree of any species over the specified di- ameter (Helms, 1998). The residual basal area treatments gen- erally focus on the removal of poor quality trees in all size classes (12.7 cm and greater diameter at breast height (1.37 m)) with managemen t generally following a q-factor of 1.3 (Schwartz et al., 2005). The maximum residual diameter for trees was set at 61 cm (24 in). The uncut control has not received active management since 1938 with the exception of a sanitation cut to remove Ulmus americana in the 1980’s. The first harvest occurred during the winter of 1958-1959 when all treatments were harvested. The 21 m2·ha–1 residual basal area treatment, the 41 cm diameter limit treatment, the 16 m2·ha–1 residual basal area treatment, and 11 m2·ha–1 residual basal area treat- ment have been harvested during the last five cutting cycles (cutting cycle: 10 yrs). The 56-cm diameter-limit treatment, 30-cm diameter-limit treatment, and the 13-cm diameter-limit treatment were cut in four, three, and two of the last five cutting cycles, respectively. The treatments are not replicated and generally follow a gra- dient of harvest intensity beginning with the 21 m2 ha-1 residual basal area treatment to the 13-cm diameter-limit treatment (Fig- ure 1). Within each treatment a 0.4-ha permanent block was established by Bourdo and Johnson in 1957 (Figure 1). The permanent block was subdivided into ten 0.04-ha square sub- plots. Within each subplot, all overstory species (greater than 11.4 cm in dbh) were identified to species and measured for diameter, height, tree grade, and number of 2.4-m logs or 2.4-m sticks. During the 1998 pre-harvest sampling, seedling and sapling plots were established in each subplot to quantify the estab- lishment and recruitment of different tree species (Bodine, Copyright © 2012 SciRes. 98 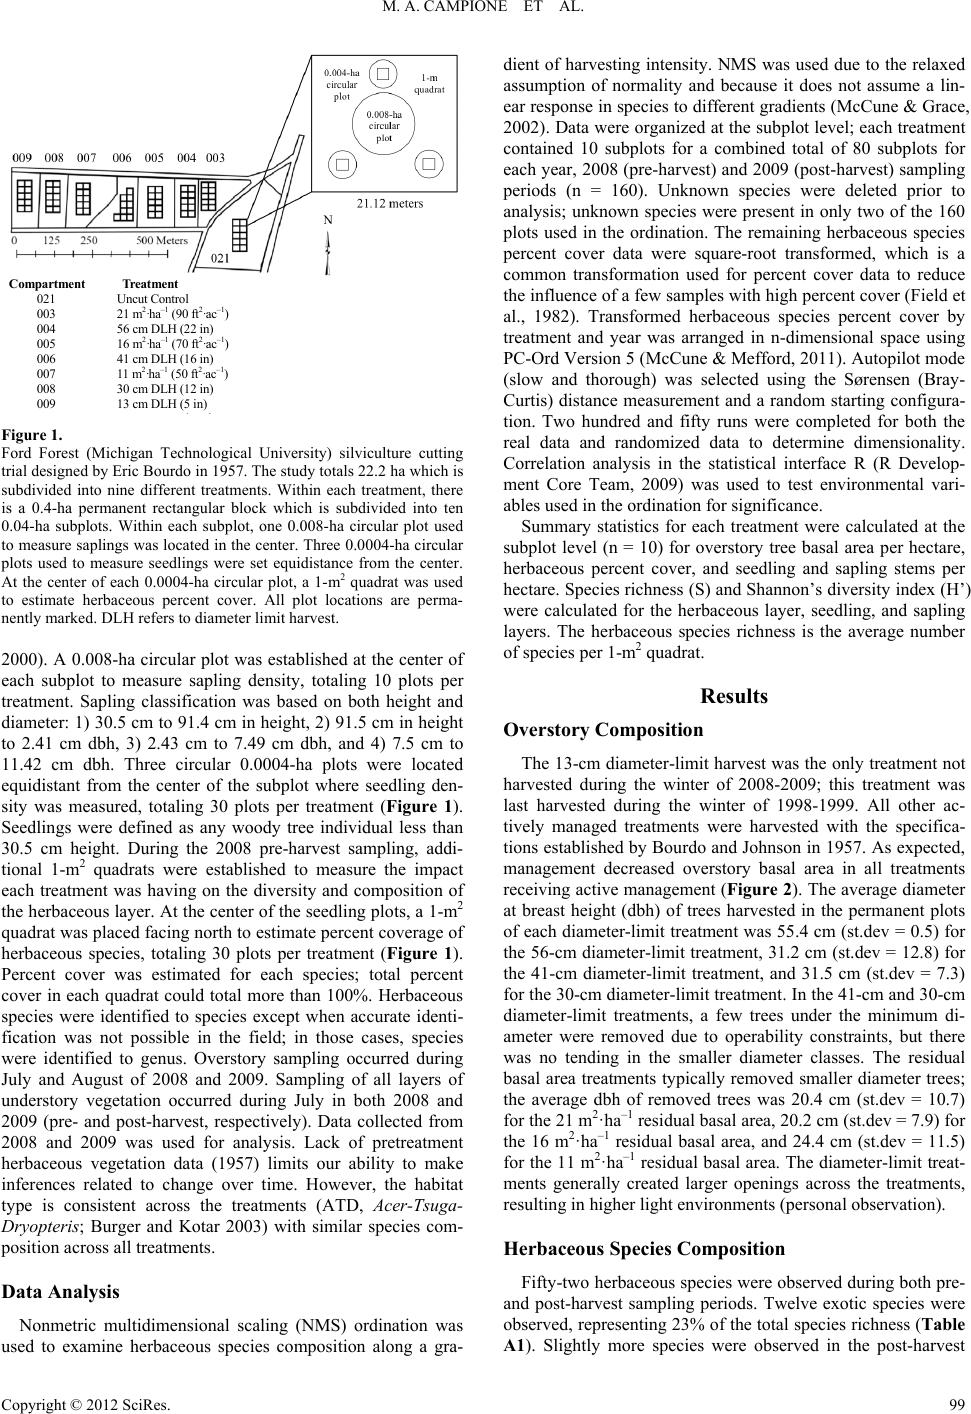 M. A. CAMPIONE ET AL. Compartment Treatment 021 Uncut Control 003 21 m2·h a–1 (90 ft2·ac–1) 004 56 cm DLH (22 in) 005 16 m2·h a–1 (70 ft2·ac–1) 006 41 cm DLH (16 in) 007 11 m2·ha–1 (50 ft2·a c–1) 008 30 cm DLH (12 in) 009 13 cm DLH (5 in) Figure 1. Ford Forest (Michigan Technological University) silviculture cutting trial designed by Eric Bourdo in 1957. The study totals 22.2 ha which is subdivided into nine different treatments. Within each treatment, there is a 0.4-ha permanent rectangular block which is subdivided into ten 0.04-ha subplots. Within each subplot, one 0.008-ha circular plot used to measure saplings was located in the center. Three 0.0004-ha circular plots used to measure seedlings were set equidistance from the center. At the center of each 0.0004-ha circular plot, a 1-m2 quadrat was used to estimate herbaceous percent cover. All plot locations are perma- nently marked. DLH refers to diameter limit harvest. 2000). A 0.008-ha circular plot was established at the center of each subplot to measure sapling density, totaling 10 plots per treatment. Sapling classification was based on both height and diameter: 1) 30.5 cm to 91.4 cm in height, 2) 91.5 cm in height to 2.41 cm dbh, 3) 2.43 cm to 7.49 cm dbh, and 4) 7.5 cm to 11.42 cm dbh. Three circular 0.0004-ha plots were located equidistant from the center of the subplot where seedling den- sity was measured, totaling 30 plots per treatment (Figure 1). Seedlings were defined as any woody tree individual less than 30.5 cm height. During the 2008 pre-harvest sampling, addi- tional 1-m2 quadrats were established to measure the impact each treatment was having on the diversity and composition of the herbaceous layer. At the center of the seedling plots, a 1-m2 quadrat was placed facing north to estimate percent coverage of herbaceous species, totaling 30 plots per treatment (Figure 1). Percent cover was estimated for each species; total percent cover in each quadrat could total more than 100%. Herbaceous species were identified to species except when accurate identi- fication was not possible in the field; in those cases, species were identified to genus. Overstory sampling occurred during July and August of 2008 and 2009. Sampling of all layers of understory vegetation occurred during July in both 2008 and 2009 (pre- and post-harvest, respectively). Data collected from 2008 and 2009 was used for analysis. Lack of pretreatment herbaceous vegetation data (1957) limits our ability to make inferences related to change over time. However, the habitat type is consistent across the treatments (ATD, Acer-Tsuga- Dryopteris; Burger and Kotar 2003) with similar species com- position across all treatments. Data Analysis Nonmetric multidimensional scaling (NMS) ordination was used to examine herbaceous species composition along a gra- dient of harvesting intensity. NMS was used due to the relaxed assumption of normality and because it does not assume a lin- ear response in species to different gradients (McCune & Grace, 2002). Data were organized at the subplot level; each treatment contained 10 subplots for a combined total of 80 subplots for each year, 2008 (pre-harvest) and 2009 (post-harvest) sampling periods (n = 160). Unknown species were deleted prior to analysis; unknown species were present in only two of the 160 plots used in the ordination. The remaining herbaceous species percent cover data were square-root transformed, which is a common transformation used for percent cover data to reduce the influence of a few samples with high percent cover (Field et al., 1982). Transformed herbaceous species percent cover by treatment and year was arranged in n-dimensional space using PC-Ord Version 5 (McCune & Mefford, 2011). Autopilot mode (slow and thorough) was selected using the Sørensen (Bray- Curtis) distance measurement and a random starting configura- tion. Two hundred and fifty runs were completed for both the real data and randomized data to determine dimensionality. Correlation analysis in the statistical interface R (R Develop- ment Core Team, 2009) was used to test environmental vari- ables used in the ordination for significance. Summary statistics for each treatment were calculated at the subplot level (n = 10) for overstory tree basal area per hectare, herbaceous percent cover, and seedling and sapling stems per hectare. Species richness (S) and Shannon’s diversity index (H’) were calculated for the herbaceous layer, seedling, and sapling layers. The herbaceous species richness is the average number of species per 1-m2 quadrat. Results Overstory Composition The 13-cm diameter-limit harvest was the only treatment not harvested during the winter of 2008-2009; this treatment was last harvested during the winter of 1998-1999. All other ac- tively managed treatments were harvested with the specifica- tions established by Bourdo and Johnson in 1957. As expected, management decreased overstory basal area in all treatments receiving active management (Figure 2). The average diameter at breast height (dbh) of trees harvested in the permanent plots of each diameter-limit treatment was 55.4 cm (st.dev = 0.5) for the 56-cm diameter-limit treatment, 31.2 cm (st.dev = 12.8) for the 41-cm diameter-limit treatment, and 31.5 cm (st.dev = 7.3) for the 30-cm diameter-limit treatment. In the 41-cm and 30-cm diameter-limit treatments, a few trees under the minimum di- ameter were removed due to operability constraints, but there was no tending in the smaller diameter classes. The residual basal area treatments typically removed smaller diameter trees; the average dbh of removed trees was 20.4 cm (st.dev = 10.7) for the 21 m2·ha–1 residual basal area, 20.2 cm (st.dev = 7.9) for the 16 m2·ha–1 residual basal area, and 24.4 cm (st.dev = 11.5) for the 11 m2·ha–1 residual basal area. The diameter-limit treat- ments generally created larger openings across the treatments, resulting in higher light environments (personal observation). Herbaceous Species Composition Fifty-two herbaceous species were observed during both pre- and post-harvest sampling periods. Twelve exotic species were observed, representing 23% of the total species richness (Table 1). Slightly more species were observed in the post-harvest A Copyright © 2012 SciRes. 99 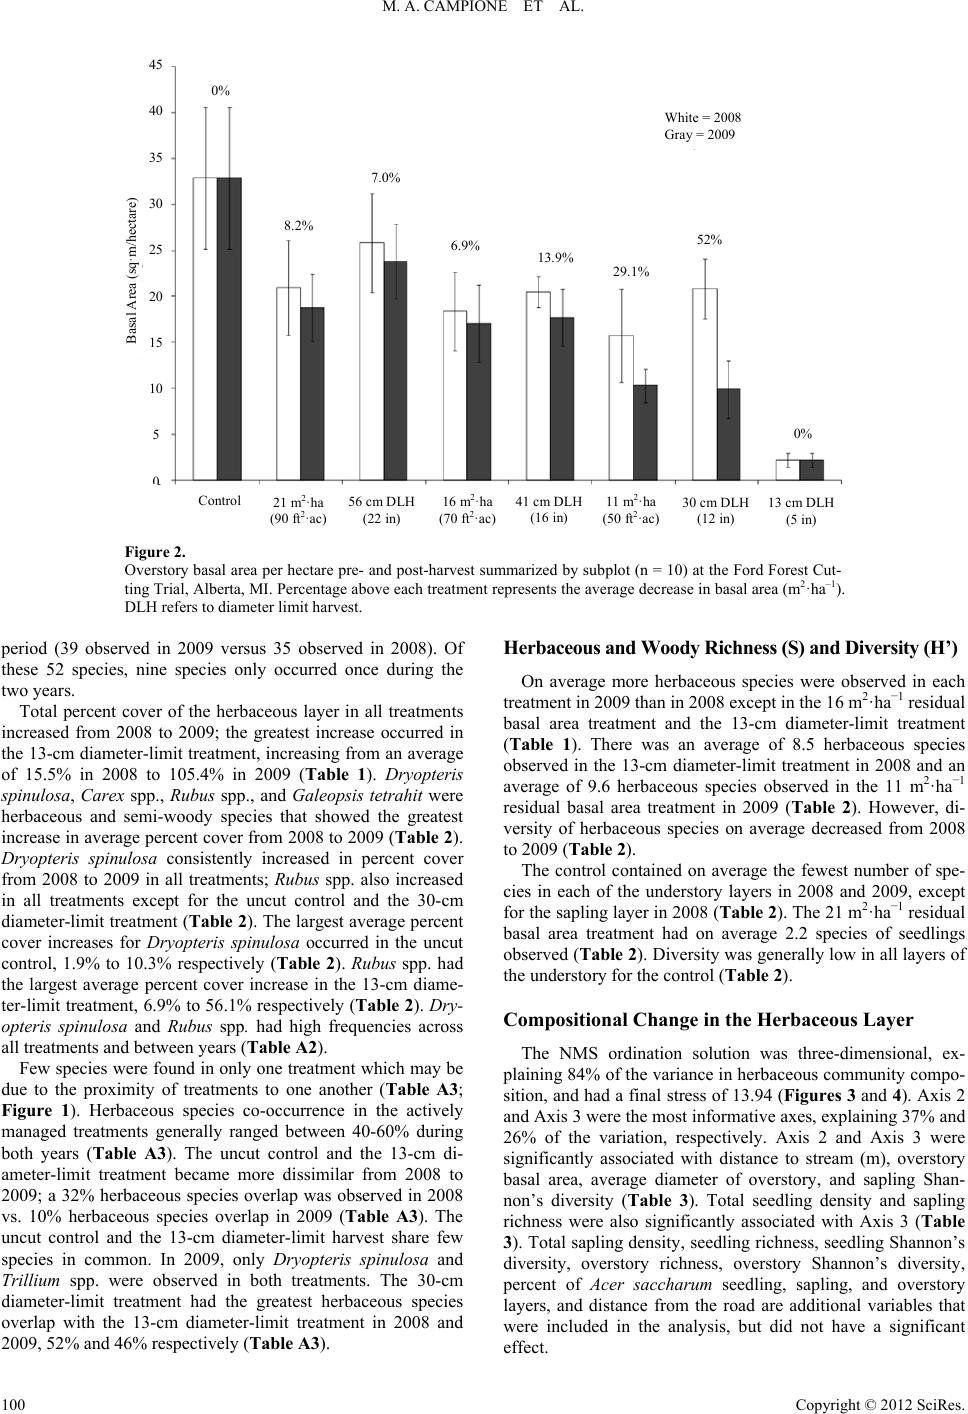 M. A. CAMPIONE ET AL. Copyright © 2012 SciRes. 100 21 m 2 ·ha (90 ft 2 ·ac) 56 cm DLH (22 in) 16 m 2 ·ha (70 ft 2 ·ac) 11 m 2 ·ha (50 ft 2 ·ac) 41 cm DLH (16 in) 30 cm DLH (12 in) 13 cm DLH (5 in) Control White = 2008 Gray = 2009 52% 0% 29.1% 13.9% 6.9% 7.0% 8.2% 0% 45 40 35 30 25 20 15 10 5 Basal Area (sq·m/hectare) Figure 2. Overstory basal area per hectare pre- and post-harvest summarized by subplot (n = 10) at the Ford Forest Cut- ting Trial, Alberta, MI. Percentage above each treatment represents the average decrease in basal area (m2·ha–1). DLH refers to diameter limit harvest. Herbace ous an d Woo dy Rich ness (S ) and Di versi ty (H’ ) period (39 observed in 2009 versus 35 observed in 2008). Of these 52 species, nine species only occurred once during the two years. On average more herbaceous species were observed in each treatment in 2009 than in 2008 except in the 16 m2·ha–1 residual basal area treatment and the 13-cm diameter-limit treatment (Table 1). There was an average of 8.5 herbaceous species observed in the 13-cm diameter-limit treatment in 2008 and an average of 9.6 herbaceous species observed in the 11 m2·ha–1 residual basal area treatment in 2009 (Table 2). However, di- versity of herbaceous species on average decreased from 2008 to 2009 (Table 2). Total percent cover of the herbaceous layer in all treatments increased from 2008 to 2009; the greatest increase occurred in the 13-cm diameter-limit treatment, increasing from an average of 15.5% in 2008 to 105.4% in 2009 (Table 1). Dryopteris spinulosa, Carex spp., Rubus spp., and Galeopsis tetrahit were herbaceous and semi-woody species that showed the greatest increase in average percent cover from 2008 to 2009 (Table 2). Dryopteris spinulosa consistently increased in percent cover from 2008 to 2009 in all treatments; Rubus spp. also increased in all treatments except for the uncut control and the 30-cm diameter-limit treatment (Table 2). The largest average percent cover increases for Dryopteris spinulosa occurred in the uncut control, 1.9% to 10.3% respectively (Table 2). Rubus spp. had the largest average percent cover increase in the 13-cm diame- ter-limit treatment, 6.9% to 56.1% respectively (Table 2). Dry- opteris spinulosa and Rubus spp. had high frequencies across all treatments an d between years (Table A2). The control contained on average the fewest number of spe- cies in each of the understory layers in 2008 and 2009, except for the sapling layer in 2008 (Table 2). The 21 m2·ha–1 residual basal area treatment had on average 2.2 species of seedlings observed (Table 2). Diversity was generally low in all layers of the understory for the control (Table 2). Compositional Change in the Herbaceous Layer The NMS ordination solution was three-dimensional, ex- plaining 84% of the variance in herbaceous community compo- sition, and had a final stress of 13.94 (Figures 3 and 4). Axis 2 and Axis 3 were the most informative axes, explaining 37% and 26% of the variation, respectively. Axis 2 and Axis 3 were significantly associated with distance to stream (m), overstory basal area, average diameter of overstory, and sapling Shan- non’s diversity (Table 3). Total seedling density and sapling richness were also significantly associated with Axis 3 (Table 3). Total sapling density, seedling richness, seedling Shannon’s diversity, overstory richness, overstory Shannon’s diversity, percent of Acer saccharum seedling, sapling, and overstory layers, and distance from the road are additional variables that were included in the analysis, but did not have a significant ffect. Few species were found in only one treatment which may be due to the proximity of treatments to one another (Table A3; Figure 1). Herbaceous species co-occurrence in the actively managed treatments generally ranged between 40-60% during both years (Table A3). The uncut control and the 13-cm di- ameter-limit treatment became more dissimilar from 2008 to 2009; a 32% herbaceous species overlap was observed in 2008 vs. 10% herbaceous species overlap in 2009 (Table A3). The uncut control and the 13-cm diameter-limit harvest share few species in common. In 2009, only Dryopteris spinulosa and Trillium spp. were observed in both treatments. The 30-cm diameter-limit treatment had the greatest herbaceous species overlap with the 13-cm diameter-limit treatment in 2008 and 2009, 52% and 46% respectively (Table A3). e 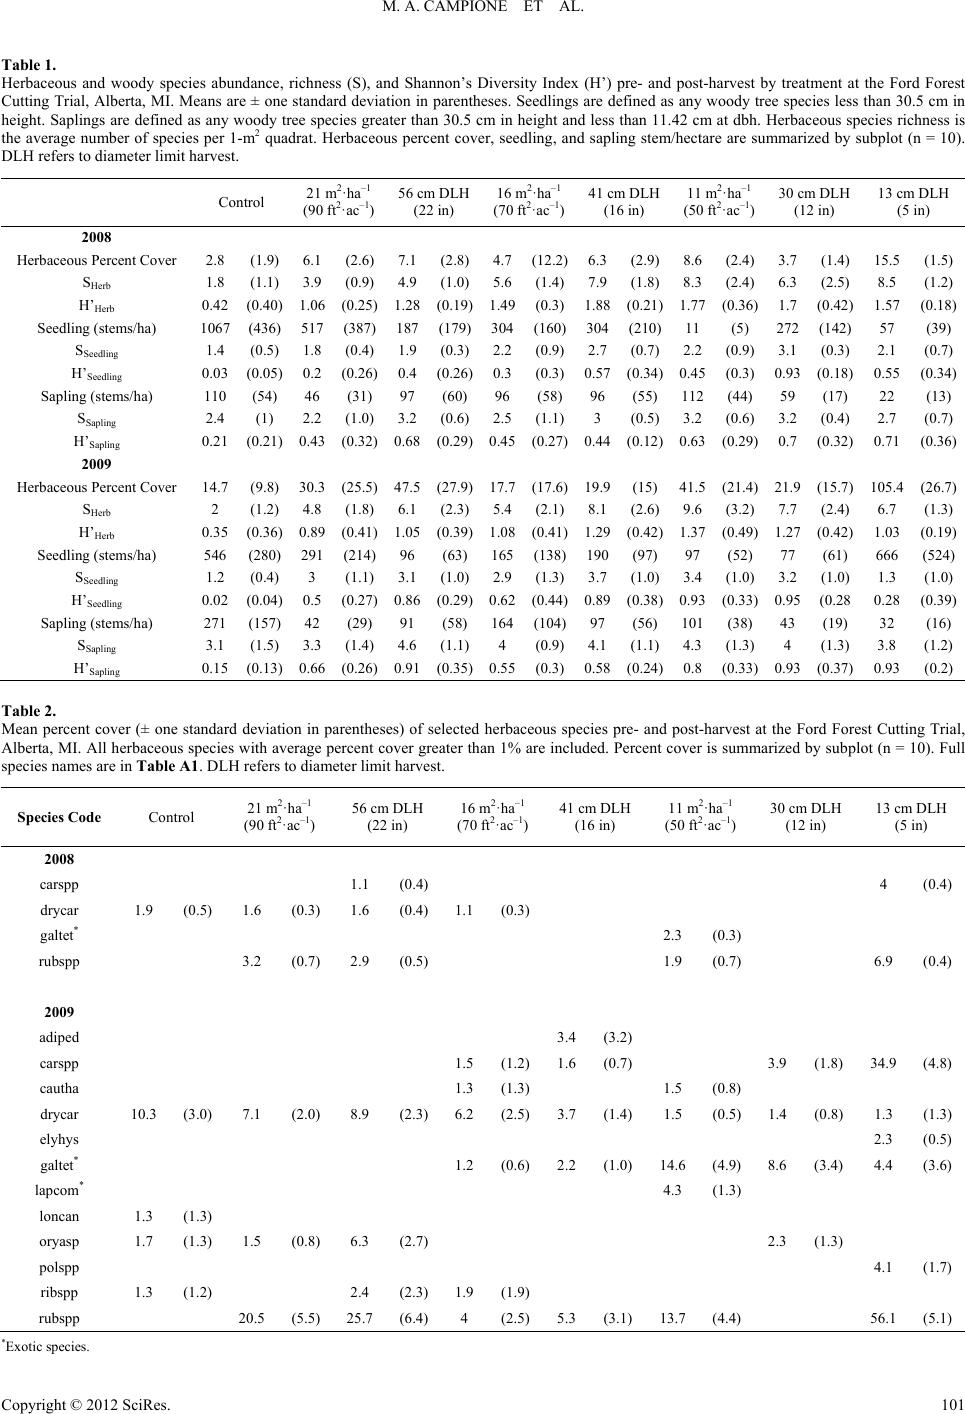 M. A. CAMPIONE ET AL. Table 1. Herbaceous and woody species abundance, richness (S), and Shannon’s Diversity Index (H’) pre- and post-harvest by treatment at the Ford Forest ial, Alberta, MI. Means are ± one standard deviation in parentheses. Seedlings are defined as any woody tree species less than 30.5 cm in rol (90 ft2·ac–1) (22 in) (70 ft2·ac–1)(16 in) (50 ft2·ac–1) (12 in) (5 in) Cutting Tr height. Saplings are defined as any woody tree species greater than 30.5 cm in height and less than 11.42 cm at dbh. Herbaceous species richness is the average number of species per 1-m2 quadrat. Herbaceous percent cover, seedling, and sapling stem/hectare are summarized by subplot (n = 10). DLH refers to diameter limit harvest. Cont 21 m2·ha–1 56 cm DLH16 m2·ha–1 41 cm DLH11 m2·ha–1 30 cm DLH 13 cm DLH 208 0 Herbaceous Percent Cover 2.) 7.)6.)3.) 15.5) 1.(1.) 3.) 4.(1.)5.(1.)7.(1.)8.(2.) 6.) 8.(1.) Seedlins/ha) Sapli/ha) Herbacet Cover (1.) 4.) 6.(2.)5.(2.)8.(2.)9.(3.) 7.) 6.(1.) Seedlins/ha) 5 Sapli/ha) 8 (1.96.1 (2.6) 1(2.84.7 (12.2)3(2.98.6(2.4) 7 (1.45(1. SHerb 8 19 (0.9906498343 (2.55 2 H’Herb 0.42 (0.40) 1.06 (0.25) 1.28(0.19)1.49(0.3)1.88(0.21)1.77(0.36) 1.7 (0.42) 1.57(0.18) g (stem1067 (436) 517 (387) 187(179)304(160)304(210)11(5) 272 (142) 57 (39) SSeedling 1.4 (0.5) 1.8 (0.4) 1.9(0.3)2.2(0.9)2.7(0.7)2.2(0.9) 3.1 (0.3) 2.1 (0.7) H’Seedling 0.03 (0.05) 0.2 (0.26) 0.4(0.26)0.3(0.3)0.57 (0.34) 0.45(0.3) 0.93 (0.18) 0.55(0.34) ng (stems110 (54) 46 (31) 97(60)96(58)96(55) 112 (44) 59 (17) 22 (13) SSapling 2.4 (1) 2.2 (1.0) 3.2(0.6)2.5(1.1)3 (0.5)3.2(0.6) 3.2 (0.4) 2.7 (0.7) H’Sapling 0.21 (0.21) 0.43 (0.32) 0.68(0.29)0.45(0.27)0.44(0.12)0.63(0.29) 0.7 (0.32) 0.71(0.36) 2009 ous Percen14.7 (9.8) 30.3 (25.5) 47.5(27.9)17.7(17.6)19.9(15)41.5(21.4) 21.9 (15.7) 105.4(26.7) SHerb 2 28 (1.8134116627 (2.47 3 H’Herb 0.35 (0.36) 0.89 (0.41) 1.05(0.39)1.08(0.41)1.29(0.42)1.37(0.49) 1.27 (0.42) 1.03(0.19) g (stem46(280) 291 (214) 96(63) 165(138)190 (97)97(52) 77 (61) 666(524) SSeedling 1.2 (0.4) 3 (1.1) 3.1(1.0)2.9(1.3)3.7(1.0)3.4(1.0) 3.2 (1.0) 1.3 (1.0) H’Seedling 0.02 (0.04) 0.5 (0.27) 0.86 (0.29) 0.62 (0.44) 0.89 (0.38) 0.93 (0.33) 0.95 (0.28 0.28(0.39) ng (stems271 (157) 42 (29) 91(58)164(104) 97(56) 101 (38) 43 (19) 32 (16) SSapling 3.1 (1.5) 3.3 (1.4) 4.6(1.1)4 (0.9)4.1(1.1)4.3(1.3) 4 (1.3) 3.8 (1.2) H’Sapling 0.15 (0.13) 0.66 (0.26) 0.91(0.35)0.55(0.3)0.58(0.24)0.8(0.33) 0.93 (0.37) 0.93(0.2) Table 2. Mean percent cover (± one standard deviation in parentheses) of selectederbaceous species pre- and post-harvest at the Ford Forest Cutting Trial, . All herbaceous species with average percent cover greater th 1% are included. Percent cover is summarized by subplot (n = 10). Full (90 ft·ac) (22 in) 16 m·ha (70 ft2·ac–1) 41 cm DLH (16 in) 11 m·ha (50 ft2·ac–1) 30 cm DLH (12 in) 13 cm DLH (5 in) h anAlberta, MI species names are in Table A1. DLH refers to diameter limit harvest. Species Code Control 21 m2·ha–1 2–1 56 cm DLH 2–1 2–1 2008 carspp 1.1 (0.4)4 (0.4) 1.) 1.) 1.(0.) 1(0.) 2.3 (0.3) 1.9 (0.7) 6.9 (0.4) ad 3.(3. ) 1.(1. )1.(0.) 3.) 3(4.) 1.3 (1.3) 1.5 (0.8) 10.3 (3.0) 7.1 (2.0) 8.9 (2.3)1.5 (0.5) 2.3 (0.5) 4.3 (1.3) 1.3 (1.3) 1.7 (1.3) 1.5 (0.8) 6.3 (2.7) 2.3 (1.3) 4.1 (1.7) 1.9 (1.9) 20.5 (5.5) 25.7 (6.4)4 (2.5)5.3(3.1)13.7(4.4) drycar 9 (0.56 (0.36 4.13 galtet* rubspp 3.2 (0.7) 2.9 (0.5) 2009 iped 4 2 carspp 5 2 6 79 (1.84.98 cautha drycar 6.2(2.5)3.7(1.4)1.4 (0.8) 1.3 (1.3) elyhys galtet* 1.2(0.6)2.2(1.0)14.6(4.9) 8.6 (3.4) 4.4 (3.6) lapcom* loncan oryasp polspp ribspp 1.3 (1.2) 2.4 (2.3) rubspp 56.1(5.1) *Exoti c species. Copyright © 2012 SciRes. 101 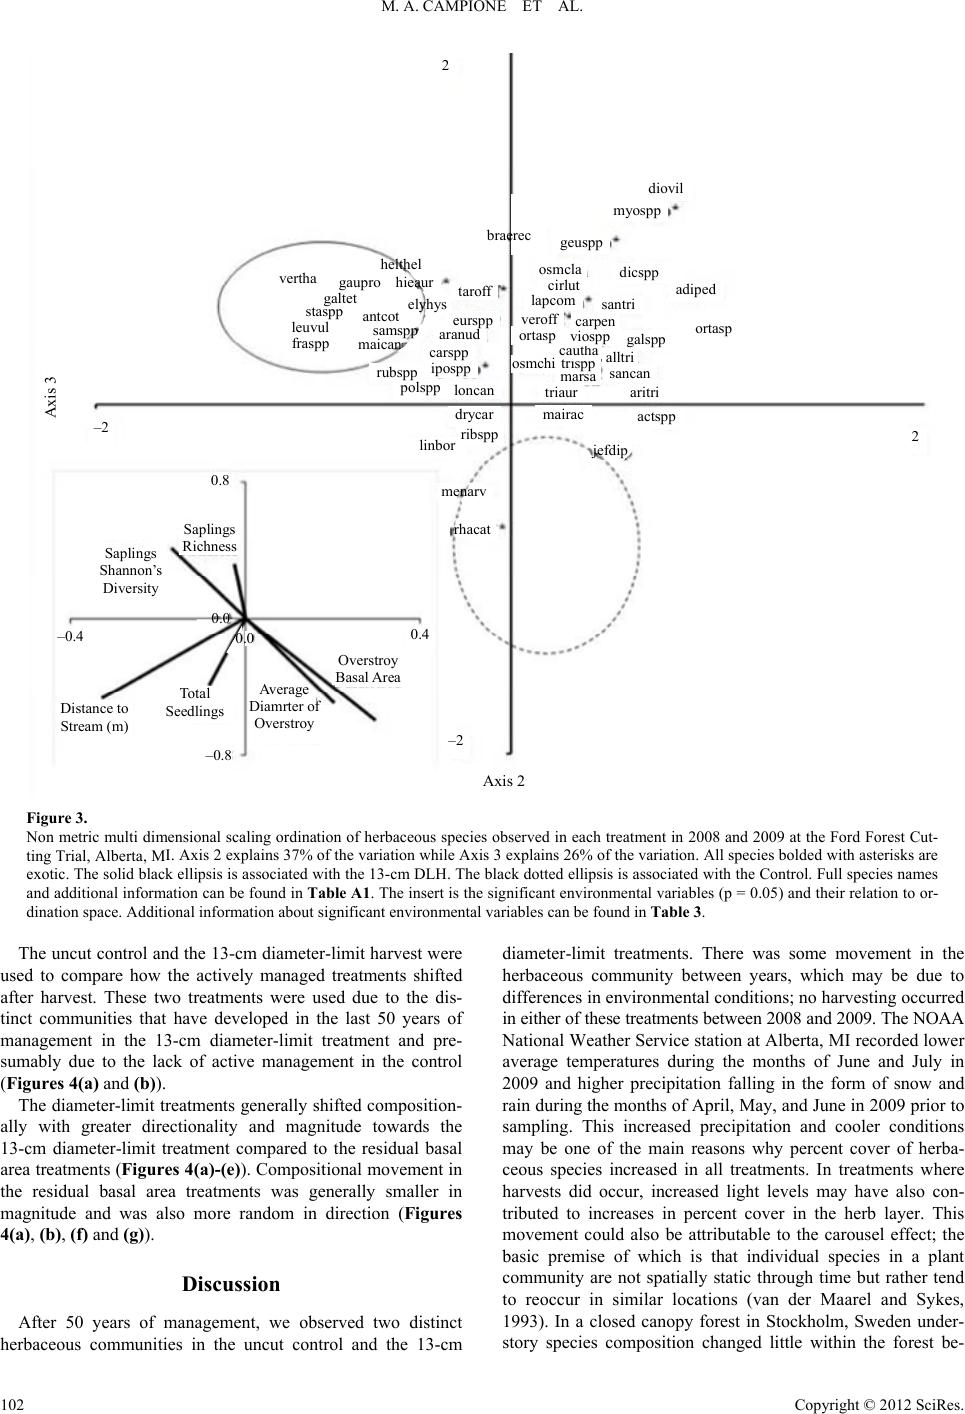 M. A. CAMPIONE ET AL. Axis 2 Axis 3 2 2 –2 –2 –0.8 –0.4 0.4 0.8 0.0 0.0 Saplings Richness Saplings Shannon’s Diversity Distance to Stream (m) Total Seedlings Average Diamrter o Overstroy Overstroy Basal Area adiped dicspp diovil myospp geuspp galspp actspp mairac linbor ribspp drycar aritri sancan alltri triaur marsa trispp osmchi cautha viospp carpen ortasp ortasp santri osmc la cirlut lapcom veroff loncan polspp rubspp ipospp carspp aranud eurspp taroff vertha fraspp leuvul staspp galtet gaupro antcot el yhys hieaur helthel samspp maican menarv rhacat jefdip braerec Figure 3. Non metric multi dimensional scaling ordination of herbaceous species observed in each treatment in 2008 and 2009 at the Ford Forest Cut- I. Axis 2 explains 37% of the variation while Axis 3 explains 26% of the variation. All species bolded with asterisks are T se f Discussion After 50 years of m observed two distinct herbaceous communitiecontrol and the 13-cm the years, which may be due to di ting Trial, Alberta, M exotic. The solid black ellipsis is associated with the 13-cm DLH. The black dotted ellipsis is associated with the Control. Full species names and additional information can be found in Table A1. The insert is the significant environmental variables (p = 0.05) and their relation to or- dination space. Additional information about significant environmental variables can be found in Table 3. he uncut control and the 13-cm diameter-limit harvest were d to compare how the actively managed treatments shifted diameter-limit treatments. There was some movement in herbaceous community between u ater harvest. These two treatments were used due to the dis- tinct communities that have developed in the last 50 years of management in the 13-cm diameter-limit treatment and pre- sumably due to the lack of active management in the control (Figures 4(a) and (b)). The diameter-limit treatments generally shifted composition- ally with greater directionality and magnitude towards the 13-cm diameter-limit treatment compared to the residual basal area treatments (Figures 4(a)-(e)). Compositional movement in the residual basal area treatments was generally smaller in magnitude and was also more random in direction (Figures 4(a), (b), (f) and (g)). anagement, we s in the uncut fferences in environmental conditions; no harvesting occurred in either of these treatments bet ween 2008 and 2009. The NOAA National Weather Service station at Alberta, MI recorded lower average temperatures during the months of June and July in 2009 and higher precipitation falling in the form of snow and rain during the months of April, May, and June in 2009 prior to sampling. This increased precipitation and cooler conditions may be one of the main reasons why percent cover of herba- ceous species increased in all treatments. In treatments where harvests did occur, increased light levels may have also con- tributed to increases in percent cover in the herb layer. This movement could also be attributable to the carousel effect; the basic premise of which is that individual species in a plant community are not spatially static through time but rather tend to reoccur in similar locations (van der Maarel and Sykes, 1993). In a closed canopy forest in Stockholm, Sweden under- story species composition changed little within the forest be- Copyright © 2012 SciRes. 102 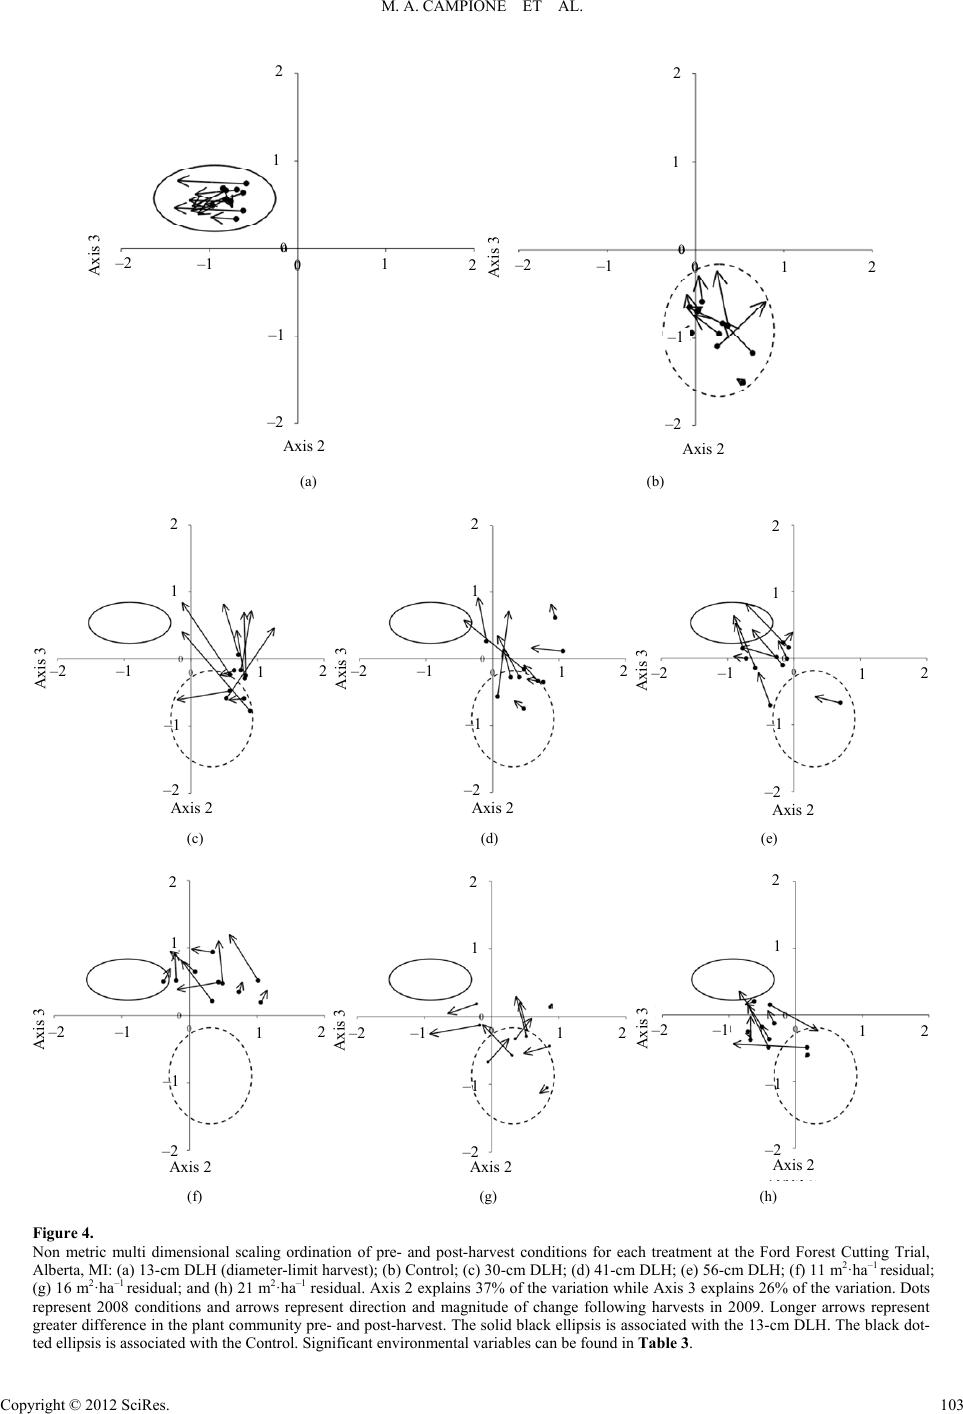 M. A. CAMPIONE ET AL. Axis 2 Axis 3 2 2 1 1 Axis 3 2 –2 –2 –1 –1 1–2 Axis 2 2 –1 –1 –2 1 0 0 0 0 (a) (b) Axis 2 Axis 3 2 2 –2 –2 1 –1 1 22 11 –1 Axis 2 Axis 3 Axis 3 2 –2 –2 –1 1 Axis 2 2 –2 –2 –1 1 –1 –1 (c) (d) (e) Axis 3 2 2 –2 –2 1 –1 1 –1 Axis 2 Axis 3 2 2 –2 –2 1 –1 1 –1 Axis 2 Axis 3 2 2 –2 –2 1 –1 1 –1 Axis 2 (f) (g) (h) Figure 4. Non metric multi dime Forest Cutting Trial, Alberta, MI: (a) 1 3-c m (f) 11 m2·ha–1 residual; a–1 residual; and (h) 21 m2·ha–1 residual. Axis 2 explains 37% of the variation while Axis 3 explains 26% of the variation. Dots nsional scaling ordination of pre- and post-harvest conditions for each treatment at the Ford DLH (diameter-li mit harv est); (b ) Co ntrol; (c) 3 0-c m DLH; (d ) 41 -cm DLH; (e) 56 -cm DLH; (g) 16 m2·h represent 2008 conditions and arrows represent direction and magnitude of change following harvests in 2009. Longer arrows represent greater difference in the plant community pre- and post-harvest. The solid black ellipsis is associated with the 13-cm DLH. The black dot- ted ellipsis is associated with the Control. Significant environmental variables can be found in Table 3. Copyright © 2012 SciRes. 103 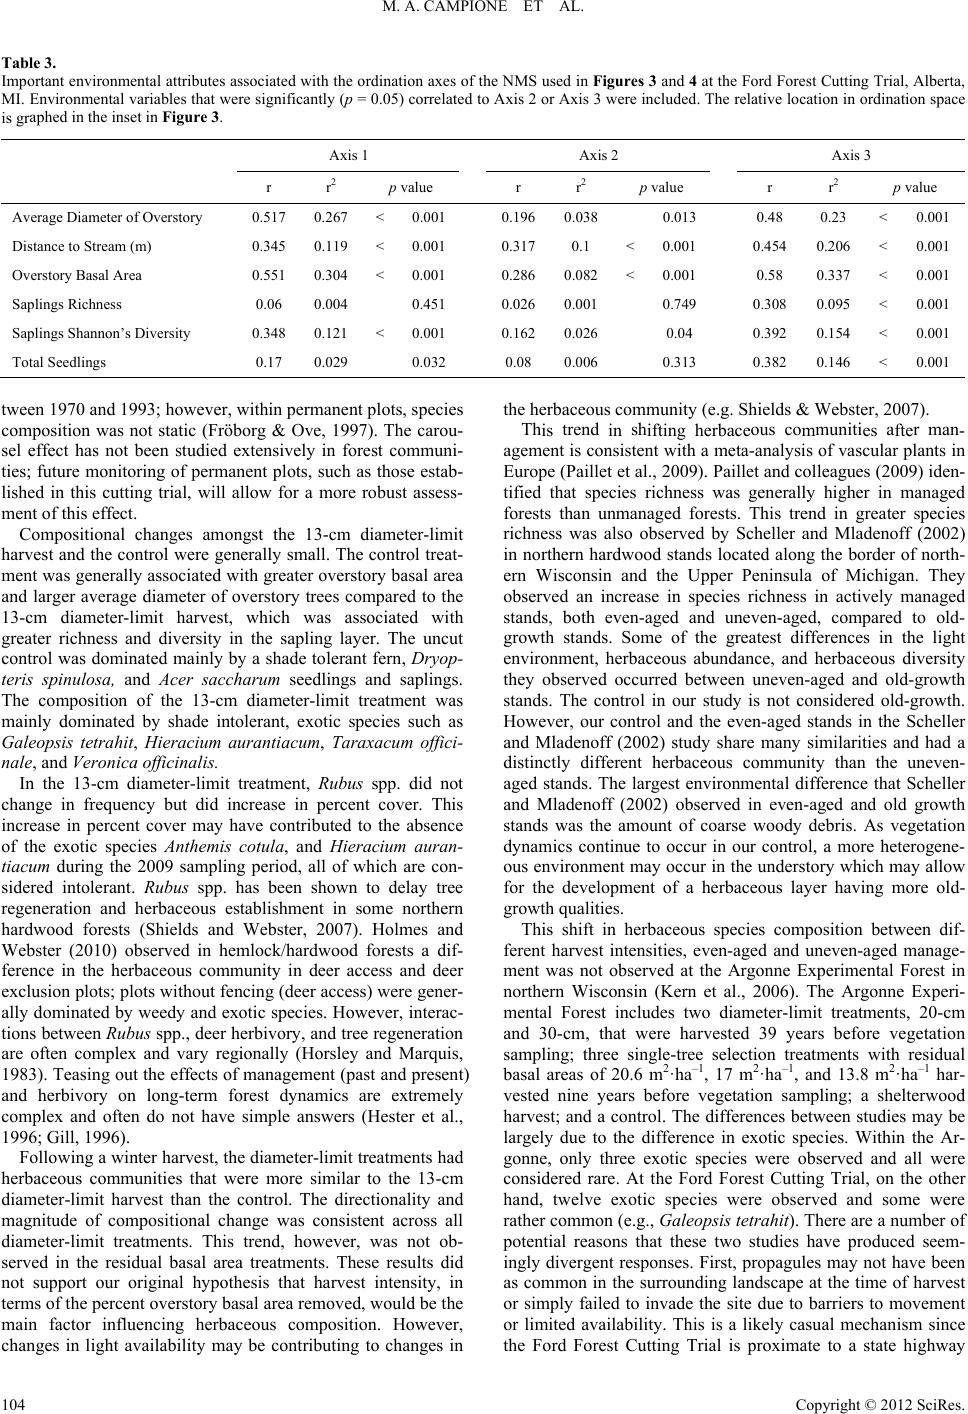 M. A. CAMPIONE ET AL. Tab Imprta, MI. ce is gr le 3. ortant environmental attributes associated with the ordination axes of the NMS used in Figures 3 and 4 at the Ford Forest Cutting Trial, Albe Environmental variables that were significantly (p = 0.05) correlated to Axis 2 or Axis 3 were included. The relative location in ordination spa aphed in the inset in Figure 3. Axis 1 Axis 2 Axis 3 r r2 p value r r2 p value r r2 p value Average Diameteverstory 0.517 0.0.0010.1960. 0.013 0.48 0.<0.001 r of O267 <03823 Distance to Stream (m) 0.345 0.9 <1 0.70 <1 0.4 0.6 <1 Overstory Basal Area 0.551 0.304 <0.001 0.2860.082 < 0.001 0.58 0.337 <0.001 0. rsity 0. 11 0.0031 .10.0045 200.00 Saplings Richness 0.06 0.004 0.4510.026 0.001 0.749 308 0.095 <0.001 Saplings Shan no n’s D Total Seedlings ive 0.348 0. 0.17 121 0.029 < 0.001 0.032 0.162 0.08 0. 0.026 006 0.04 0.313 0.392 0. 382 0. 154 146 < < 0.001 0.001 tver, wermanent plots, composition was not static (FröboOv7). et been studied extensy es com erbaceous comShields & Webster, 2007 is in ifting herbacemesfte- ent s meta-analysis of vscular plan 2 –12 –12 –1 ween 1970 and 1993; howeithin p species rg & ivel e, 199 in forThe carou- tsl effect has nomuni- ties; future monitoring of permanent plots, such as those estab- lished in this cutting trial, will allow for a more robust assess- ment of this effect. Compositional changes amongst the 13-cm diameter-limit harvest and the control were generally small. The control treat- ment was generally associated with greater overstory basal area and larger average diameter of overstory trees compared to the 13-cm diameter-limit harvest, which was associated with greater richness and diversity in the sapling layer. The uncut control was dominated mainly by a shade tolerant fern, Dryop- teris spinulosa, and Acer saccharum seedlings and saplings. The composition of the 13-cm diameter-limit treatment was mainly dominated by shade intolerant, exotic species such as Galeopsis tetrahit, Hieracium aurantiacum, Taraxacum offici- nale, and Veronica officinalis. In the 13-cm diameter-limit treatment, Rubus spp. did not change in frequency but did increase in percent cover. This increase in percent cover may have contributed to the absence of the exotic species Anthemis cotula, and Hieracium auran- tiacum during the 2009 sampling period, all of which are con- sidered intolerant. Rubus spp. has been shown to delay tree regeneration and herbaceous establishment in some northern hardwood forests (Shields and Webster, 2007). Holmes and Webster (2010) observed in hemlock/hardwood forests a dif- ference in the herbaceous community in deer access and deer exclusion plots; plots without fencing (deer access) were gener- ally dominated by weedy and exotic species. However, interac- tions between Rubus spp., deer herbivory, and tree regeneration are often complex and vary regionally (Horsley and Marquis, 1983). Teasing out the effects of management (past and present) and herbivory on long-term forest dynamics are extremely complex and often do not have simple answers (Hester et al., 1996; Gill, 1996). Following a winter harvest, the diameter-limit treatments had herbaceous communities that were more similar to the 13-cm diameter-limit harvest than the control. The directionality and magnitude of compositional change was consistent across all diameter-limit treatments. This trend, however, was not ob- served in the residual basal area treatments. These results did not support our original hypothesis that harvest intensity, in terms of the percent overstory basal area removed, would be the main factor influencing herbaceous composition. However, changes in light availability may be contributing to changes in Europe (Paillet et al., 2009). Paillet and colleagues (2009) iden- tified that species richness was generally higher in managed forests than unmanaged forests. This trend in greater species richness was also observed by Scheller and Mladenoff (2002) in northern hardwood stands located along the border of north- ern the hmunity (e.g. ). Th agem trend is consish tent withous comuniti a ar man ts in a Wisconsin and the Upper Peninsula of Michigan. They observed an increase in species richness in actively managed stands, both even-aged and uneven-aged, compared to old- growth stands. Some of the greatest differences in the light environment, herbaceous abundance, and herbaceous diversity they observed occurred between uneven-aged and old-growth stands. The control in our study is not considered old-growth. However, our control and the even-aged stands in the Scheller and Mladenoff (2002) study share many similarities and had a distinctly different herbaceous community than the uneven- aged stands. The largest environmental difference that Scheller and Mladenoff (2002) observed in even-aged and old growth stands was the amount of coarse woody debris. As vegetation dynamics continue to occur in our control, a more heterogene- ous environment may occur in the understory which may allow for the development of a herbaceous layer having more old- growth qualities. This shift in herbaceous species composition between dif- ferent harvest intensities, even-aged and uneven-aged manage- ment was not observed at the Argonne Experimental Forest in northern Wisconsin (Kern et al., 2006). The Argonne Experi- mental Forest includes two diameter-limit treatments, 20-cm and 30-cm, that were harvested 39 years before vegetation sampling; three single-tree selection treatments with residual basal areas of 20.6 m·ha , 17 m·ha , and 13.8 m·ha har- vested nine years before vegetation sampling; a shelterwood harvest; and a control. The differences between studies may be largely due to the difference in exotic species. Within the Ar- gonne, only three exotic species were observed and all were considered rare. At the Ford Forest Cutting Trial, on the other hand, twelve exotic species were observed and some were rather common (e.g., Galeopsis tetrahit). There are a number of potential reasons that these two studies have produced seem- ingly divergent responses. First, propagules may not have been as common in the surrounding landscape at the time of harvest or simply failed to invade the site due to barriers to movement or limited availability. This is a likely casual mechanism since the Ford Forest Cutting Trial is proximate to a state highway Copyright © 2012 SciRes. 104 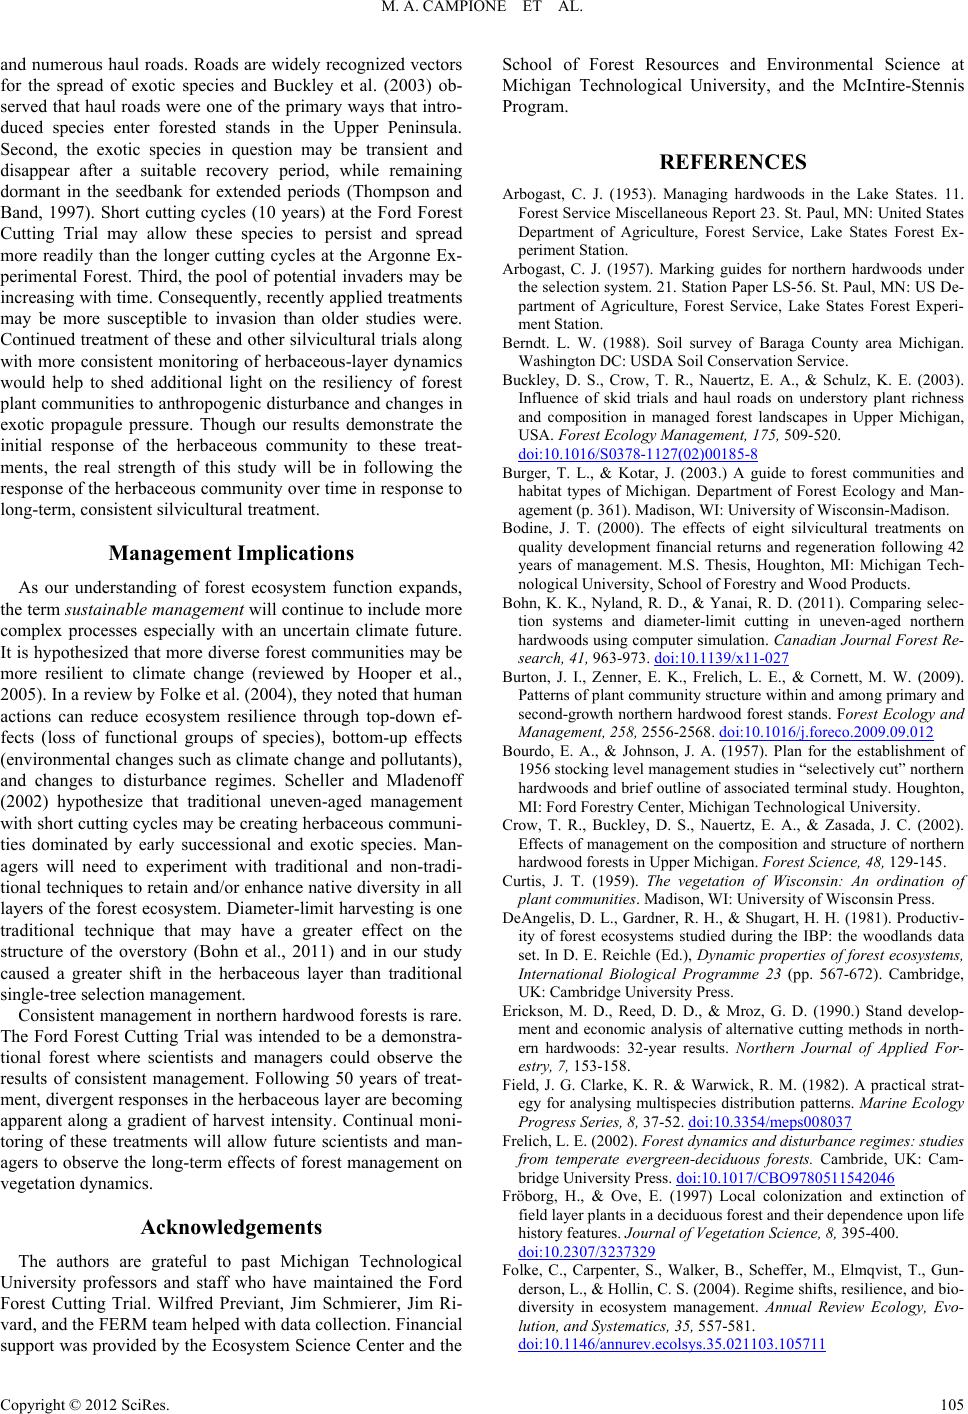 M. A. CAMPIONE ET AL. and numerous haul roads. Roads are widely recognized vectors for the spread of exotic species and Buckley et al. (2003) ob- served that haul roads were one of the primary ways that intro- duced species enter forested stands in the Upper Peninsula. Second, the exotic species in question may be transient and disappear after a suitable recovery period, while remaining dormant in the seedbank for extended periods (Thompson and Band, 1997). Short cutting cycles (10 years) at the Ford Forest Cutting Trial may allow these species to persist and spread more readily than the longer cutting cycles at the Argonne Ex- perimental Forest. Third, the pool of potential invaders may be increasing with time. Consequently, recently applied treatments may be more susceptible to invasion than older studies were. Continued treatment of these and other silvicultural trials along with more consistent monitoring of herbaceous-layer dynamics would help to shed additional light on the resiliency of forest plant communities to anthropogenic disturbance and changes in exotic propagule pressure. Though our results demonstrate the initial response of the herbaceous community to these treat- ments, the real strength of this study will be in following the response of the herbaceous community over time in response to long-term, consistent silvicultural treatment. Management Implications As our understanding of forest ecosystem function expands, the term sustainable management will continue to include more complex processes especially with an uncertain climate future. It is hypothesized that more diverse forest communities may be more resilient to climate change (reviewed by Hooper et al., 2005). In a review by Folke et al. (2004), they noted that human actions can reef- fects (loss of fu (e cts of forest management on ve support was provided by the Ecosystem Science Center and the sources and Environmental Science at Michigan Technological University, and the McIntire-Stennis Program. ion system. 21. Station Paper LS-56. St. Paul, MN: US De- partment of Agriculture, Forest Service, Lake States Forest Experi- ment Station. Berndt. L. W. (1988). ounty area Michigan. y Management, 175, 509-520. duce ecosystem resilience through top-down nctional groups of species), bottom-up effects nvironmental changes such as climate change and pollutants), and changes to disturbance regimes. Scheller and Mladenoff (2002) hypothesize that traditional uneven-aged management with short cutting cycles may be creating herbaceous communi- ties dominated by early successional and exotic species. Man- agers will need to experiment with traditional and non-tradi- tional techniques to retain and/or enhance native diversity in all layers of the forest ecosystem. Diameter-limit harvesting is one traditional technique that may have a greater effect on the structure of the overstory (Bohn et al., 2011) and in our study caused a greater shift in the herbaceous layer than traditional single-tree selection management. Consistent management in northern hardwood forests is rare. The Ford Forest Cutting Trial was intended to be a demonstra- tional forest where scientists and managers could observe the results of consistent management. Following 50 years of treat- ment, divergent responses in the herbaceous layer are becoming apparent along a gradient of harvest intensity. Continual moni- toring of these treatments will allow future scientists and man- agers to observe the long-term effe getation dynamics. Acknowledgements The authors are grateful to past Michigan Technological University professors and staff who have maintained the Ford Forest Cutting Trial. Wilfred Previant, Jim Schmierer, Jim Ri- vard, and the FERM team helped with data collection. Financial School of Forest Re REFERENCES Arbogast, C. J. (1953). Managing hardwoods in the Lake States. 11. Forest Service Miscellaneous Report 23. St. Paul, MN: United States Department of Agriculture, Forest Service, Lake States Forest Ex- periment Station. Arbogast, C. J. (1957). Marking guides for northern hardwoods under the select Soil survey of Baraga C Washington DC: USDA Soil Conserva ti on S ervice. Buckley, D. S., Crow, T. R., Nauertz, E. A., & Schulz, K. E. (2003). Influence of skid trials and haul roads on understory plant richness and composition in managed forest landscapes in Upper Michigan, USA. Forest Ecolog doi:10.1016/S0378-1127(02)00185-8 urger, T. L., & Kotar, J. (2003.) A guide to forest communities and habitat types of Michigan. Department of Forest Ecology and Man- agement (p. 361 B ). Madison, WI: Univer si ty of Wisconsin-Madison. n following 42 B-aged northern n Journal Forest Re- Bodine, J. T. (2000). The effects of eight silvicultural treatments on quality development financial returns and regeneratio years of management. M.S. Thesis, Houghton, MI: Michigan Tech- nological University, School of Forestry and Wood Prod ucts. ohn, K. K., Nyland, R. D., & Yanai, R. D. (2011). Comparing selec- tion systems and diameter-limit cutting in uneven hardwoods using computer simulation. Canadia search, 41, 963-973. doi:10.1139/x11-027 urton, J. I., Zenner, E. K., Frelich, L. E., & Cornett, M. W. (2009). Patterns of plant community structure within and among primary and B second-growth northern hardwood forest stands. Forest Ecology and Management, 258, 2556-2568. doi:10.1016/j.foreco.2009.09.012 ourdo, E. A., & Johnson, J. A. (1957). Plan for the establishment of 1956 stocking level management studies in “selectively cut” no B Cr nd structure of northern C D- Ft- rthern hardwoods and brief outline of associated terminal study. Houghton, MI: Ford Forestry Center, Michigan Technological University. ow, T. R., Buckley, D. S., Nauertz, E. A., & Zasada, J. C. (2002). Effects of management on the composition a hardwood forests in U ppe r Michigan. Forest Science, 48, 129-145. urtis, J. T. (1959). The vegetation of Wisconsin: An ordination of plant communities. Madison, WI : University of Wisconsin Press. eAngelis, D. L., Gardner, R. H., & Shugart, H. H. (1981). Productiv ity of forest ecosystems studied during the IBP: the woodlands data set. In D. E. Reichle (Ed.), Dynamic properties of forest ecosystems, International Biological Programme 23 (pp. 567-672). Cambridge, UK: Cambridge University Press. Erickson, M. D., Reed, D. D., & Mroz, G. D. (1990.) Stand develop- ment and economic analysis of alternative cutting methods in north- ern hardwoods: 32-year results. Northern Journal of Applied For- estry, 7, 153-158. ield, J. G. Clarke, K. R. & Warwick, R. M. (1982). A practical stra egy for analysing multispecies distribution patterns. Marine Ecology Progress Series, 8, 37-52. doi:10.3354/meps008037 elich, L. E. (2002). Forest dynamics and disturbance regimes: studies from temperate evergreen-deciduous forests. Cambride, UK: Cam- bridge University Press. Fr /CBO9780511542046doi:10.1017 Fröborg, H., & Ove, E. (1997) Local colonization and extinction of field layer plants in a deciduou s forest and their dependence upon life history features. Journal of Vegetation Science, 8, 395-400. doi:10.2307/3237329 Evo- Folke, C., Carpenter, S., Walker, B., Scheffer, M., Elmqvist, T., Gun- derson, L., & Hollin, C. S. (2004). Regime shifts, resilience, and bio- diversity in ecosystem management. Annual Review Ecology, lution, and Systematics, 35, 557-581. doi:10.1146/annurev.ecolsys.35.021103.105711 Copyright © 2012 SciRes. 105  M. A. CAMPIONE ET AL. Copyright © 2012 SciRes. 106 Guitment Press. G ecological significance of the herbaceous ill, R. (1996). The influence of large herbivores on tree recr and forest dynamics. In K. Daniel, Duncan, P., Bergstrom, R., & Pastor, J. (Eds.), Large herbivore ecology, ecosystem dynamics and conservation (pp. 170- 202). New York: Cambridge University illiam, F. S. (2007). The layer in temperate forest ecosystems. BioScience, 57, 845-858. doi:10.1641/B571007 illiam, F. S., & Roberts, M. R. (2003). The herbaceous layer in for- ests of Eastern North America. New Yor onewold, C. A., D’Amato, A. W., & Palik, B. J. Gk: Oxford University Press. Gr(2010.) The influ- ence of cutting cycle and stocking level on the structure and compo- sition of managed old-growth northern hardwoods. Forest Ecology Management, 259, 1151-1160. doi:10.1016/j.foreco.2010.01.001 ester, A. J., Bergman, M., Iason, G. R., & Moen, J. (1996.) Impacts of H ore mics and conservation (pp. 97-141). New H H large herbivores on plant community structure and dynamics. In K. Daniel, P. Duncan, R. Bergstrom, & J. Pastor (Eds.), Large herbiv ecology, ecosystem dyna York: Cambridge University Press. elms, J. A. (1998). The dictionary of forestry. Bethesda, MD: Society of American Foresters. olmes, S. A., & Webs ter, C. R. (2011). Herbivore-induced expansion of generalist species as driver of homogenization in post-disturbance plant communities. Plant Ecology, 212, 753-768. doi:10.1007/s11258-010-9858-y ooper, D. U., Chapin III, F. S., Ewel, J. J., Hector, A., Inchausti, P., Lavorel, S., Lawton, J. H., Lodge, D. M., Loreau, M., Naeem, S., Schmid, B., Setälä, H., Sy mstad, A. J ., Van der meer, J., & Ward le, D. A. (2005). Effects of biodiversity on H ecosystem functioning: A con- sensus of current knowledge. Ecological M onographs, 75, 3-35. doi:10.1890/04-0922 Horsley, S. B., & Marquis, D. A. (1983). Interference by weeds and deer with Allegheny hardwood reproduction. Canadian Journal of Forest Research, 13, 61-69. doi:10.1139/x83-009 nkins, M. A., & Parker, G. R. (1999)Je. Composition and diversity of ground-layer vegetation in silvicultural openings of Southern Indiana forests. American Midland Naturalist, 142, 1-16. doi:10.1674/0003-0031(1999)142[0001:CADOGV]2.0.CO;2 elty, M. J., Kittredge, D. B., Kyker-Snowman, T., & Leighton, A. D. (2003). The conversion of even-aged stands to uneven-aged structu in southern New Englan Kre d. Northern Journal of Applied Forestry, 20, Kage silvicultural 109-116. ern, C. C., Palik, B. J., & Strong, T. F. (2006). Ground-layer plant community responses to even-aged and uneven- treatments in Wisconsin northern hardwood forests. Forest Ecology and Management, 230, 162-170. doi:10.1016/j.foreco.2006.03.034 eak, W. B., & Sendak, P. E. (2002). Changes in sp structure over 48 years in a managed New England northern Lecies, grade, and hard- M Mefford, M. J. (2011). PC-ORD. Multivariate analysis M wood stand. Northern Journal of Applied Forestry, 19, 25-27. cCune, B., & Grace, J. B. (2002). Analysis of ecological communities. Gleneden Beach, Oregon: MjM Softwar e Design . cCune, B., & M of ecological data. Gleneden Beach, Oregon: MjM Software. etzger, F., & Schultz, J. (1981). Spring ground layer vegetation 50 years after harvesting in northern hardwood forests. American Mid- land Naturlist, 105, 44-50. doi:10.2307/2425008 National Climatic Data Center (NCDC) (2011) Record of climatologi- cal observations for Alberta Ford Forest Center. URL (last checked 20 June 2011). http://www.ncdc.noaa.gov/oa/climate/stationlocator.html euendorff, J. K., Nagel, L. M., Webster, C. R., & JNanowiak, M. K. , 197-202. Nns. New O Pdor, P., Avon, C., Bernhardt-Römer- forests: Meta-analysis of species richness 121845 (2007). Stand structure and composition in a northern hardwood for- est after 40 years of single-tree selection. Northern Journal of Ap- plied Forestry, 24 yland, R. D. (1996). Silviculture concepts and applicatio York: McGraw-Hill, Inc. liver, C. D., & Larson, B. C. (1996). Forest stand dynamics: Update edition. New York: John Wiley & Sons, Inc. aillet, Y., Bergès, L., Hjältén, Ó mann, M., Bijlsma, R. et al. (2009). Biodiversity differences between managed and unmanaged in Europe. Conservation Biology, 24, 101-112. doi:10.1111/j.1523-1739.2009.01399.xPMid:20 R). A 22-year study ardwoods. Se, northern lower Michigan. Canadian Journal of R Development Core Team (2009). R: A language environment for statistical computing. Vienna, Austria: R Foundation for Statistical Computing. eed, D. D., Holmes, M. J., & Johnson, J. A. (1986 of stand development and financial return in northern h Northern Journal of Applied Forestry, 3, 35-38. cheiner, S., & Istock, C. A. (1994). Species enrichment in a transi- tional landscap Botany, 72, 217-225. doi:10.1139/b94-030 cheller, R. M., & Mladenoff, D. J. (2002). Understory species patterns and diversity in old-growth and managed northern Shardwood forests. Ecological Application, 12 , 1329-1343. doi:10.1890/1051-0761(2002)012[1329:USPADI]2.0.CO;2 chwartz, J. W., Nagel, L. M., & Webster, C. RS. (2005).The effects of 16/j.foreco.2005.02.054 uneven-aged management on diameter distribution and species com- position of northern hardwoods in upper Michigan. Forest Ecology and Management, 211, 356-370. doi:10.10 Snse to hields, J. M., & Webster, C. R. (2007). Ground-layer respo group selection with legacy-tree retention in a managed northern hardwood forest. Canadian Journal of Forest Research, 37, 1797- 1807. doi:10.1139/X07-052 tearns, F. W. (1997). History of the Lakes States forests: natural and S T997). Survival of a lowland heathland human impacts. In J. M. Webster (Ed.), Lake States Regional Forest Resources Assessment: Technical Papers (pp. 8-29). USDA Forest Service General Technical Report NC-189. hompson, K., & Band, S. R. (1 seed bank after a 33-year burial. Seed Science Research, 7, 409-411. doi:10.1017/S0960258500003822 ubbs, C. H. (1977). Manager’s handbook for northern hardwoods in North Central States. 29. US Forest Service TGeneral Technical Re- W, K., Sundance, J., Howe, R., port NC-39, St. Paul, MN: US Department of Agriculture, Forest Service, North Central Forest Experiment Station. URL (last checked 27 March 2011). htp://plants.usda.gov van der Maarel, E., & Martin, S. T. (1993). Small-scale plant species turnover in a limestone grassland: The carousel model and some comments on the niche concept. Journal of Vegetation Science, 4548, 179-188. olf, A. T., Parker, L., Fewless, G., Corio & Gentry, H. (2008). Impacts of summer versus winter logging on understory vegetation in the Chequamegon-Nicolet Forest. Forest Ecology Management, 254, 35-45. doi:10.1016/j.foreco.2007.07.024 hitney, G. GW., & Foster, D. R. (1988). Overstory composition and age as determinants of the understory flora of woods of central New England. Journal of Ecology, 76, 867-876. doi:10.2307/2260578 hittaker, R. H. (1967) Gradient analysis of vegetation. Biological Re- views of the Cambridge Philosophical Society (London), 49, 207- W W 264. illiams, M. (1989). Americans and their forests: A historical geog- raphy. Cam bridge, UK: Cambridge University Press.  M. A. CAMPIONE ET AL. Appendix Table A1. Complete species list, both scientific and common names, and general chaistics of each species found at the Ford Forest Cutting Trial, Alberta, MI. USDA Plant Database was used for scientific nomenclature. ode Name ScieCommon Name racter Species Cntific Name actspp Actaea L. spp Baneberries adiped Adiantum pe datum L. Northern maidenhair Fer n alltri Allium tricoccum Aiton Wild leek Anthemis cotula L. lis L. illa .) Schott Schreb. ex Spreng.) P. Beauv. orthusk aMuhl. ex Willd. bittercress ichx. canadensis (L.) H. Hara ade a L. m ld fern pp. hempnettle green thoides (L.) Sweet eye daisy m L. hylla (L.) Pers. f * . L. x Marsh. honeysuck le ense Desf. flower Link n’s seal eris(L.) Torado etroot Michx.) C.B. Clarke spp. seal L. iata E.P. Bi cknell snakeroot le F.H. Wigg. Bicknell orse-gentian s L. edwell ullein antcot* Mayweed aranud Aralia nudic auWild sarsapar aritri Arisaema triphyl lum (L Jack-in-the-pulpit braerec Brachyelytrum erectum (Bearded sh carpen Cardamine pensylvanicPennsylvania carspp Carex L. spp. Sedge cautha Caulophyllum thalictroides (L.) MBlue cohos h cirlut Circaea qu a drisulcata (Maxim.) Franch. & Savigny var.Enchanter’s nightsh dicspp Dicentra Bernh. spp. Bleeding Heart diovil Dioscorea villosWild ya drycar Dryopteris spi nu los a (O.F. Müll.) Watt Spinulose shie elyhys Elym us hystrix L. Rye grass eurspp Eurybia (Cass. ) Cass sAster fraspp Fragaria L. spp. Strawberry galspp Galium L. spp. Bedstraw galtet* Galeopsis tetrahit L. Bristlestem gaupro Gaultheria pr oc um be ns L. Winter geuspp*Geum L. spp. Avens helhel Heliopsis helianSmooth ox hieaur* Hieracium auranti acuOrange hawkweed ipospp* Ipomoea L. spp. Morning glory jefdip Jeffersonia dipTwinlea lapcom Lapsana communis nipplewort leuvul* Leucanthemum vulgare Lam Oxeye daisy linbor Linnaea b ore alis Twinflower loncan Lonicera c anadensis Bartram eAmerican fly maican Maianthemum canadCanada may mairac Maianthemum racemosum (L.) False Solomo matstr Matteuccia strut hioptOstrich fern menarv Mentha arvensis L. American wild mint myospp*Myosotis L. spp. Forget-me-nots oryasp Oryzopsis asperifolia Michx. Rough leaf rice grass osmchi Osmorhiza chilensis Hook. & Arn. Mountain swe osmcla Osmorhiza claytoni (Sweet cicely polspp Polygonatum Mill True Solomon’s rhacat* Rhamnus cathartica L. Common buckthorn ribspp Ribes L. spp. Gooseberry rubspp Rubus L. spp. Raspberry samspp Sambucus L. spp. Elderberry sancan Sanguinaria canadensis Bloodroot santri Sanicula trifolLong-f ruited staspp Stachys L. spp. Lamb’s ears taroff* Taraxacum officinaDandelion triaur Triosteum aurantiacum E.P. Orangefruit h trispp Trillium L. spp. Trillium veroff* Veronica officinaliCommon spe vertha* Verbascum thapsus L. Common m viospp Viola L. spp. Violet *Eecies. xotic sp Copyright © 2012 SciRes. 107  M. A. CAMPIONE ET AL. Table A2. Fr of occurrence oe- and post-harvest by treatment at the Ford Forest Cutting Trial, Aeous species ararized at the subp0). DLH refers to diameter limit harvest. Control 21 m2·ha–1 2–1 56 cm DLH 16 m2·ha–1 2–1 41 cm DLH 11 m2·ha–1 2–1 30 cm DLH 13 cm DLH equencyf herbaceous species prlberta, MI. Herbac e summlot level (n = 1 (90 ft·ac) (22 in) (70 ft·ac) (16 in) (50 ft·ac) (12 in) (5 in) Species Co Name 2008 2009 2008 2009 2008 200920082009 de 2008200920082009 2008 2009 20082009 actspp - - - - - - - - - - 10 - 10 - - - adiped - - - - - - - - 20 20 - - - - - - alltri - - -0 - 10 - - antcot* b 11 1 1 1 1 1 1 1 1 - - 1- - 1020 60 20 - - - - - - - - - - - - - - 30 - aranud - - - - 10 10 - 10 - - - - - - - - aritri - - - - - 10 20 20 30 10 30 10 30 - - - raerec- - - - - 10 - - - - - 10 - - - - carpen - - - - - - - - - 20 - - - - - - carspp 40 - 70 40 80 50 80 60 00 70 90 80 00 00 00 00 cautha - - - - - - 10 10 20 20 50 40 - - - - cirlut - - - - - - - - - - 10 - - - - - dicspp - - - - - - - - - 10 - 10 - 10 - - diovil - - - - - - - - - - - 10 - - - - drycar 80 90 00 90 80 80 90 90 80 80 80 70 60 40 10 10 elyhys - - - 20 - - - 10 - 40 - 50 - 40 - 90 eurspp - - - - - - - - - - 10 - - - - - fraspp - - - - - - - - - - - - - - - 20 galspp - - - - - - - - 10 - - - - 20 50 20 galtet* - - 40 60 60 50 80 60 90 100 00100 90 80 00 30 gaupro - - - - - - - - - - - - - - 20 - geuspp* - - - - - - - - - 20 - 20 - - - - helhel - - - - - - - - - - - - - - 10 - hieaur* - - - 10 - - - - - - 10 - - - 50 - ipospp* - - - - - - 20 - - - - - 20 - 80 - jefdip - - - - - - 10 - 60 - - - - - - - lapcom* - - 10 20 20 20 10 20 10 70 90 90 40 40 80 - leuvul* - - - - - - - - - - - - - - - 20 linbor - - 20 - 10 - - - - - - - - - - - loncan - 10 - - - 10 - - - - - - - - - - maican 10 - - - - 10 - - - - - - 10 10 10 40 mairac - 10 - 10 - 10 - - - 30 - - - 10 - - matstr - - - - - - - - - 10 - - - - - - menarv - - 10 - - - - - - - - - - - - - myospp* - - - - - - - - - - - 10 - - - - oryasp - 30 - 50 - 70 - 60 - 20 - 50 - 70 - - osmchi - - - - - - - - - 10 - 10 - 20 - - osmcla - - - - - - - - 30 - - - - - 20 - polspp - - 10 30 30 10 30 10 50 30 20 30 50 40 - 00 rhacat* - - - - 10 - - - - - - - - - - - ribspp 30 20 10 10 - 20 - 10 10 10 - 20 50 30 10 - rubspp - - 90 90 90 90 60 50 60 70 70 80 10 60 100 00 samspp - - - 10 - 30 - 10 - - 10 10 - - - 10 sancan - - - 20 50 50 50 60 80 70 50 80 60 60 20 30 santri - - - - - - - - 10 10 20 - - - - - staspp - - - - - - - - - - - - - - 10 - taroff* - - - 10 10 10 - - 20 - 40 30 20 20 70 60 triaur - - - - - - - - 10 10 - - - - - - trispp 10 10 30 10 20 30 60 40 60 20 80 50 20 40 10 20 veroff* - - - - - 10 - - - - - - - - - 10 vertha* - - - - - - - - - - - - - 20 - - viospp 10 30 - - 20 20 40 30 40 60 40 40 50 30 70 - *Exotic ss. pecie Copyright © 2012 SciRes. 108 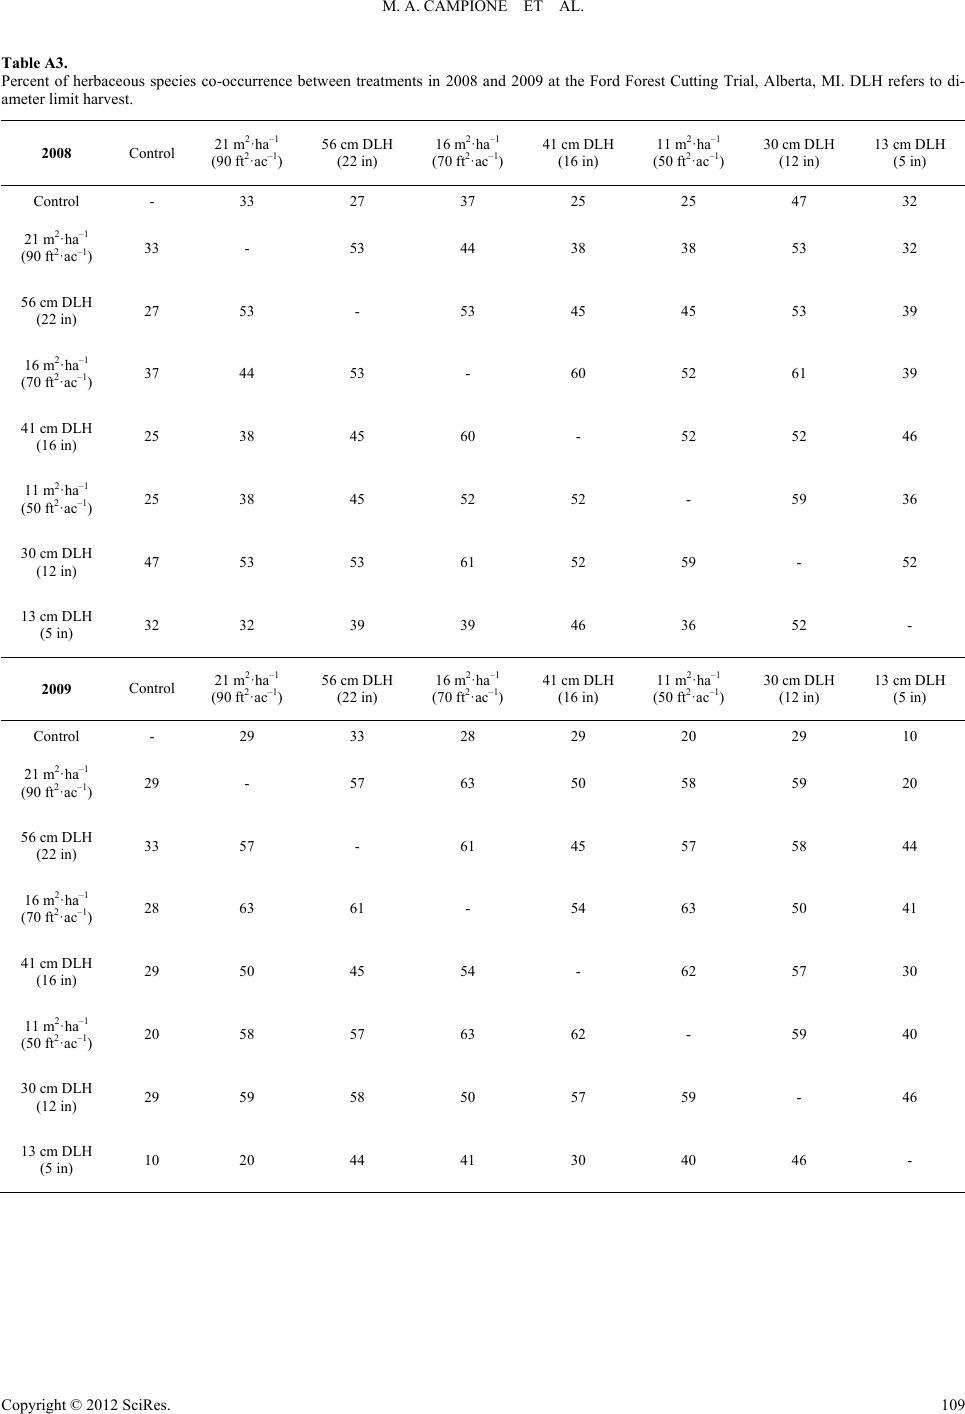 M. A. CAMPIONE ET AL. Copyright © 2012 SciRes. 109 Tab Percent of herbaceous species co-ocrrenceetween treatmts in 28 and09 ae Fororestuttingial, Alberta, DLHers i- ame harves Control 21 m2·ha–1 (90 ft2·ac–1) 56 cm DLH (22 in) 16 m2·ha–1 (70 ft2·ac–1) 41 cm DLH (16 in) 11 m2·ha–1 (50 ft2·ac–1) 30 cm DLH (12 in) 13 cm DLH (5 in) le A3. cu ben00 20t thd F C TrMI. refto d ter limit t. 2008 Control - 33 27 37 25 25 47 32 21 2–1 (90 ) 5 (22 in) 27 (70 ft2·ac–1) 37 44 53 - 60 52 61 39 41 cH (16 in) 25 38 45 60 - 52 52 46 (50 ft2·ac–1) 25 38 45 52 52 - 59 36 30 cH (12 in) 47 53 53 61 52 59 - 52 (5 in) 32 32 39 39 46 36 52 - 2009 Control 21 m·ha–1 (90 ft2·ac–1) 56 cm DLH (22 in) 16 m·ha–1 (70 ft2·ac–1) 41 cm DLH (16 in) 11 m·ha–1 (50 ft2·ac–1) 30 cm DLH (12 in) 13 cm DLH (5 in) m·ha ft2·ac–1 33 - 53 4 438 3 853 32 6 cm DLH53 - 53 45 45 53 39 16 m2·ha–1 m DL 11 m2·ha–1 m DL 13 cm DLH 2 2 2 C10 ontrol - 29 33 28 29 20 29 21 m2–1 (90 ) 5 (22 in) 33 (70 ft2·ac–1) 28 63 61 - 54 63 50 41 41 cH (16 in) 29 50 45 54 - 62 57 30 (50 ft2·ac–1) 20 58 57 63 62 - 59 40 30 (12 in) 29 59 58 50 57 59 - 46 H (5 in) 10 20 44 41 30 40 46 - ·ha ft2·ac–1 29 - 57 63 50 58 59 20 6 cm DLH57 - 61 45 57 58 44 16 m2·ha–1 m DL 11 m2·ha–1 cm DLH 13 cm DL
|