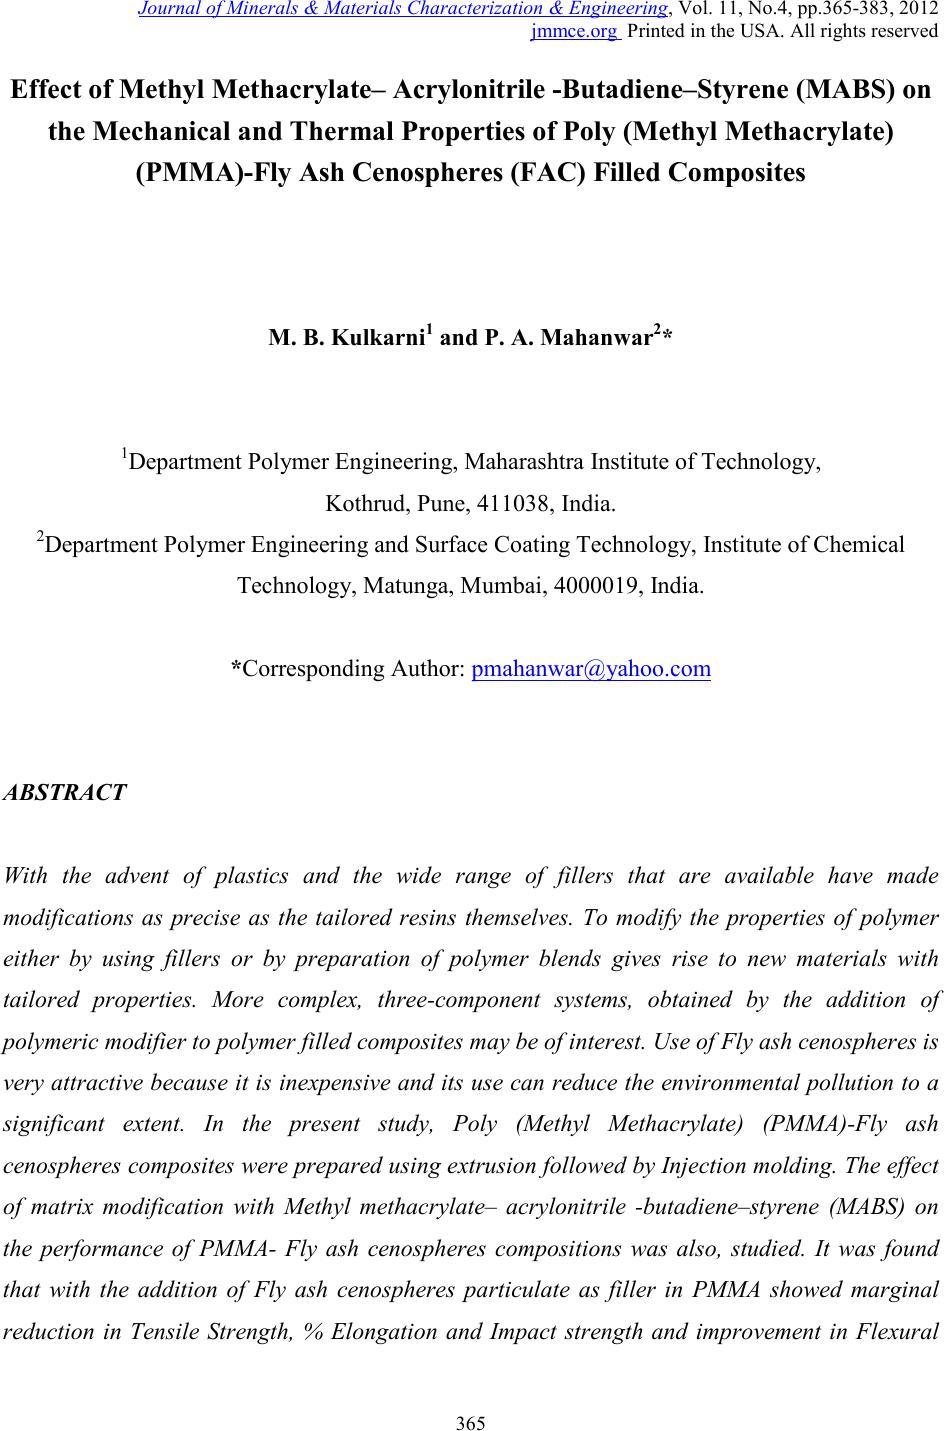
 Journal of Minerals & Materials Characterization & Engineering, Vol. 11, No.4, pp.365-383, 201 2 jmmce.org Printed in the USA. All rights reserved 365 Effect of Methyl Methacrylate– Acrylonitrile -Butadiene–Styrene (MABS) on the Mechanical and The rmal Prop er ties of Poly (Methyl Methacrylate) (PMMA)-Fly Ash Cenospheres (FAC) Filled Composites M. B. Kulkarni1 and P. A. Mahanwar2* 1Department Polymer Engineering, Maharashtra Institute of Technology, Kothrud, Pune, 411038, India. 2Department Polymer Engineering and Surface Coating Technology, Institute of Chemical Technology, Matunga, Mumbai, 4000019, India. *Corresponding Author: pmahanwar@yahoo.com ABSTRACT With the advent of plastics and the wide range of fillers that are available have made modifications as precise as the tailored resins themselves. To modify the properties of polymer either by using fillers or by preparation of polymer blends gives rise to new materials with tailored properties. More complex, three-component systems, obtained by the addition of polymeric modifier to polymer filled composites may be of interest. Use of Fly ash cenospheres is very attractive because it is inexpensive and its use can reduce the environmental pollution to a significant extent. In the present study, Poly (Methyl Methacrylate) (PMMA)-Fly ash cenospheres composites were prepared using extrusion followed by Injection molding. The effect of matrix modification with Methyl methacrylate– acrylonitrile -butadiene–styrene (MABS) on the performance of PMMA- Fly ash cenospheres compositions was also, studied. It was found that with the addition of Fly ash cenospheres particulate as filler in PMMA showed marginal reduction in Tensile Strength, % Elongation and Impact strength and improvement in Flexural  366 M. B. Kulkarni and P. A. Mahanwar Vol.11, No.4 Strength, Heat Deflection Temperature and Vicat Softening Point. Compared with PMMA- cenospheres composites, the notched Impact Strength of the PMMA/MABS/cenospheres composites showed marginal enhancement in values at higher loading of cenospheres. The optimum performances in mechanical and thermal properties were obtained when the ratio of MABS to cenospheres was 1:2. Key words: Poly (Methyl Methacrylate) (PMMA), Fly ash cenospheres (FAC), Methyl methacrylate– acrylonitrile -butadiene–styrene (MABS), Mechanical and Thermal Properties. 1. INTRODUCTIO N Property enhancement is usually achieved by fiber reinforcement but some studies show that mechanical properties can improve with the addition of particulate fillers Particulate fillers have played a vital role in the development of commercially viable polymers. Not only do they provide a significant cost reduction but certain fillers may improves various properties of the materials such as mechanical strength, modulus and heat deflection temperature, material processing and its optical properties. In general the mechanical properties of particulate filled polymer composites depend strongly size, shape and distribution of filler particles in the matrix polymer and good adhesion the filler—polymer interface. Numerous inorganic fillers like fly ash, mica, talc, calcium carbonate, hollow glass bead etc. have been incorporated in polymer matrix [1-9]. Fly ash is a fine ash byproduct commonly produced by the combustion of coal during the generation of electrical power. Coal is composed of combustible organic matter with a variable amount of inorganic mineral matter. During combustion, the minerals in coal become fluid at high temperature and are then cooled. In a pulverized coal fired boiler, the furnace operating temperatures are typically in excess of 1,400 °C (≌ 2,500 °F). At these temperatures, mineral matters within the coal may oxidize, decompose, fuse, disintegrate or agglomerate. Rapid cooling in the post combustion zone results in the formation of spherical, amorphous particles.  Vol.11, No .4 Effect of Methyl methacrylate– acrylonitrile -butadiene –s tyre ne 367 Expansion of trapped volatile matter can also cause the particles to expand to form a hollow cenospheres; however minerals with high melting points may remain relatively unchanged. The heating and cooling cycle have a significant effect on the composition and morphology of each particl e. Fly ash cenospheres are a waste by-product of coal combustion and, as such, are available at very low cost. These are hollow thin-walled spheres of sizes several tens of micron to 500 μm. According to their chemical compositions, these materials belong to the multicomponent systems with a SiO 2 + Al2O3 + Fe2O3 content of approximately 90 wt%. These are formed during the coal burning process by evolution of gas becoming trapped in a viscous molten glass matrix, can be reclaimed from fly ash readily and are relatively inexpensive as a bulk product. They are considered a waste product, so any use of them decreases the strain on the environment [10-13]. Recently fly ash has been used as filler in polymer to produce particulate reinforced polymer composites, saving the other commonly used mineral fillers used in polymers, thereby helping the environment. Many experimental studies using fly ash have shown that the presence of f iller does increase the stiffness of the polymer composite, but like most fillers, reduces impact resistance. To improve these properties, other components should be added to the composite formulation [4,14-16]. Ares et al. [17] studied the effect of aminomethoxy silane and olefin block copolymer on rheomechanical and morphological behavior of fly ash-filled polypropylene composites and concluded that the best rheological and mechanical properties were obtained when the ratio of olefin block copolymer to fly ash particles was 1:2. Pol y (Methyl Meth acrylate) (PM MA ) o ccu pi es an i nt erm edi ate p os it io n b et ween com mo di t y and engineering polymers. It has excellent transparency and good tensile strength, and its resistance to weathering and light, makes it an obvious replacement for glass in many applications. PMMA has excellent resistance to inorganic acids and bases, aliphatic hydrocarbons, detergent solutions, cleaners, foodstuffs, and beverages. A unique combination of the electrical properties together with an excellent weather resistance has led to the extensive use of PMMA in outdoor electrical applications. Weather and moisture have little effect on the electrical properties. The surface resistivity is higher than that for most plastics. Hence numerous efforts have been undertaken to use PMMA as matrix resins for composite by adding inorganic fillers such as Talc, Synthetic  368 M. B. Kulkarni and P. A. Mahanwar Vol.11, No.4 Sodium Aluminum Silicate [7], wollastonite [18] and glass fibers [19] which showed some improvement in the tensile and impact properties in PMMA. Mica [20] and glass beads [21] filled PMMA composites showed improvements in primary dispersion temperature, dynamic modulus, compressive strength, and bending modulus. Addition of fumed silica [22] to PMMA led to a decrease of flexural strength and an increase of Young’s modulus. Maspoch et al. [23] reported that surface treatment plays an important role in improving filler matrix interfacial adhesion in PMMA composites. The objective of this work was to study the effects on the mechanical, thermal properties due to addition of Fly ash ceospheres in the Poly (Methyl Methacrylate) (PMMA). Also, the effect of matrix modification with Methyl methacrylate– acrylonitrile -butadiene–styrene (MABS) on the performance of PMMA- Fly ash cenospheres compositions was studied. The ultimate goal was to develop a solution that would ensure the continued successful application of fly ash cenospheres as filler in plastics i.e. environmentally friendly composites filled with Fly ash cenosph eres. 2. EXPERIMENTAL 2.1 Materials used Poly (methyl methacrylate) (PMMA, SUM IPEX 8G11AA, LG Acr ylic Grade wit h MFI 10 gm / 10 min and density 1.19 gm / cm3) was used as the polymer matrix. Fly ash cenospheres (FAC) were supplied by Envirotech Engineers, Pune, India; its specific gravity was 0.65 gm /cm3, and average p arti cle si ze of 1 50 µm used as filler. The concentration of cenospheres was varied f rom 0 to 30 weight percent (wt %). Methyl methacrylate- acrylonitrile-butadiene-styrene (MABS, Terlux®2802 TR, BASF Plastics) was used as the modifier. 2.2 Preparation of the Polymer Composites Poly (methyl methacrylate), Fly ash cenospheres and Methyl methacrylate- acrylonitrile- butadiene-styrene (MABS) were predried at 80+5 oC for 2 to 3 hours in an air circulating oven.  Vol.11, No .4 Effect of Methyl methacrylate– acrylonitrile -butadiene –s tyre ne 369 In binary systems, the compounding of Poly (methyl methacrylate) with various concentrations of 0, 10, 15, 20, 25, 30 weight percent (wt %) of the cenospheres (100 mesh) were carried out on extruder. In this process, the temperature profiles in the barrel were: Zone 1- 170 0C, Zone 2- 210 0C, Zone 3-230 0C, and die temperature- 240 0C and the screw rotation rate of 60 rpm was used and then extruded strands were then pelletized. The pellets were dried at 85+50C for 2 - 3 hours in an air-circulating oven. The resulting pellets were injection molded to produce the Tensile, Flexural and Izod Impact test specimens of PMMA-cenospheres filled composites. All the samples were conditioned for 24 hours prior to testing. The resulting samples were used for the study of mechanical and thermal properties. In ternary systems, PMMA with various concentrations of 0, 10, 15, 20, 25, 30 weight percent (wt %) of the cenospheres (100 mesh) and fixed percentage of MABS (5 wt %) were compounded using extruder. In this process, the temperature profiles in the barrel were: Zone 1- 170 0C, Zone 2-210 0C, Zone 3-230 0C, and die temperat u re- 240 o C and the screw rotation rate of 60 rpm was used and then extruded strands were then pelletized. The resulting pellets were injection molded to produce the Tensile, Flexural and Izod Impact test specimens of PMMA/MABS/cenospheres filled composites. All the samples were conditioned for 24 hours prior to testing. The resulting samples were used for the study of mechanical and thermal properties. 2.3 Testing Tensile properties were measured using dumb-bell shaped specimens on a Tensile Testing Machine, Model No STS-248, India, (Praj Laboratory, Kothrud, Pune) according to ASTM D638M-91, procedure at 100% strain rate. The crosshead speed of 50mm/min was maintained for testing. Flexural properties of all composites were measured at ambient conditions using Flexural specimens on a Universal Tensile Testing Machine, Model No STS-248, India, (Praj Laboratory, Kothrud, Pune) according to ASTM D790 test procedure. Izod impact strength values w ere eval uated on a Zwick Izo d Impact test er (Digital ), Model No : S1 02, German y, (Praj Laboratory, Kothrud, Pune) according to ASTM D256 test procedure using notch samples. Thermal properties such as Heat Deflection Temperature (HDT) and Vicat Softening Point (VST) of all samples were measured b y using Davenport Vicat Softening Point Instrument, U.K. 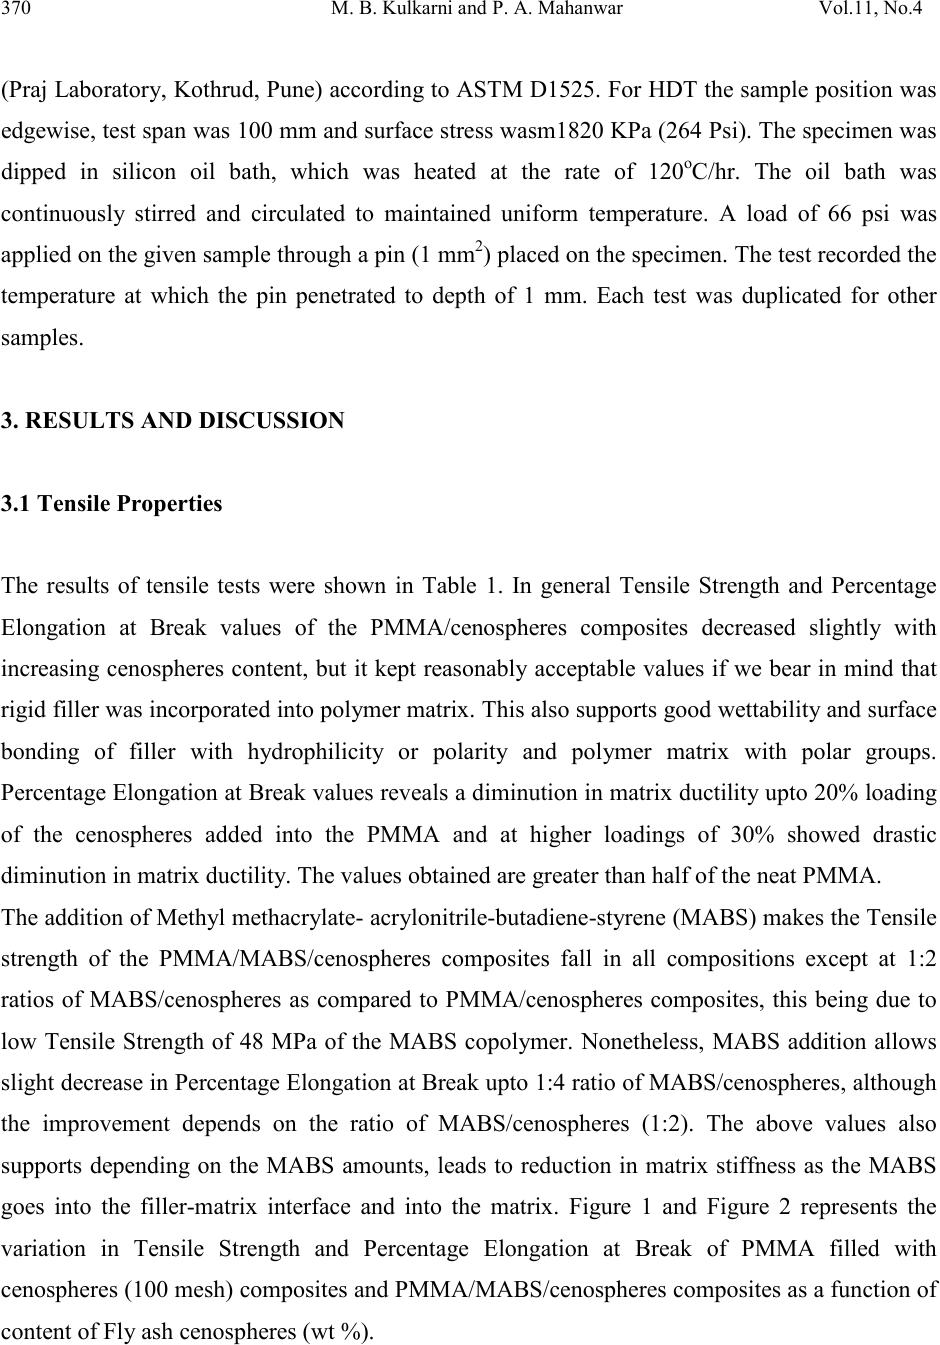 370 M. B. Kulkarni and P. A. Mahanwar Vol.11, No.4 (Praj Laboratory, Kothrud, Pune) accordin g to ASTM D1525. For HDT the sample posit ion was edgewis e, test span was 100 mm and surface stress wasm1820 KPa (264 Psi). The specimen was dipped in silicon oil bath, which was heated at the rate of 120oC/hr. The oil bath was continuously stirred and circulated to maintained uniform temperature. A load of 66 psi was applied on the given sample through a pin (1 mm2) placed on t he s peci men . Th e tes t r ecorded th e temperature at which the pin penetrated to depth of 1 mm. Each test was duplicated for other sampl es . 3. RESULTS AND DISCUSSION 3.1 Tensile Properties The results of tensile tests were shown in Table 1. In general Tensile Strength and Percentage Elongation at Break values of the PMMA/cenospheres composites decreased slightly with increasing cenospheres content, but it kept reasonably acceptable values if we bear in mind that rigid filler was incorporated into pol ymer matrix. This also supports good wettability and surface bonding of filler with hydrophilicity or polarity and polymer matrix with polar groups. Percenta ge El ongati on at Br eak values rev eals a d imin utio n in m atrix ductilit y upto 20% loading of the cenospheres added into the PMMA and at higher loadings of 30% showed drastic diminution in matrix ductility. The values obtained are greater than half of the neat PMMA. The addition of Methyl methacrylate- acrylonitrile-butadiene-styren e (MA BS) mak es the T ensil e strength of the PMMA/MABS/cenospheres composites fall in all compositions except at 1:2 ratios of MABS/cenospheres as compared to PMMA/cenospheres composites, this being due to low Tensile Strength of 48 MPa of the MABS copolymer. Nonetheless, MABS addition allows slight decrease in Percentage Elongation at Break upto 1:4 ratio of MABS/cenospheres, although the improvement depends on the ratio of MABS/cenospheres (1:2). The above values also supports depending on the MABS amounts, leads to reduction in matrix stiffness as the MABS goes into the filler-matrix interface and into the matrix. Figure 1 and Figure 2 represents the variation in Tensile Strength and Percentage Elongation at Break of PMMA filled with cenospheres (100 mesh) composites and PMMA/MABS/cenospheres composites as a function of content of Fly ash cenospheres (wt %). 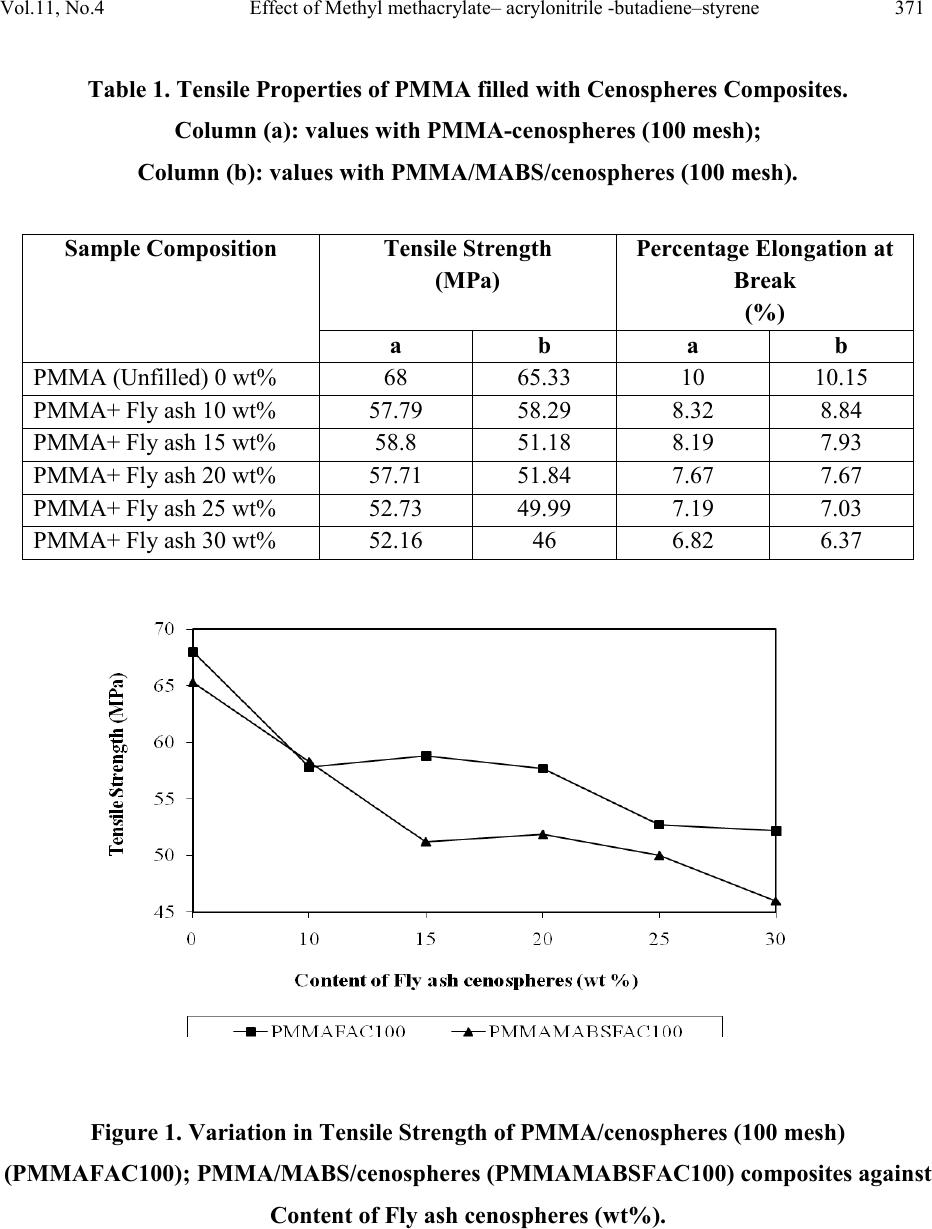 Vol.11, No .4 Effect of Methyl methacrylate– acrylonitrile -butadiene –s tyre ne 371 Table 1. Tensile Properties of PMMA filled with Cenospheres Composites. Column (a): values with PMMA-cenospheres (100 mesh); Column (b): values with PMMA/MABS/cenospheres (100 mesh). (MPa) Break (%) Figure 1. Variation in Tensile Strength of PMMA/cenospheres (100 mesh) (PMMAFA C10 0) ; PMMA /MAB S / ceno sp h ere s (PMMAMABSFAC100) composites against Content of Fly ash cenospheres (wt%).  372 M. B. Kulkarni and P. A. Mahanwar Vol.11, No.4 Figure 2. Variation in Percentage Elongation at Break of PMMA/cenospheres (100 mesh) (PMMAFAC100); PMMA/MABS/cenospheres (PMMAMABSFAC100) composites against Content of Fly ash cenospheres (wt%). Table 2, depicts the variation in Relative Yield Stress (σ c / σ p) & Relative Strain at Break (εc/εp) of PMMA filled with cenospheres (100 mesh) composites and PMMA/MABS/cenospheres composites. The dependence of the Relative Yield Stress (σc/σp) (Ratio of the yield stress of the composite, subscript c, and of the non filled polymer, subscript p) on the volume fraction of the filler ΦF was shown in Figure 3. The yield stress data were compared using the following equation [24]: (1) where the parameter K indicates extent of adhesion between the filler and the polymer. For spherical shaped fillers K equals 0 for perfect adhesion and 1.21 for no adhesion. The data for  Vol.11, No .4 Effect of Methyl methacrylate– acrylonitrile -butadiene –s tyre ne 373 unmodified PMMA/cenospheres (100 mesh) composites lies in between the curves with K==0- 0.6. While the data for PMMA/MABS/cenospheres composites lies closer to the curve with K==0.6. This also supports a better wettability and surface bonding of filler with hydrophilicity or polarity and polymer matrix with polar groups. This was also supported by the trend of variation of Relative Strain at Break (ε c / ε p) of PMMA filled with cenospheres (100 mesh) composites and PMMA/MABS/cenospheres composites as shown in Table 2. Table 2. Values of Relative Yield Stress and Relative Strain at Break of PMMA filled with Cenospheres Composites. Column (a): values with PMMA-cenospheres (100 mesh); Column (b): values with PMMA/MABS/cenospheres (100 mesh). (σ c / σ p) (ε c / ε p) 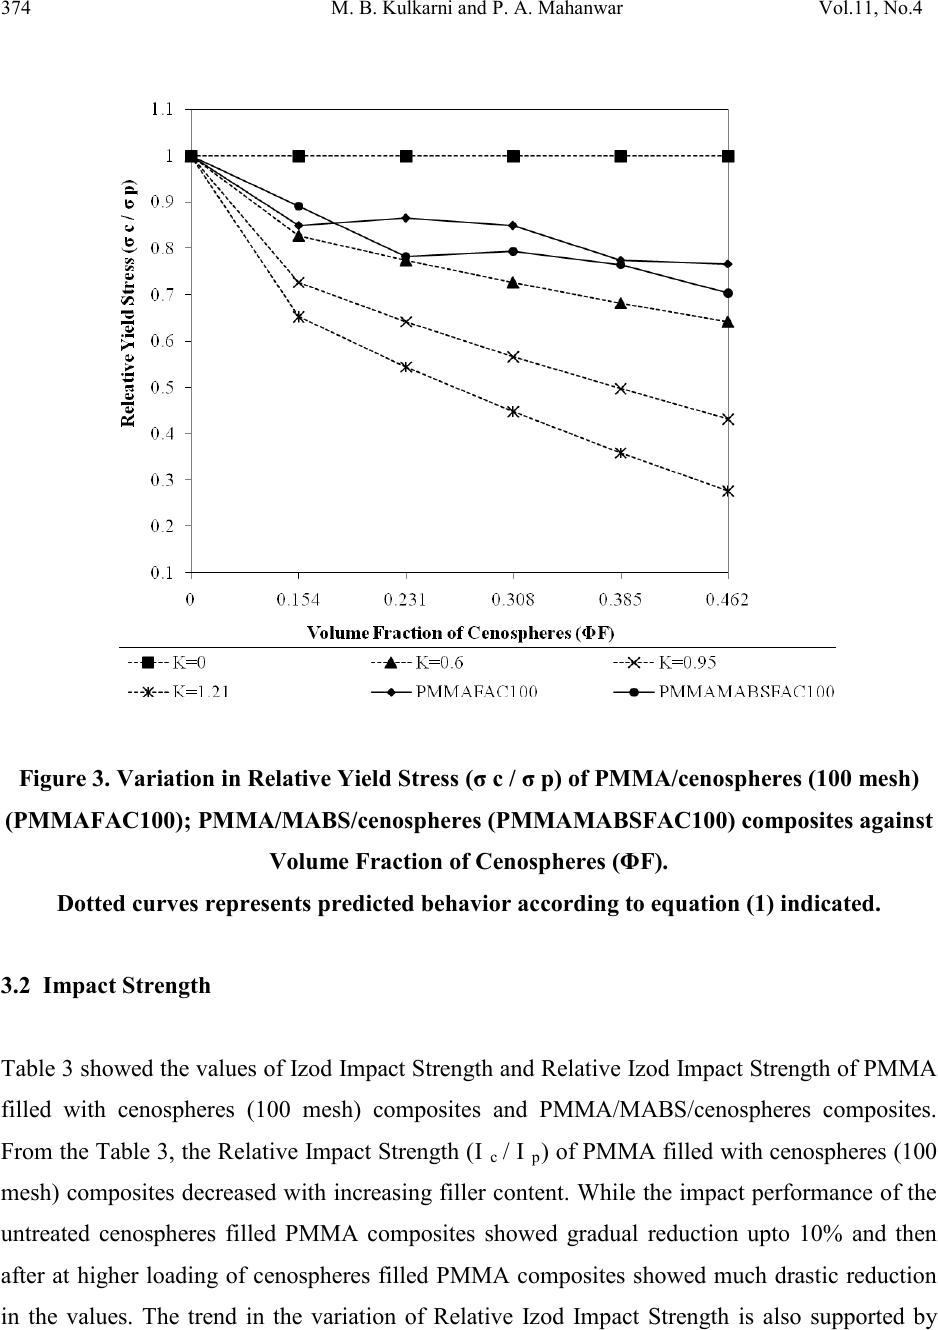 374 M. B. Kulkarni and P. A. Mahanwar Vol.11, No.4 Figure 3. Variation in Relative Yield Stress (σ c / σ p) of PMMA/cenospheres (100 mesh) (PMMAFAC100); PMMA/MABS/cenospheres (PMMAMABSFAC100) composites against Volume Fraction of Cenospheres (ΦF). Dotted curves represents predicted behavior according to equation (1) indicated. 3.2 Impact Strength Table 3 showed the values of Izod Impact Strength and Relative Izod Impact Strength of PMMA filled with cenospheres (100 mesh) composites and PMMA/MABS/cenospheres composites. From the Table 3, the Relative Impact Strength (I c / I p) of PMMA filled with cenospheres (100 mesh) composites decreased with increasing filler content. While the impact perform ance of the untreated cenospheres filled PMMA composites showed gradual reduction upto 10% and then after at higher loading of cenospheres filled PMMA composites showed much drastic reduction in the values. The trend in the variation of Relative Izod Impact Strength is also supported by  Vol.11, No .4 Effect of Methyl methacrylate– acrylonitrile -butadiene –s tyre ne 375 reduction in the elongation of the filled composite. While the impact performance of the PMMA/MABS/cenospheres filled composites showed comparable values to untreated filled compositions upto 15% and at higher loadings of MABS, the impact performance of the PMMA/MABS/cenospheres filled composites showed much enhancement in the impact performance as compared with unmodified PMMA/cenospheres (100 mesh) composites. The above results also support that with addition of MABS; the copolymer and PMMA matrix may behave li ke a single phas e which may helps to improve the dispersion of cenospheres in PMMA based composites. For higher MABS amounts, the copolymer goes into the filler-matrix interface and into the matrix, contributing to a reduction in matrix stiffness and not to an increase in composite toughness. The rate of reduction in Impact properties also supports the role of addition of MABS and the role of hollow nature of cenospheres. The trend in variation in Izod Impact Strength of PMMA filled with cenospheres (100 mesh) composites and PMMA/MABS/cenospheres composites against content of Fly ash cenospheres (wt %) was presented in Figure 4. Table 3. Values of Izod Impact Strength and Relative Izod Impact Strength of PMMA filled with Cenospheres Composites. Column (a): values with PMMA-cenospheres (100 mesh); Column (b): values with PMMA/MABS/cenospheres (100 mesh). (J/m) Relative Izod Impact Strength (I c / I p)  376 M. B. Kulkarni and P. A. Mahanwar Vol.11, No.4 Figure 4. Variation in Izod Impact Strength of PMMA/cenospheres (100 mesh) (PMMAFAC100); PMMA/MABS/cenospheres (PMMAMABSFAC100) composites against Content of Cenospheres (wt%). 3.3 Flexural Strength Properties Table 4 showed the values of Flexural Strength of PMMA filled with cenospheres (100 mesh) composites and PMMA/MABS/cenospheres composites. From the Table 4, it was observed that the values of Flexural Strength increased with inc rease in filler content upto 15-25% additi on of cenospheres and then reduced marginally but remains higher than that of PMMA. This also supports the improvement in chain stiffness due to good bonding of filler with hydrophilicity or polarity and polymer matrix with polar groups and also supports the hollow spherical nature of the fly ash cenospheres. With the addition of MABS, the values of Flexural Strength slightly improved upto 15% and then reduced and the values remain slightly lower than filled with cenospheres (100 mesh) composites. Nonetheless, MABS addition allows enhancing this parameter, although the improvement depends on the ratio of MABS/cenospheres (1:2 to 1:3). Figure 5 showed the variation in Flexural Strength of PMMA filled with cenospheres (100 mesh) 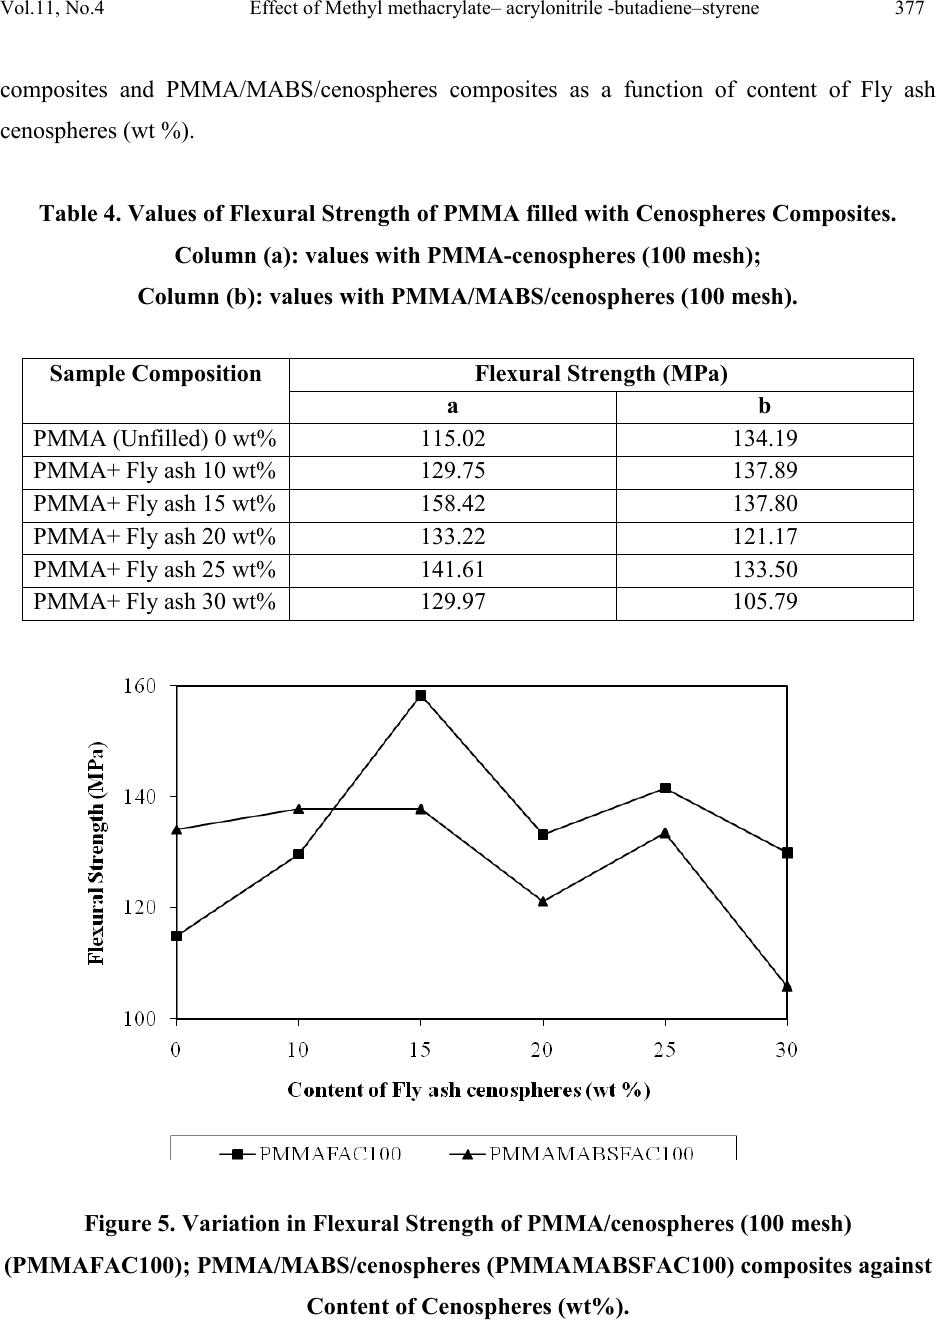 Vol.11, No .4 Effect of Methyl methacrylate– acrylonitrile -butadiene –s tyre ne 377 composites and PMMA/MABS/cenospheres composites as a function of content of Fly ash cenospheres (wt %). Table 4. Values of Flexural Strength of PMMA filled with Cenospheres Composites. Column (a): values with PMMA-cenospheres (100 mesh); Column (b): values with PMMA/MABS/cenospheres (100 mesh). Figure 5. Variation in Flexural Strength of PMMA/cenospheres (100 mesh) (PMMAFAC100); PMMA/MABS/cenospheres (PMMAMABSFAC100) composites against Content of Cenospheres (wt%). 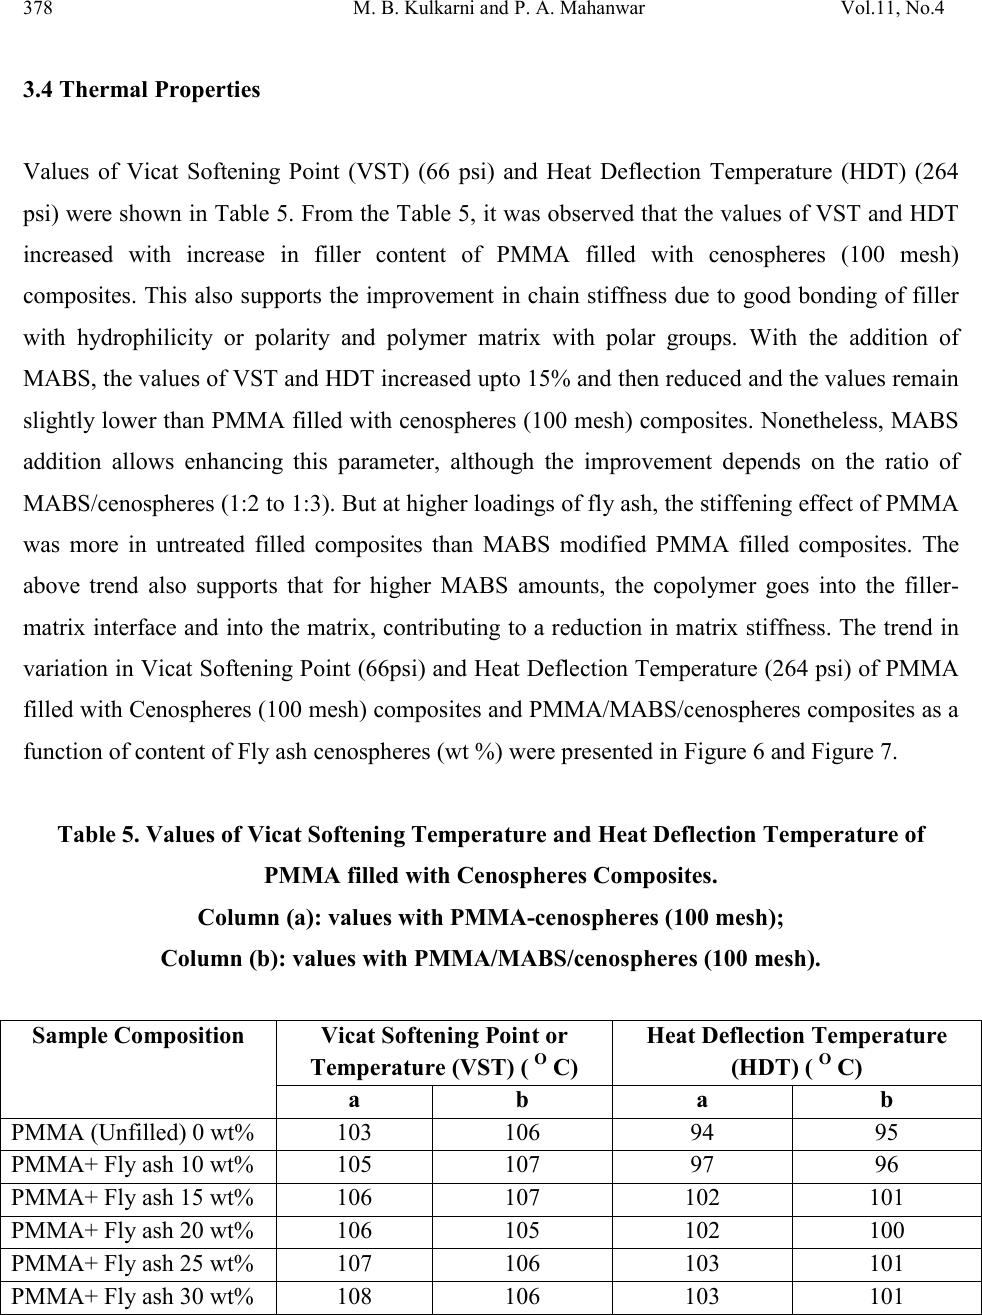 378 M. B. Kulkarni and P. A. Mahanwar Vol.11, No.4 3.4 Thermal Pro p erti es Values of Vicat Softening Point (VST) (66 psi) and Heat Deflection Temperature (HDT) (264 psi) were shown in Table 5. From the Table 5, it was observed that the values of VST and HDT increased with increase in filler content of PMMA filled with cenospheres (100 mesh) composites. This also supports the improvement in chain stiffness due to good bonding of filler with hydrophilicity or polarity and polymer matrix with polar groups. With the addition of MABS, the values of VST and HDT increased upt o 15% and then r educed and the v alues remain slightly lower than PMMA filled with cenospheres (100 mesh) composites. Nonetheless, MABS addition allows enhancing this parameter, although the improvement depends on the ratio of MABS/cenospheres (1:2 to 1:3). But at higher loadings of fly ash, the stiffening effect of PMMA was more in untreated filled composites than MABS modified PMMA filled composites. The above trend also supports that for higher MABS amounts, the copolymer goes into the filler- matrix interface and into the matrix, contributing to a reduction in matrix stiffness. The trend in variation in Vicat Softening Point (66psi) and Heat Deflection Temperature (264 psi) of PMMA filled with Cenospheres (100 mesh) composites and PMMA/MABS/cenospheres composites as a function of content of Fly ash cenospheres (wt %) were presented in Figure 6 and Figure 7. Table 5. Values of Vicat Softening Temperature and Heat Deflection Temperature of PMMA filled with Cenospheres Composites. Column (a): values with PMMA-cenospheres (100 mesh); Column (b): values with PMMA/MABS/cenospheres (100 mesh). Temperat ure (VST) ( O C) Heat Deflection Temperature (HDT) ( O C)  Vol.11, No .4 Effect of Methyl methacrylate– acrylonitrile -butadiene –s tyre ne 379 Figure 6. Variation in Vicat Softening Point of PMMA/cenospheres (100 mesh) (PMMAFAC100); PMMA/MABS/cenospheres (PMMAMABSFAC100) composites against Content of Cenospheres (wt%). Figure 7. Variation in Heat Deflection Temperature of PMMA/cenospheres (100 mesh) (PMMAFAC100); PMMA/MABS/cenospheres (PMMAMABSFAC100) composites against Content of Cenospheres (wt%).  380 M. B. Kulkarni and P. A. Mahanwar Vol.11, No.4 4. CONCLUSIO NS The principal conclusions obtained from the experimental results of new composites of PMMA using different amounts of Fly ash cenospheres and a new Methyl methacrylate- acrylonitrile- butadiene-styrene (MABS) are summarized as follows: • The MABS can act as a modifier for the PMMA/Fly ash cenospheres filled polymeric composites. • Tensile Strength and Percentage Elongation at Break values of the PMMA/cenospheres composites decreased slightly with increasing cenospheres content, but it kept reasonably acceptable values if we bear in mind that rigid filler was incorporated into polymer matrix. Nonetheless, MABS addition allows slight decrease in Tensile Strength, Percentage Elongation at Break upto 1:4 ratio of MABS/cenospheres, alt hough th e improvement depends on the ratio of MABS/cenospheres (1:2). • The data for unmodified PMMA/cenospheres (100 mesh) composites lies in between the curves with K==0-0.6 higher than that of non polar polymer composites. While the data for PMMA/MABS/cenospheres composites lies closer to the curve with K==0.6. • The Impact Strength of the PMMA/cenospheres filled composites decreased with increasing filler content. While the impact performance of the PMMA/MABS/cenospheres filled composites showed comparable values to PMMA/cenospheres filled compositions upto 15% and at higher loadings of MABS, the impact performance of the PMMA/MABS/cenospheres filled composites showed enhancement in the impact performance as compared with PMMA/cenospheres (100 mesh) composites. • The values of Flexural Strength improved upto 15-25% addition of cenospheres and the n reduced marginally but higher than that of PMMA. With the addition of MABS the values of Flexural Strength slightly improved upto 15% and then reduced and the values remain slightly lower than PMMA/cenospheres filled composites.  Vol.11, No .4 Effect of Methyl methacrylate– acrylonitrile -butadiene –s tyre ne 381 • The values of VST and HDT increased with increase in filler content and the values for PMMA/cenospheres filled compositions showed slight improvement than MABS modified PMMA/cenospheres compositions. But at higher loadings of cenospheres, the stiffening effect of PMMA was more in PMMA/cenospheres filled composites than MABS modified PMMA/cenospheres filled composites. • The optimum performances in mechanical and thermal properties were obtained when the ratio of MABS to cenospheres was 1:2. ACKNOWLEDGEMENTS Authors sincerely thanks to the Honorable Director, Prof. (Dr.) Vishwanath D. Karad, MAEER’s, Maharashtra Institute of Technology, Pune for his constant encouragement and support. We express our sincere thanks to Board of College and University Development (BCUD), University of Pune, for providing financial grant to carry out this work. Mr. Ashok M. Bhagat, Proprietor of Praj Laboratory, Kothrud, Pune; Mr. Ravikiran G. Patil and Mr. P rasad V. Mahajan, who in various ways contributed to the completion of this study. REFERENCES [1] Sharma, A. K., and Mahanwar, P. A., 2010, “Effect of particle size of fly ash on recycled poly (ethylene terephthalate) / fly ash composites.” Int J Plast Technol, Vol. 14, pp. 53-64. [2] Bose, S., and Mahanwar, P. A., 2004, “Effect Of Flyash On The Mechanical, Thermal, Dielectric, Rheological And Morphological Properties Of Filled Nylon 6.” Journal of Minerals & Materials Characterization & Engineering, Vol. 3, No. 2, pp. 65-72. [3] Deb Nath, D. C., Bandyopadhyay, S., Yu, A., Blackburn, D., and White, C., 2010, “High strength bio-composite films of poly (vinyl alcohol) reinforced with chemically modified- fly ash.” J. Mater Sci, Vol. 45, pp. 1354-1360. [4] Kishore, Kulkarni, S. M., Sunil, D., and Sharathchandra, S., 2002, “Effect of surface treatment on the impact behavior of fly-ash filled polymer composites.” Polymer International, Vol. 51, pp. 1378-1384.  382 M. B. Kulkarni and P. A. Mahanwar Vol.11, No.4 [5] Chand, N., and Vashishtha, S. R., 2000, “Development, st ructure and strength properties of PP/PMMA/FA blends.” Bull. Mater. Sci., Vol. 23, No. 2, pp. 103-107. [6] Bose, S., and Mahanwar, P. A., 2004, “Effect of Particle Size of Filler on Properties of Nylon-6.” Journal of Minerals & Materials Characterization & Engineering, Vol. 3, No. 1, pp. 23-31. [7] Bose, S., Pandey, R., Kulkarni, M. B., and Mahanwar, P. A., 2005, “Effect of talc and Synthetic Sodium Aluminium Silicate (SSAS) on the Properties of Poly (Methyl Methacrylate). ” Journal of Thermoplastic Composite Materials, Vol. 18, No. 5, pp. 393- 405. [8] Tang, C. Y., Chang, L. C., Liang, J. Z., Cheng, K. W. E., and Wong, T. L., 2002, “Mechanical and Thermal properties of ABS-CaCO3 Composites.” Journal of Reinforced plastics and Composites,Vol. 21, No. 15, pp. 1337-45. [9] Liang, J. Z., 2005, “Mechanical Properties of Hol low Glass Bead-filled ABS Composites.” Journal of Thermoplastic Composite Materials, Vol. 18, pp. 407-416. [10] Paul, T. K., Satpathy, S. K., Manna, I., Chakraborty, K. K., and Nando, G. B., 2007, “Preparation and Characterization of Nano structured Materials from Fly Ash: A Waste from Thermal Power Stations, by High Energy Ball Milling.” Nanoscale Res Lett., Vol. 2, pp. 397-404. [11] Rohatgi, P. K., Matsunaga, T., and Gupta N., 2009, “Compressive and ultrasonic properties of polyester/fly ash composites.” J. Mater Sci., Vol. 44, pp. 1485-1493. [12] Anshits, N. N., Vereshchagina, T. A., Bayukov, O. A., Salanov, A. N., and Anshits, A. G., 2005, “The Nature of Nanoparticles of Crystalline Phases in Ceospheres and Morphology of Their Shells.” Glass Physics and Chemistry,Vol. 31, No. 3, pp. 306-315. [13] Mcbride, S. P., Shukla, A., and Bose, A., 2002, “Processing and characterization of lightweight concrete using cenospheres.” Journal of materials Science, Vol. 37, pp. 4217- 4225. [14] Bandyopadhyay, S., Zaeni, A., Nath, D., Yu, A., Zeng, Q., Blackburn, D., and White, C., 2010, “Advanced utilization of as received and near whitened fly ash in polypropylene polymer to improve mechanical, notched impact and whiteness colour properties.” Int J Plast Technol, Vol. 14, No. Suppl 1, pp. S51–S 56.  Vol.11, No .4 Effect of Methyl methacrylate– acrylonitrile -butadiene –s tyre ne 383 [15] Chand, N., 1988, “SEM observation of fractured fly ash-polyester composites.” J Mater Sci Lett, Vol. 7, pp. 36-38. [16] Srivastava, V. K., and Shembek ar , P. S., 1990, “Tensile and fracture properties of epoxy resin filled with fly ash particles.” J Mater Sci, Vol. 25, pp. 3513–3516. [17] Ares, A., Pardo, S. G., Abad, M. J., Cano, J., and Barral, L., 2010, “Effect of aminomethoxy silane and olefin block copolymer on rheomechanical and morphological behavior of fly ash-filled polypropylene composites.” Rheol Acta, Vol. 49, No. 18, pp. 607-618. [18] Rao, K. H., Forssberg, K. S. E., and Forsling, W., 1998, “Interfacial interactions and mechanical properties of mineral filled polymer composites: wollastonite in PMMA polymer matrix.” Colloids and Surface A: Physicochemical and Engine ering Aspects, Vol. 133, No. 1-2, pp. 107-117. [19] Lin, H., Day, D. E., and Stoffer, J. O., 1992, “Optical and mechanical properties of optically transparent poly(methyl methacrylate) composites.” Polymer Engineering & Science, Vol. 32, No. 5, pp. 344-350. [20] Iisaka, K., and Shibayama, K., 1978, “Effect of Particle size on dynamic mechanical properties of poly(methyl methacrylate).” Journal of Applied Polymer Science, Vol. 22, No. 5, pp. 1321-1330. [21] Shinzato, S., Nakamura, T., Kokubo, T., and Kitamura, Y., 2001, “A new bioactive bone cement: Effect of glass bead filler content on mechanical and biological properties.” Journal of Biomedical Materials Research, Vol. 54, No. 4, pp. 491-500. [22] Abramoff, B., and Covino, J., 1992, “Transmitt ance and mechani cal prop erties o f PMMA- fumed silica composites.” Journal of Applied Polymer Science, Vol. 46, No. 10, pp. 1785- 1791. [23] Maspoch, M. L., Tafzi, A., Ferrando, H. E., Velasco, J. I., and Benasat, A. M., 2001, “Filled PMMA: mechani cal properties and fracture behavior.” Macromolecular Symposia, Vol. 169, No. 1, pp. 159-164. [24] Maiti, S. N., and Jeyakumar, R., 1990, “Mechanical and Melt Rheological Properties of CaCO3-Filled Polyethylene.” J. Polymer material, Vol. 7, pp. 29-34.
|