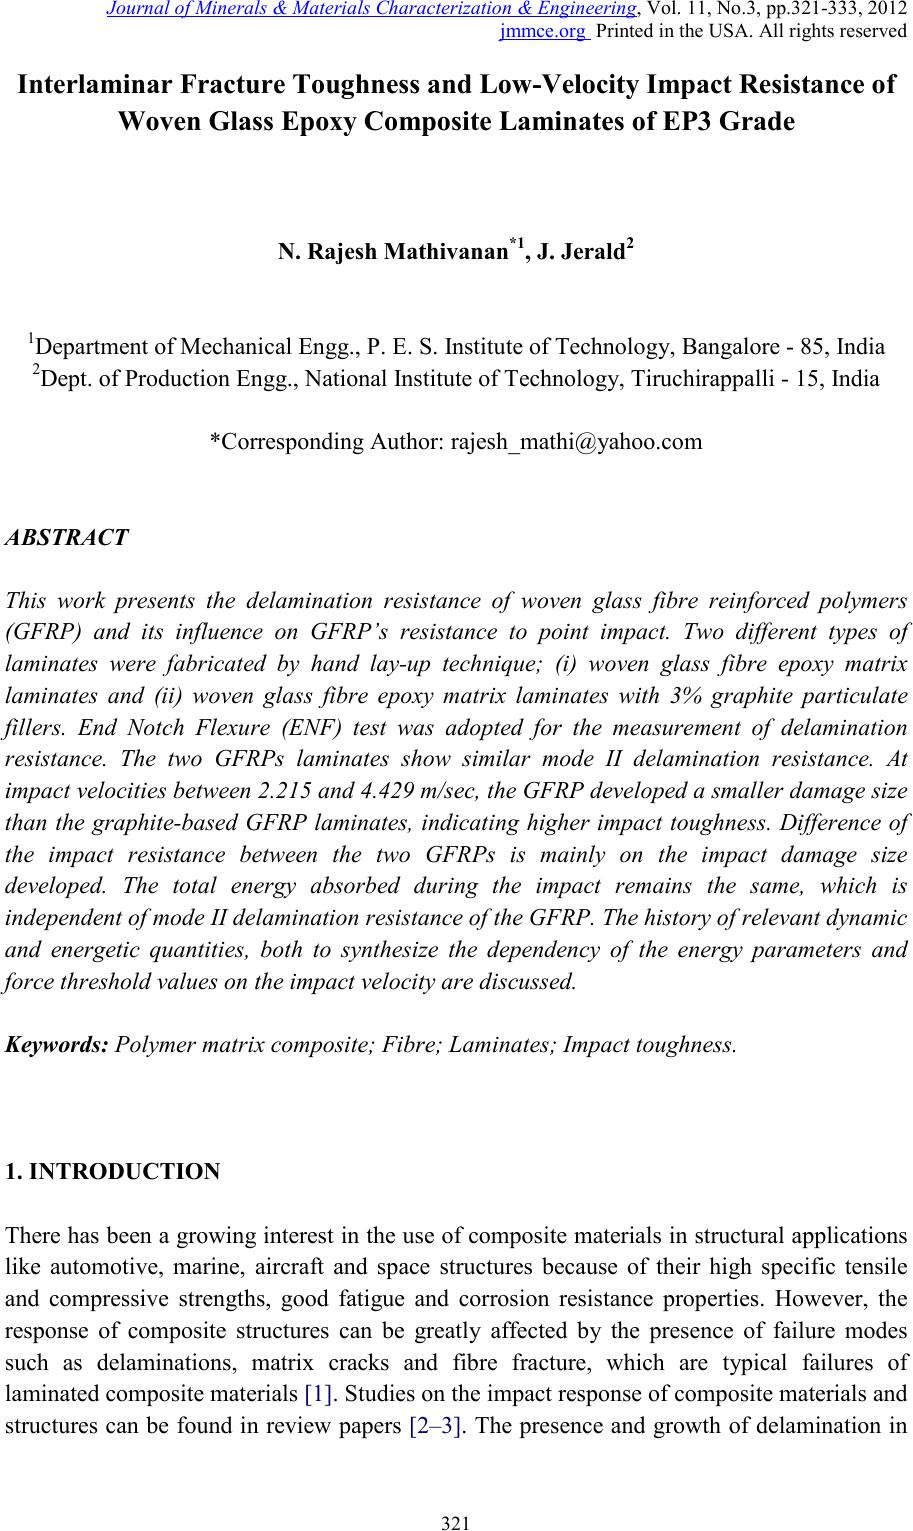
 Journal of Minerals & Materials Characterization & Engineering, Vol. 11, No.3, pp.321-333, 2012 jmmce.org Printed in the USA. All rights reserved 321 Interlaminar Fracture Toughness and Low-V el oc ity Impac t R esi st an ce of Woven Glass Epoxy Composite L amin ates of EP3 Grade N. Rajesh Mathivanan*1, J. Jerald 2 1Department of Mechanical Engg., P. E. S. Institute of Technology, Bangalo r e - 85, India 2Dept. of Production Engg., N ational Institute of Technology, Tiruchirappalli - 15, India *Corresponding Author: rajesh_mathi@yahoo.com ABSTRACT This work presents the delamination resistance of woven glass fibre reinforced polymers (GFRP) and its influence on GFRP’s resistance to point impact. Two different types of laminates were fabricated by hand lay-up technique; (i) woven glass fibre epoxy matrix laminates and (ii) woven glass fibre epoxy matrix laminates with 3% graphite particulate fillers. End Notch Flexure (ENF) test was adopted for the measurement of delamination resistance. The two GFRPs laminates show similar mode II delamination resistance. At impact velocities between 2.215 and 4.429 m/sec, the GFRP developed a smaller damage size than the graphite-based GFRP laminates, indicating higher impact toughness. Difference of the impact resistance between the two GFRPs is mainly on the impact damage size developed. The total energy absorbed during the impact remains the same, which is independent of mode II delamination resistance of the GFRP. The history of relevant dynamic and energetic quantities, both to synthesize the dependency of the energy parameters and force threshold values on the impact velocity are discussed. Keywor d s: Polymer matrix composite; Fibre; Laminates; Impact toughness. 1. INTRODUCTIO N There has been a growing interest in the use of composite materials in structural applications like automotive, marine, aircraft and space structures because of their high specific tensile and compressive strengths, good fatigue and corrosion resistance properties. However, the response of composite structures can be greatly affected by the presence of failure modes such as delaminations, matrix cracks and fibre fracture, which are typical failures of laminated composite materials [1]. Studies on the impact response of composite materials and structures can be found in review papers [2–3]. The presence and growth of delamination in 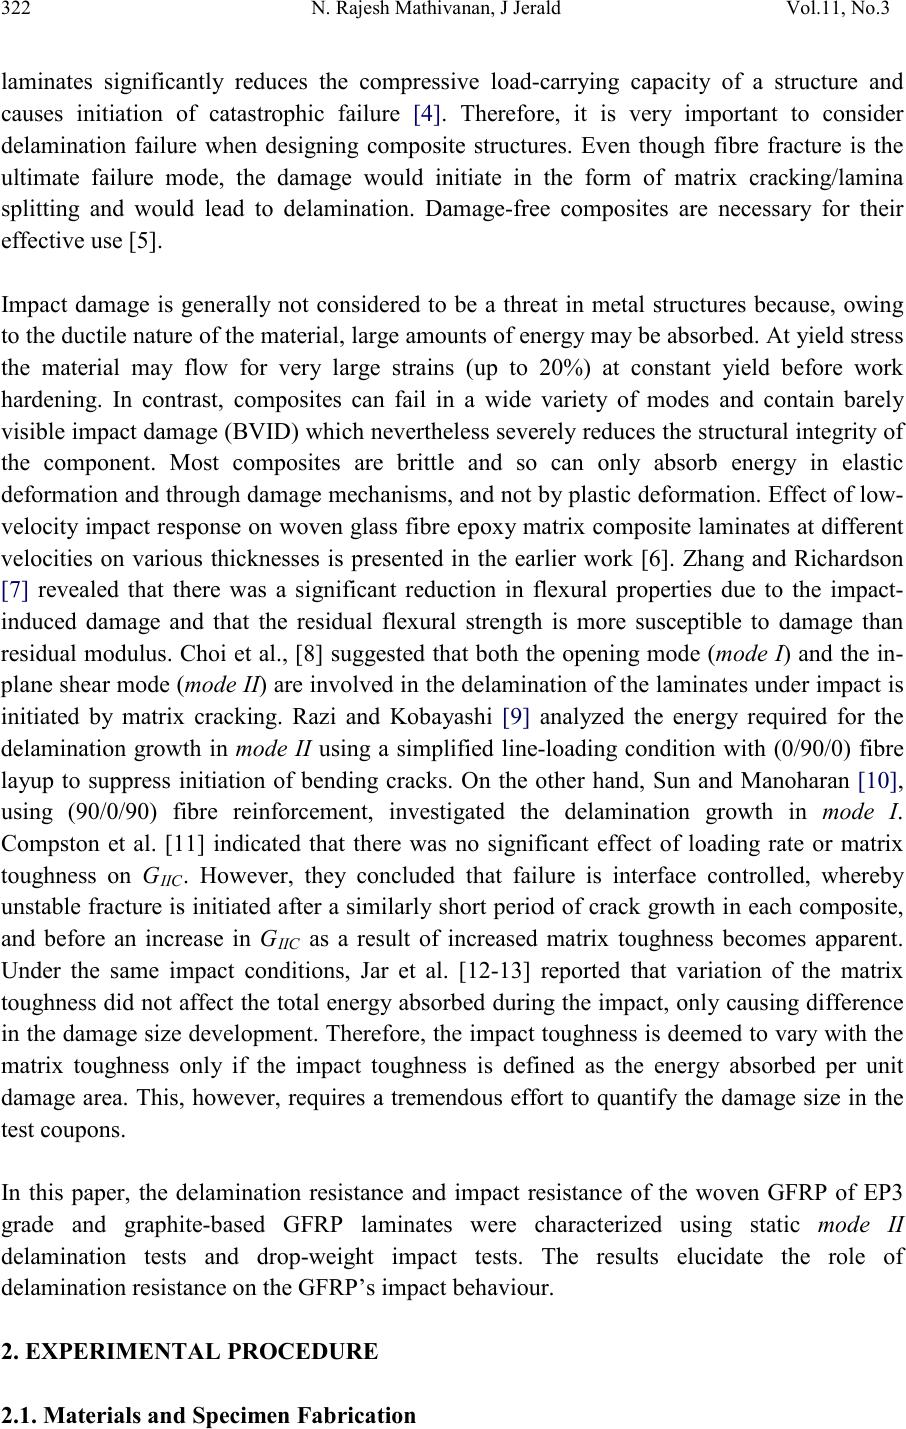 322 N. Rajesh Mathivanan, J Jerald Vol.11, No.3 laminates significantly reduces the compressive load-carrying capacity of a structure and causes initiation of catastrophic failure [4]. Therefore, it is very important to consider delamination failure when designing composite structures. Even though fibre fracture is the ultimate failure mode, the damage would initiate in the form of matrix cracking/lamina splitting and would lead to delamination. Damage-free composites are necessary for their effective use [5]. Impact damage is generally not considered to be a threat in metal structures because, owing to the ductile nature of the m at erial , l ar ge am ou nt s o f ener gy may be absor bed. At yield st res s the material may flow for very large strains (up to 20%) at constant yield before work hardening. In contrast, composites can fail in a wide variety of modes and contain barely visi ble im pact dam age ( BVID) whi ch nev erthel ess sever ely r educes the s tru ctural i nte grit y of the component. Most composites are brittle and so can only absorb energy in elastic deformation and through damage mechanisms, and not b y plastic deformat ion. Effect of low- velocit y impact response on woven glass fibre epox y matrix composite laminates at different velocities on various thicknesses is presented in the earlier work [6]. Zhang and Richardson [7] revealed that there was a significant reduction in flexural properties due to the impact- induced damage and that the residual flexural strength is more susceptible to damage than residual modulus. Choi et al., [8] suggested that both the opening mode (mode I) and the in- plane shear mode (mode II) are involved in the delamination of the laminates under impact is initiated by matrix cracking. Razi and Kobayashi [9] analyzed the energy required for the delamination growth in mode II using a simplified line-loading condition with (0/90/0) fibre layup to suppress initiation of bending cracks. On the other hand, Sun and Manoharan [10], using (90/0/90) fibre reinforcement, investigated the delamination growth in mode I. Compston et al. [11] indicated that there was no significant effect of loading rate or matrix toughness on GIIC. However, they concluded that failure is interface controlled, whereby unstable fracture is initiated after a similarl y short period of crack growth in each composite, and before an increase in GIIC as a result of increased matrix toughness becomes apparent. Under the same impact conditions, Jar et al. [12-13] reported that variation of the matrix toughness did not affect the total energy absorbed during the impact, only causing difference in the damage size development. Therefore, the impact toughness is deemed to vary with the matrix toughness only if the impact toughness is defined as the energy absorbed per unit damage area. This, however, requires a tremendous effort to quantify the damage size in the test coupons. In this paper, the delamination resistance and impact resistance of the woven GFRP of EP3 grade and graphite-based GFRP laminates were characterized using static mode II delamination tests and drop-weight impact tests. The results elucidate the role of delamination resistance on the GFRP’s impact behaviour. 2. EXPERIMENTAL PRO CEDURE 2.1. Materials and Specimen Fabrication 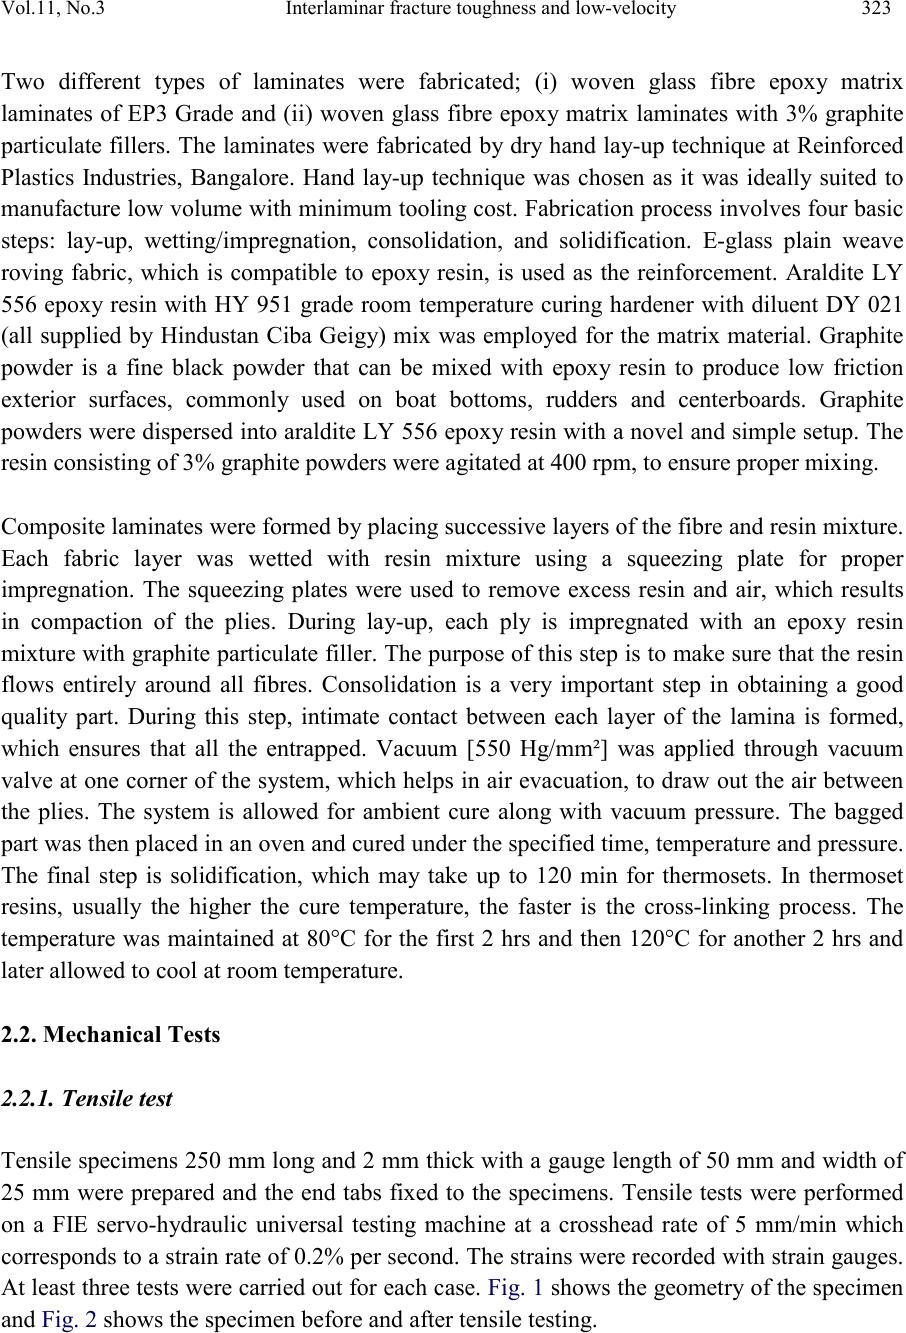 Vol.11, No .3 Interlaminar fracture toughness and low-velocity 323 Two different types of laminates were fabricated; (i) woven glass fi b re epoxy matrix laminates of EP3 Grade and (ii) woven glass fibr e epoxy matrix laminates with 3% graphite particulate fillers. The laminates were fabricated by dry hand la y-up technique at Reinforced Plastics Industries, Bangalore. Hand lay-up technique was chosen as it was ideally suited to manufacture low volume with minimum tooling cost. Fabrication p rocess involves four basic steps: lay-up, wetting/impregnation, consolidation, and solidification. E-glass plain weave roving fabric, which is compatible to epoxy resin, is used as the reinforcement. Araldite LY 556 epoxy resin with HY 951 grade room temperature curing hardener with diluent DY 021 (all supplied by Hindustan Ciba Geigy) mix was employed for the matrix material. Graphite powder is a fine black powder that can be mixed with epoxy resin to produce low friction exterior surfaces, commonly used on boat bottoms, rudders and centerboards. Graphite powders were dispersed into araldite LY 556 epoxy resin with a novel and si mple setup. The resin consisting of 3% graphite powders were agitated at 400 rpm, to ensure proper mixing. Composite laminates were form ed by pla cin g su cc ess iv e layers of th e fi b re and resin mixture. Each fabric layer was wetted with resin mixture using a squeezing plate for proper impregnation. The squeezing plates were used to remove excess resin and air, which results in compaction of the plies. During lay-up, each ply is impregnated with an epoxy resin mixture with graphite particulate filler. The purpose of this step is to make sure that the resin flows entirely around all fibres. Consolidation is a very important step in obtaining a good quality part. During this step, intimate contact between each layer of the lamina is formed, which ensures that all the entrapped. Vacuum [550 Hg/mm²] was applied through vacuum valve at one corner of th e s ystem, which helps in air evacuation, to draw out the air between the plies. The system is allowed for ambient cure along with vacuum pressure. The bagged part was then placed in an oven and cured under the specified time, temperature and pressure. The final step is solidification, which may take up to 120 min for thermosets. In thermoset resins, usually the higher the cure temperature, the faster is the cross-linking process. The temperature was maintained at 80°C for the first 2 hrs and then 120°C for another 2 hrs and later allowed to cool at room temperature. 2.2. Mechanical Tests 2.2.1. Tensile test Tensile specimens 250 mm long and 2 mm thick with a gauge length of 50 mm and width of 25 mm were prepared and the end tabs fixed to the specimens. Tensile tests were performed on a FIE servo-hydraulic universal testing machine at a crosshead rate of 5 mm/min which corresponds to a strain rate of 0.2% per second. The strains were recorded with strain gauge s. At least three tests w ere carried out fo r ea ch cas e. Fig. 1 shows the geometr y of the sp ecimen and Fig. 2 shows the specimen before and after tensile testing.  324 N. Rajesh Mathivanan, J Jerald Vol.11, No.3 Figure 1 Dimensions of tensile test specimen Figure 2 Tensile test specimens before and after tensile testing 2.2.2 End Notch Flexure (ENF) test Several test methods are widely used to quantify the delamination resistance, among which End Notch Flexure (ENF) test is being adopted as an international standard for the measurement of mode II delamination resistance. The 3-point bending is the common mode used to induce fracture, b ut yet acc ept ed as a st andard [ 14] . Never th eles s, the 3-point bending test on specimens with an end-notched defect, kn own as end notch flex ure test, has b een used by many researchers to assess composites’ mode II delamination resistance. FIE universal testing machine was used for the ENF tests, with a crosshead speed of 5 mm/min. At least three specimens were tested for each condition to ensure reproducibility of the results. The sample did not break into two fragments, demonstrating a true composite ‘‘pseudo-plastic’’ behaviour. Fig. 3 shows the specimen mounted on FIE UTM and Fig. 4 shows the schematic sketch for the set-up and the specimen dimensions used for the ENF test [15], Figure 3 Experimental set-up with data acquisition system . 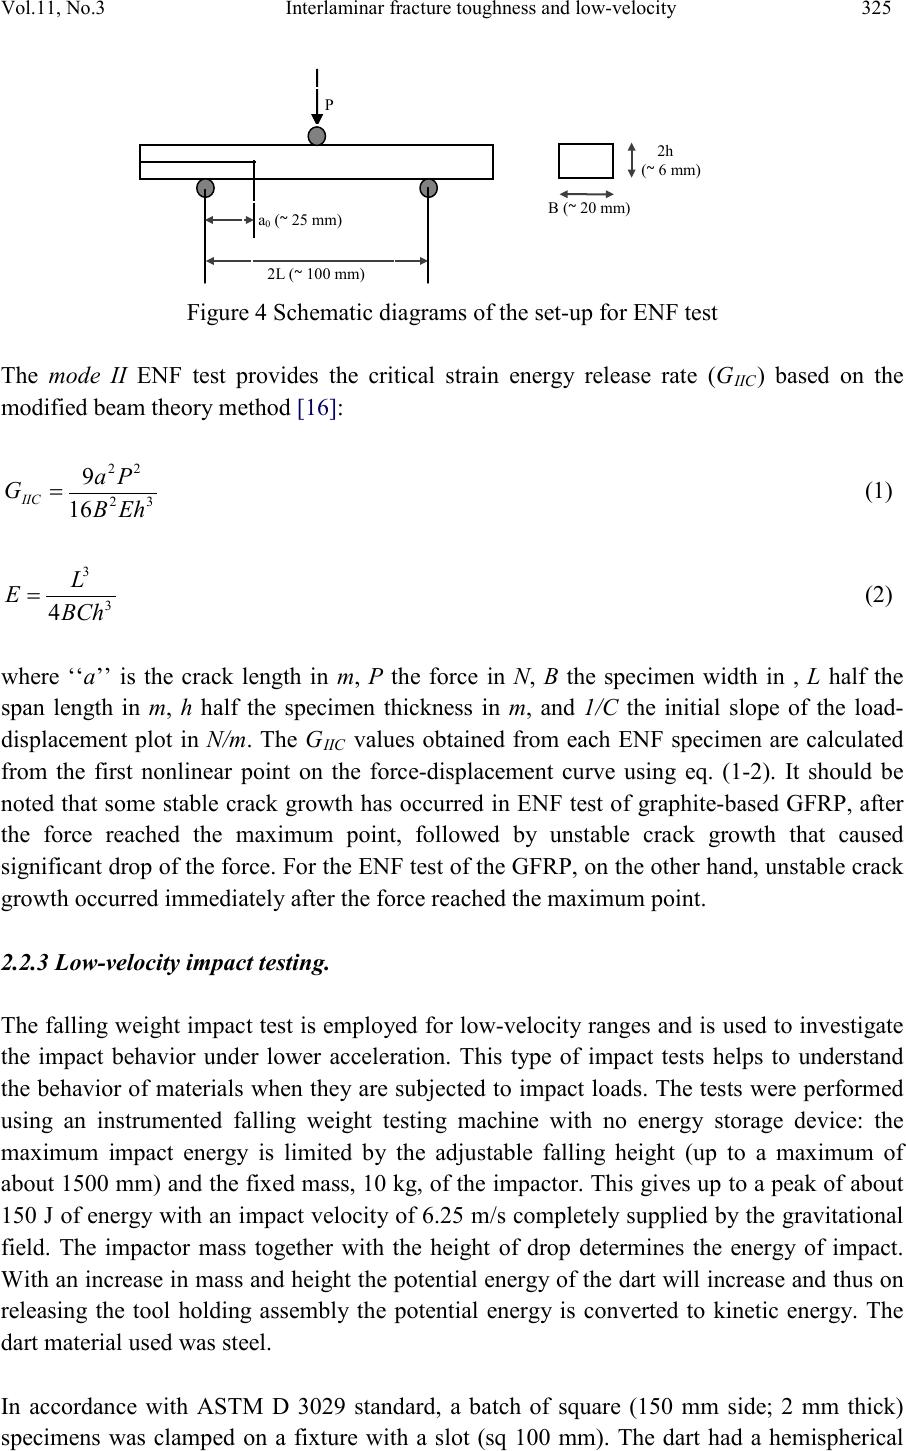 Vol.11, No .3 Interlaminar fracture toughness and low-velocity 325 Figure 4 Schematic diagrams of the set-up for ENF test The mode II ENF test provides the critical strain energy release rate (GIIC) based on the modified beam theory method [16]: (1) (2) where ‘‘a’’ is the crack length in m, P the force in N, B the specimen width in , L half the span length in m, h half the specimen thickness in m, and 1/C the initial slope of the load- displacement plot in N/m. The GIIC values obtained from each ENF specimen are calculated from the first nonlinear point on the force-displacement curve using eq. (1-2). It should be noted that some stable crack growth has occurred in ENF test of graphite-based GFRP, after the force reached the maximum point, followed by unstable crack growth that caused significant drop of the force. For the ENF test of the GFRP, on the other hand, unstable crack growth occurred immediately after the force reached the maximum point. 2.2.3 Low-velocity impact testing. The falling weight impact test is employed for low-velocit y ranges and is used to investi gate the impact behavior under lower acceleration. This type of impact tests helps to understand the behavior of materials when they are subjected to impact loads. The tests were performed using an instrumented falling weight testing machine with no energy storage device: the maximum impact energy is limited by the adjustable falling height (up to a maximum of about 1500 mm) and the fix ed mass, 10 kg, of the impactor. This gives up to a peak of about 150 J of energy with an impact velocit y of 6.25 m/s completely supplied by the gravitational field. The impactor mass together with the height of drop determines the energy of impact. Wit h an increase in m ass and height the potential energy of the dart will increase and thus on releasing the tool holding assembly the potential energy is converted to kinetic energy. The dart material used was steel. In accordance with ASTM D 3029 standard, a batch of square (150 mm side; 2 mm thick) specimens was clamped on a fixture with a slot (sq 100 mm). The dart had a hemispherical 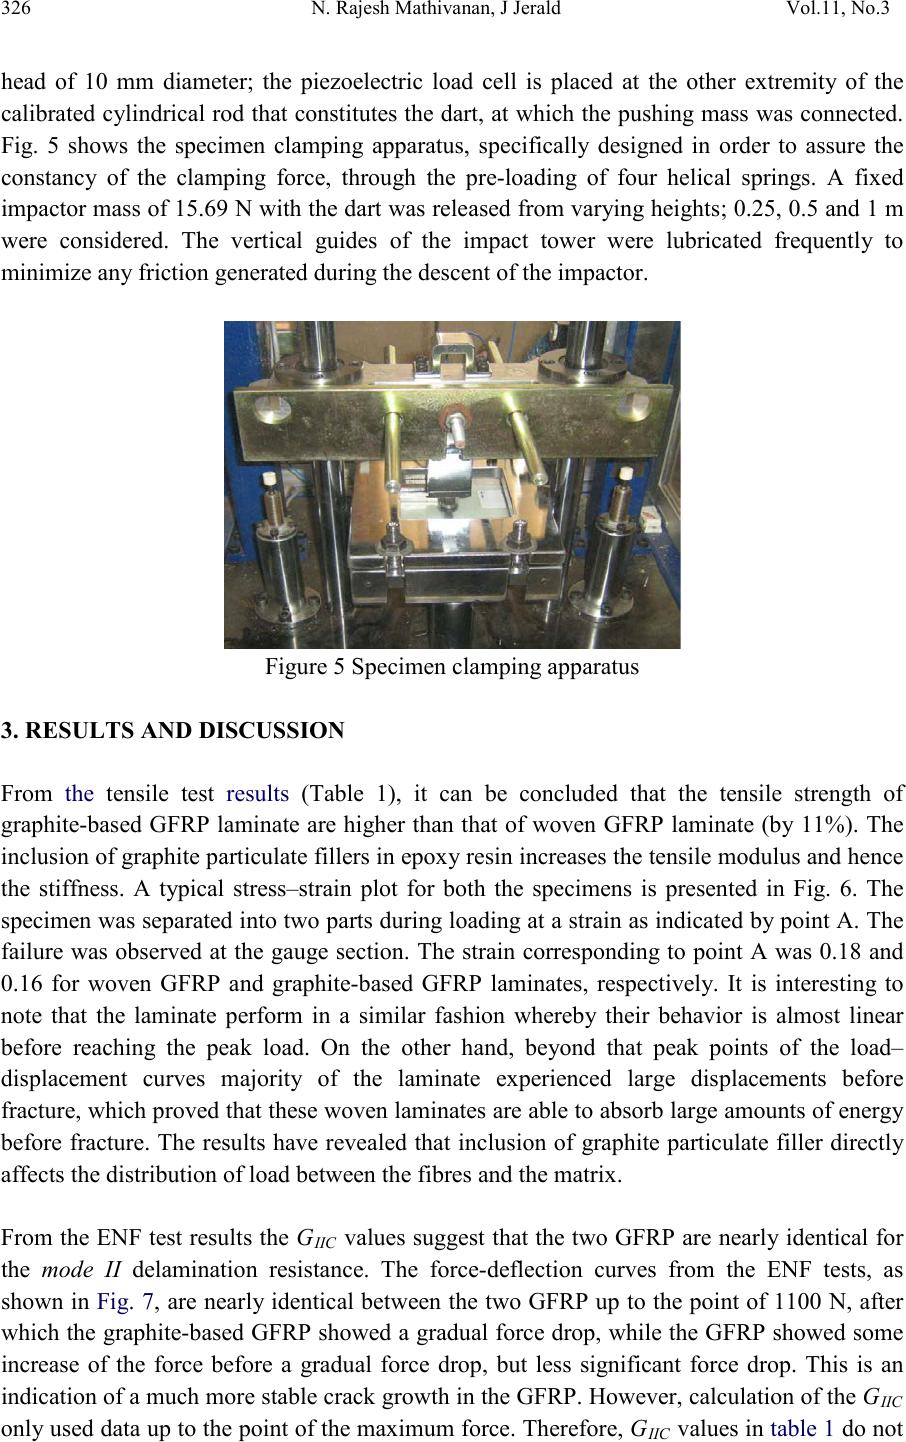 326 N. Rajesh Mathivanan, J Jerald Vol.11, No.3 head of 10 mm diameter; the piezoelectric load cell is placed at the other extremity of the calibrated cylindrical rod that constitutes the dart, at which the pushing mass was connected. Fig. 5 shows the specimen clamping apparatus, specifically designed in order to assure the constancy of the clamping force, through the pre-loading of four helical springs. A fixed impactor mass of 15.69 N with the dart was released from varying heights; 0.25, 0.5 and 1 m were considered. The vertical guides of the impact tower were lubricated frequently to minimize any friction generated during the descent of the impactor. Figure 5 Specimen clamping apparatus 3. RESULTS AND DISCUSSION From the tensile test results (Table 1), it can be concluded that the tensile strength of graphite-based GFRP laminate are higher than that of woven GFRP laminate (by 11%). The inclusion of graphite particulate fillers in epox y resin increases the tensile modulus and hence the stiffness. A typical stress–strain plot for both the specimens is presented in Fig. 6. The specimen was separated into two parts during loading at a strain as indicated by point A. The failure was observed at the gauge section. The strain corresponding to point A was 0.18 and 0.16 for woven GFRP and graphite-based GFRP laminates, respectively. It is interesting to note that the laminate perform in a similar fashion whereby their behavior is almost linear before reaching the peak load. On the other hand, beyond that peak points of the load– displacement curves majority of the laminate experienced large displacements before fracture, which proved that these woven laminates are able to absorb large amounts of energy before fracture. The results have revealed that inclusion of graphite particulate filler directly affects the distribution of load between the fibres and the matrix. From the ENF test results the GIIC values suggest that the two GFRP are nearl y identical for the mode II delamination resistance. The force-deflection curves from the ENF tests, as shown in Fig. 7, are nearly identical between the two GFRP up to the point of 1100 N, after which the graphite-based GFRP showed a gradual force drop, while the GFRP showed some increase of the force before a gradual force drop, but less significant force drop. This is an indication of a much more stable crack growth in the GFRP. However, calculation of the GIIC only used data up to the point of the maxi mum force. Therefore, GIIC values i n tabl e 1 do not 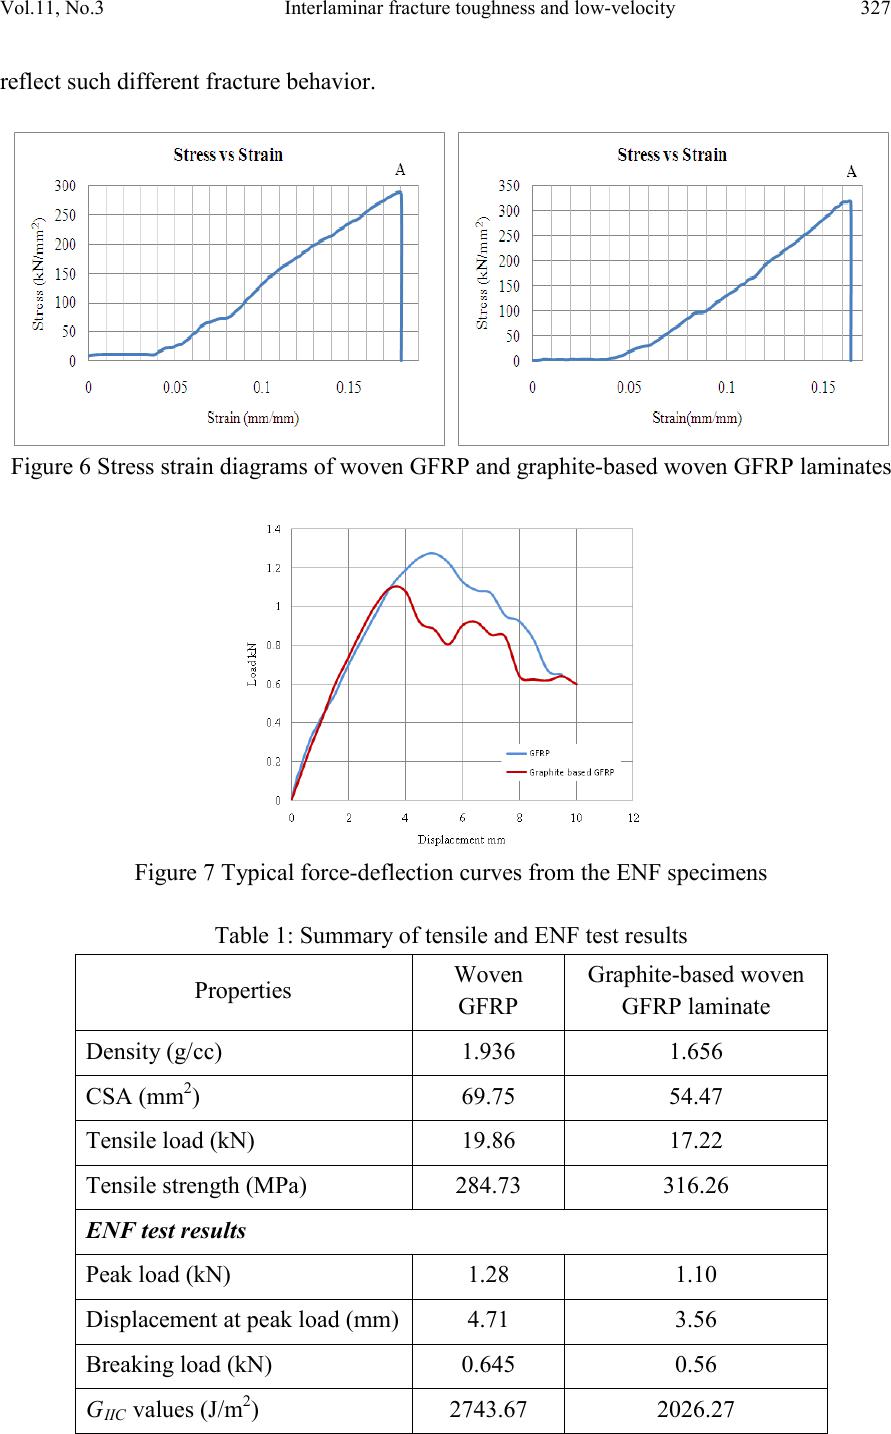 Vol.11, No .3 Interlaminar fracture toughness and low-velocity 327 reflect such different fracture behavior. Figure 6 Stress strain diagrams of woven GFRP and graphite-based woven GFRP laminates Figure 7 Typical force-deflection curves from the ENF specimens Table 1: Summary of tensile and ENF test results Propert ies Woven GFRP Graphite-based woven GFRP laminate Density (g/cc) 1.936 1.656 CSA (mm ) 69.75 54.47 Tensile load (kN) 19.86 17.22 Tensile strength (MPa) 284.73 316.26 ENF test results Peak load (kN) 1.28 1.10 Displ acement at peak load (mm) 4.71 3.56 Breaking load (kN) 0.645 0.56 GIIC values (J/m2) 2743.67 2026.27 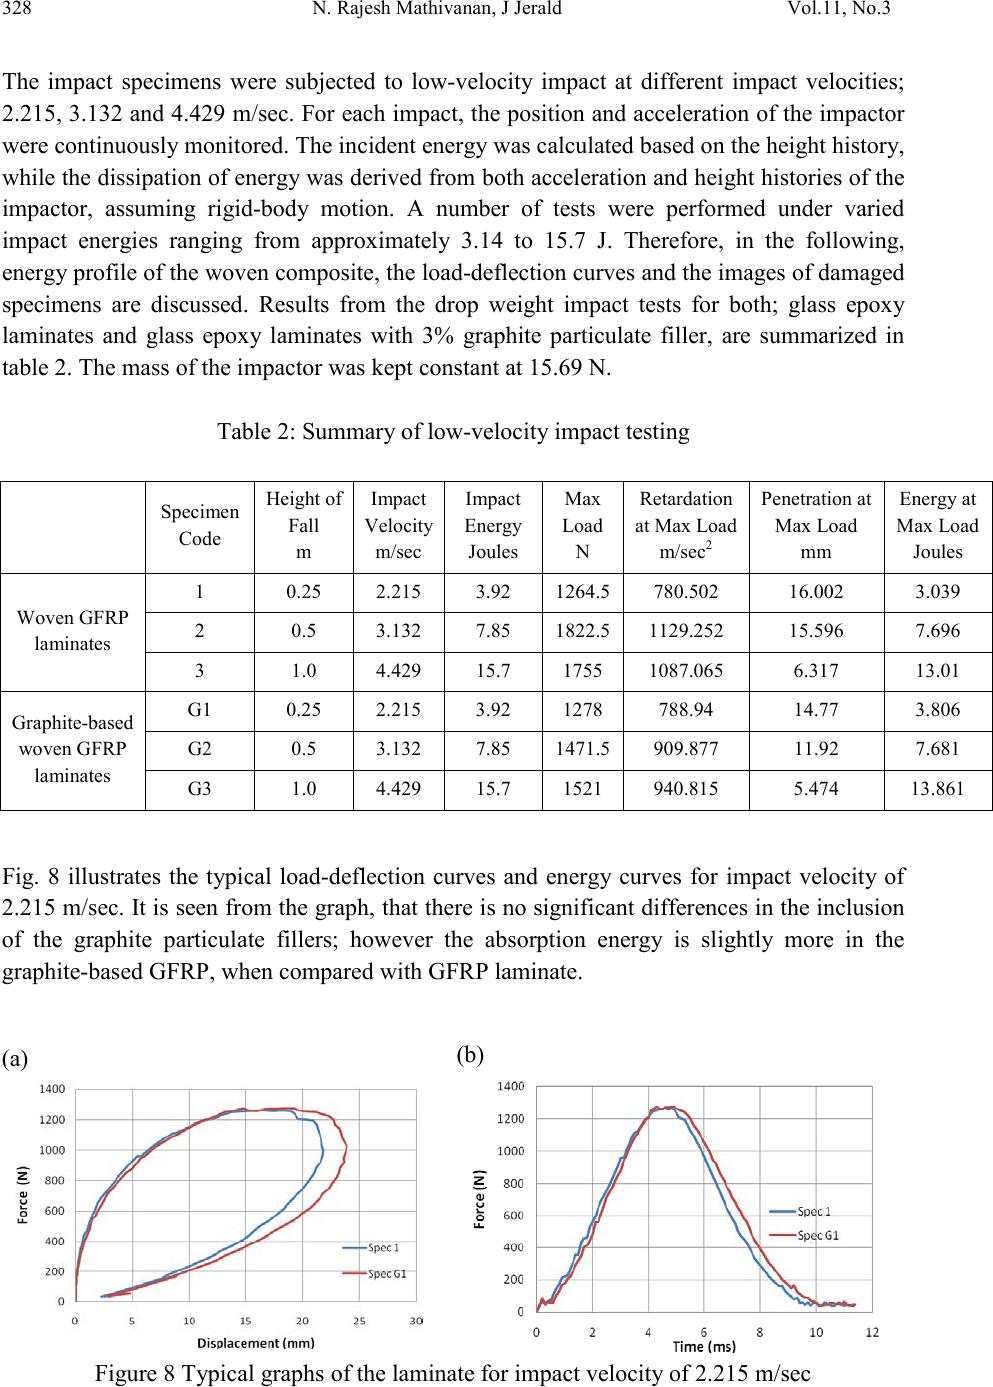 328 N. Rajesh Mathivanan, J Jerald Vol.11, No.3 The impact specimens were subjected to low-velocity impact at different impact velocities; 2.215, 3.132 and 4.429 m/sec. For each impact, the position and acc eleration o f the impactor were continuously monitored. The incident energy was calculated based on the height history, while the dissipation of energy was derived from both acceleration and height histories of the impactor, assuming rigid-body motion. A number of tests were performed under varied impact energies ranging from approximately 3.14 to 15.7 J. Therefore, in the following, energy profile of the woven composite, the load-deflection curves and the images of damaged specimens are discussed. Results from the drop weight impact tests for both; glass epoxy laminates and glass epoxy laminates with 3% graphite particulate filler, are summarized in table 2. The mass of the impactor was kept constant at 15.69 N. Table 2: Summary of low-velocity impact testing Specimen Code Height of m Impact Velocity m/sec Impact Energy Jo ules Max N Retardation at Max Load m/sec2 Penetratio n at Max Load mm Energy at Max Load Jo ules Wo ven GFR P laminates 1 0.25 2.215 3.92 1264.5 780.502 16.002 3.039 2 0.5 3.132 7.85 1822.5 1129.252 15.596 7.696 3 1.0 4.429 15.7 1755 1087.065 6.317 13.01 Graphite-based wove n GFRP laminates G1 0.25 2.215 3.92 1278 788.94 14.77 3.806 G2 0.5 3.132 7.85 1471.5 909.877 11.92 7.681 G3 1.0 4.429 15.7 1521 940.815 5.474 13.861 Fig. 8 illustrates the typical load-deflection curves and energy curves for impact velocity of 2.215 m/sec. It is seen from the graph, that there i s no significant differences in the inclusion of the graphite particulate fillers; however the absorption energy is slightly more in the graphite-based GFRP , when compared with GFRP laminate. (a) Figure 8 Typical graphs of the laminate for impact velocity of 2.215 m/sec 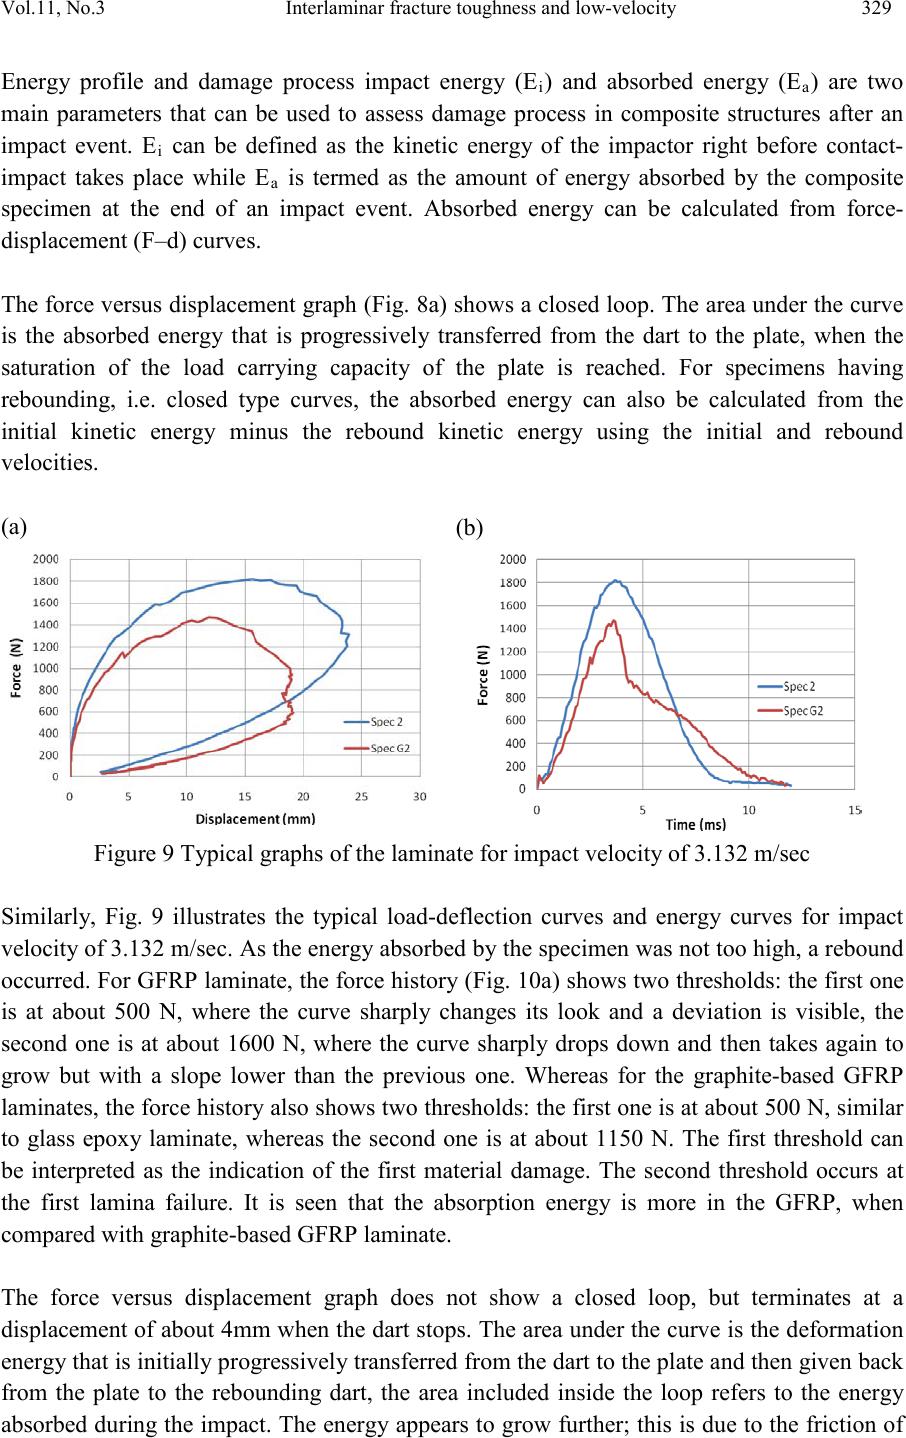 Vol.11, No .3 Interlaminar fracture toughness and low-velocity 329 Energy profile and damage process impact energy (Ei) and absorbed energy (Ea) are two main parameters that can be used to assess damage process in composite structures after an impact event. Ei can be defined as the kinetic energy of the impactor right before contact- impact takes place while Ea is termed as the amount of energy absorbed by the composite specimen at the end of an impact event. Absorbed energy can be calculated from force- displacement (F–d) curves. The for ce versus displac ement graph (Fi g. 8a) shows a closed loop. The area under the curve is the absorbed energy that is progressively transferred from the dart to the plate, when the saturation of the load carrying capacity of the plate is reached. For specimens having rebounding, i.e. closed type curves, the absorbed energy can also be calculated from the initial kinetic energy minus the rebound kinetic energy using the initial and rebound velocities. Figure 9 Typical graphs of the laminate for impact velocity of 3.132 m/sec Similarly, Fig. 9 illustrates the typical load-deflection curves and energy curves for impact velocity of 3.132 m/sec. As the energ y absorbed by the specimen was not too high, a r ebound occurred. For GFRP laminate, the force history (Fig. 10a) shows two thresholds: the first one is at about 500 N, where the curve sharply changes its look and a deviation is visible, the second one is at about 1600 N, where the curve sharply drops down and then takes again to grow but with a slope lower than the previous one. Whereas for the graphite-based GFRP laminates, the force history also shows two thresholds: the first one is at about 500 N, sim ilar to glass epoxy laminate, whereas the second one is at about 1150 N. The first threshold can be interpreted as the indication of the first material damage. The second threshold occurs at the first lamina failure. It is seen that the absorption energy is more in the GFR P, when compared with graphite-based GFRP laminate. The force versus displacement graph does not show a closed loop, but terminates at a displacement of about 4mm when the dart st ops. The area under the curve is the deformation energ y th at i s i ni t ial l y pr o gres si vely trans ferred fr om th e dart to t he p l at e a nd th en giv en back from the plate to the rebounding dart, the area included inside the loop refers to the energy absorbed during the impact. The energ y appears to grow further; this i s due to the friction of 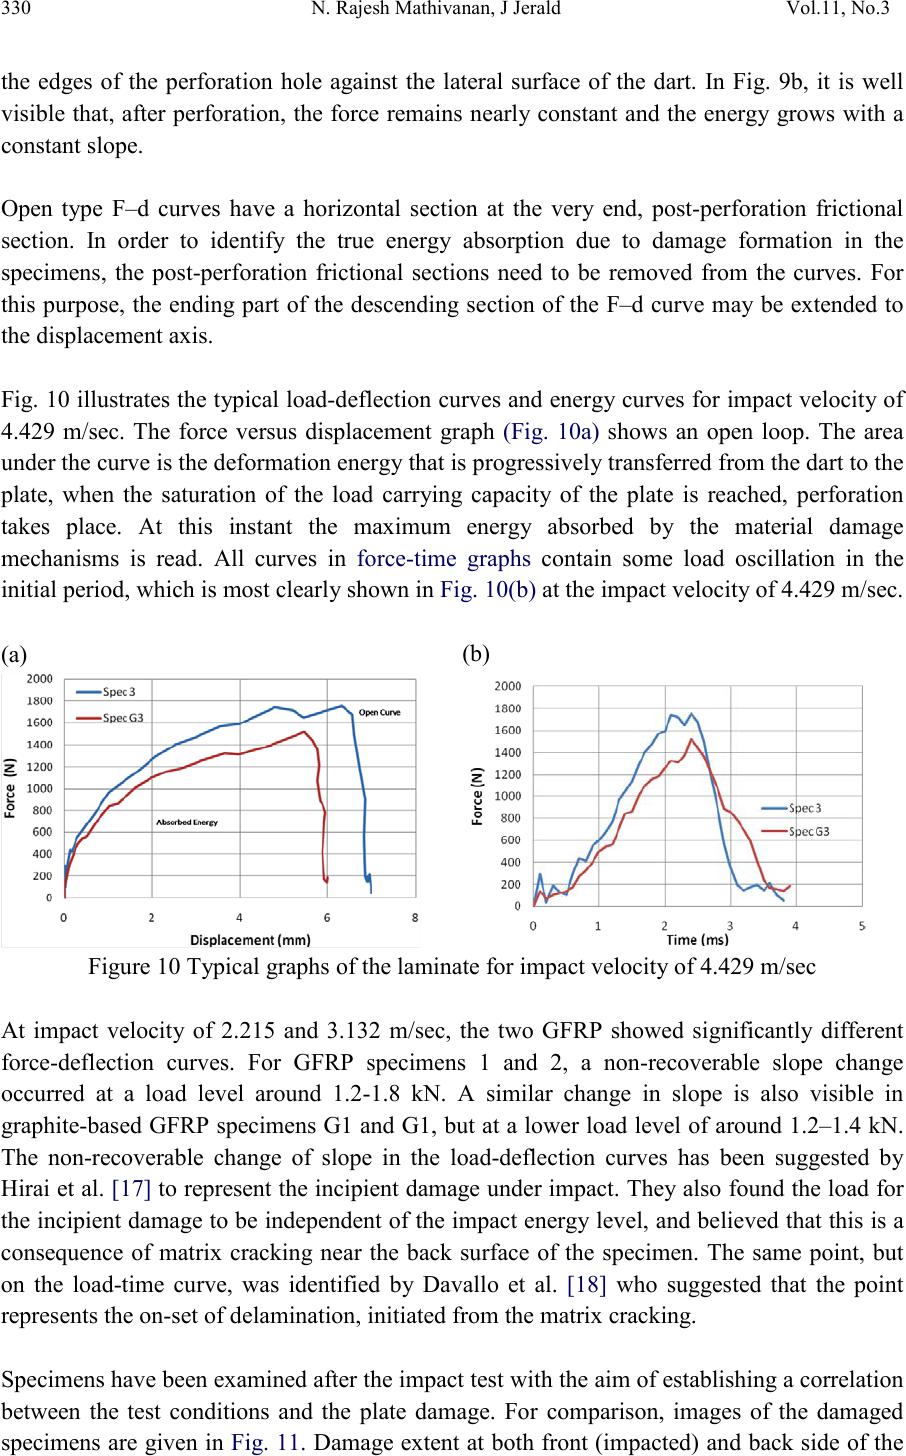 330 N. Rajesh Mathivanan, J Jerald Vol.11, No.3 the edges of the perforation hole against the lateral surface of the dart. In Fig. 9b, it is well visible that, after perforation, the force remains nearly constant and the energy grows with a constant slope. Open type F–d curves have a horizontal section at the very end, post-perforation frictional section. In order to identify the true energy absorption due to damage formation in the specimens, the post-perforation frictional sections need to be removed from the curves. For this purpose, the ending part of the descending section of the F–d curve may be extended to the displacement axis. Fig. 10 illustrates the t ypical l oad-deflecti on curves and ener gy curves for impact velocit y o f 4.429 m/sec. The force versus displacement graph (Fig. 10a) shows an open loop. The area under the curve is the deformation energy that is progressively transferred from the dart to the plate, when the saturation of the load carrying capacity of the plate is reached, perforation takes place. At this instant the maximum energy absorbed by the material damage mechanisms is read. All curves in force -time graphs contain some load oscillation in the initial period, which is most clearly shown in Fig. 10(b) at the impact velocity of 4.429 m/sec. Figure 10 Typical graphs of the laminate for impact velocity of 4.429 m/sec At impact velocity of 2.215 and 3.132 m/sec, the two GFRP showed significantly different force-deflection curves. For GFRP specimens 1 and 2, a non-recoverable slope change occurred at a load level around 1.2-1.8 kN. A similar change in slope is also visible in graphite-based GFRP specimens G1 and G1, but at a lower load level of around 1.2–1.4 kN. The non-recoverable change of slope in the load-deflection curves has been suggested by Hirai et al. [17] to represent the incipient damage under impact. They also found the load for the incipient damage to be independent of the impact energy level, and believed that this is a consequence of matrix cracking near the back surface of the specimen. The same point, but on the load-time curve, was identified by Davallo et al. [18] who suggested that the point represents the on-set of delamination, initiated from the matrix cracking. Specim ens hav e been examin ed aft er t he i mp act t est wi th th e aim of es t ablis hi ng a correl ati on between the test conditions and the plate damage. For comparison, images of the damaged specimens are given in Fig. 11. Damage extent at both front (impacted) and back side of the 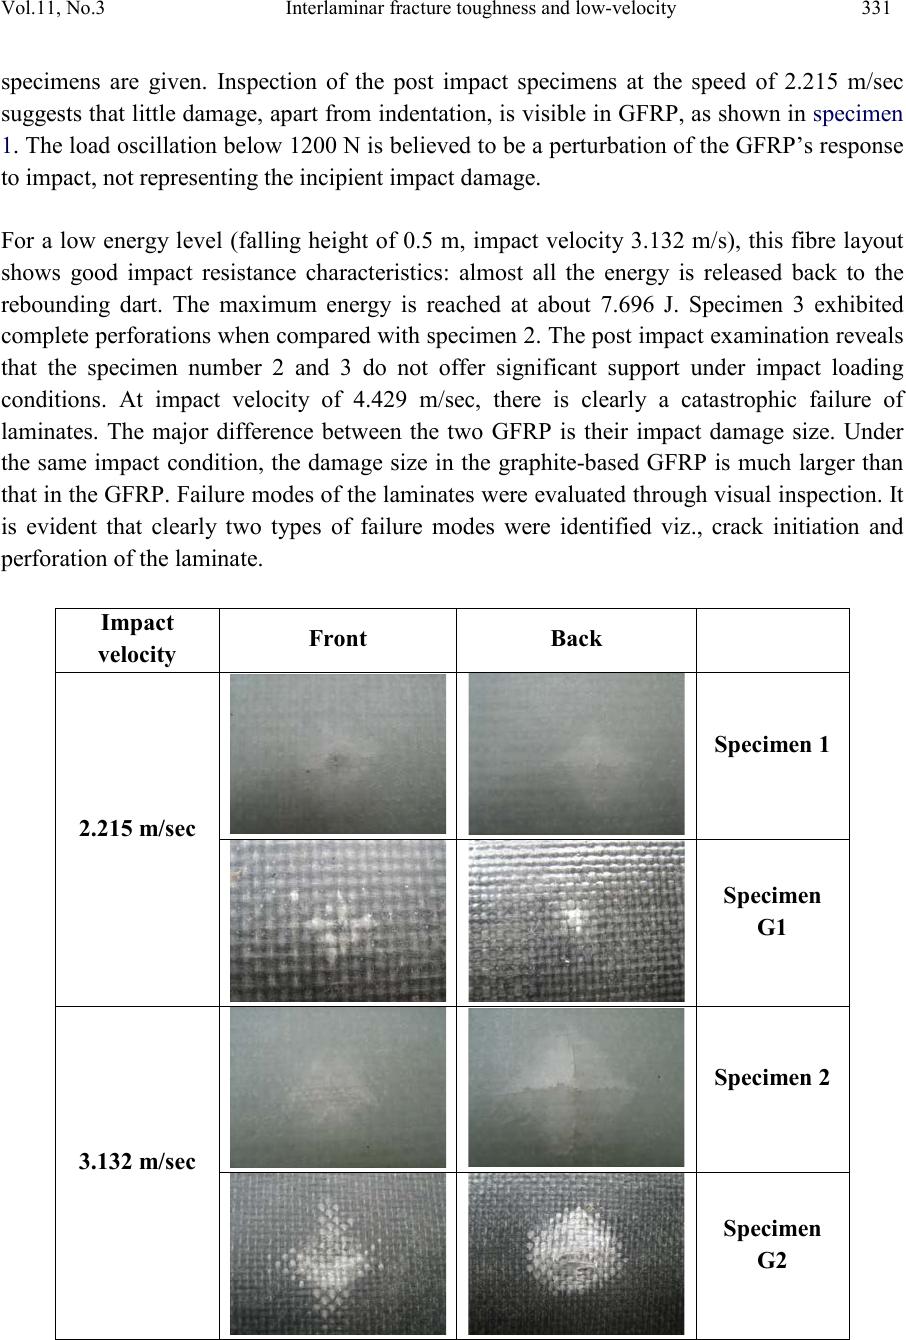 Vol.11, No .3 Interlaminar fracture toughness and low-velocity 331 specimens are given. Inspection of the post impact specimens at the speed of 2.215 m/sec suggests that little damage, apart from indentation, is visible in GFRP, as shown in specimen 1. The load oscillation below 1200 N is b elieved to be a perturbation of the GFRP’s response to impact, not representing the incipient impact damage. For a low energy level (falling height of 0.5 m, impact velocity 3.132 m/s), this fibre layout shows good impact resistance characteristics: almost all the energy is released back to the rebounding dart. The maximum energy is reached at about 7.696 J. Specimen 3 exhibited complete perforations when compared with specimen 2. The post impact examination reveals that the specimen number 2 and 3 do not offer significant support under impact loading conditions. At impact velocity of 4.429 m/sec, there is clearly a catastrophic failure of laminates. The major difference between the two GFRP is their impact damage size. Under the same impact condition, the damage size in the graphite-based GFRP is much larger than that in the GFRP. Failure modes of the laminates were evaluated through visual inspection. It is evident that clearly two types of failure modes were identified viz., crack initiation and perforation of the laminate. velocit y Front Back 2.215 m/sec Specimen 1 Specimen G1 3.132 m/sec Specimen 2 Specimen G2 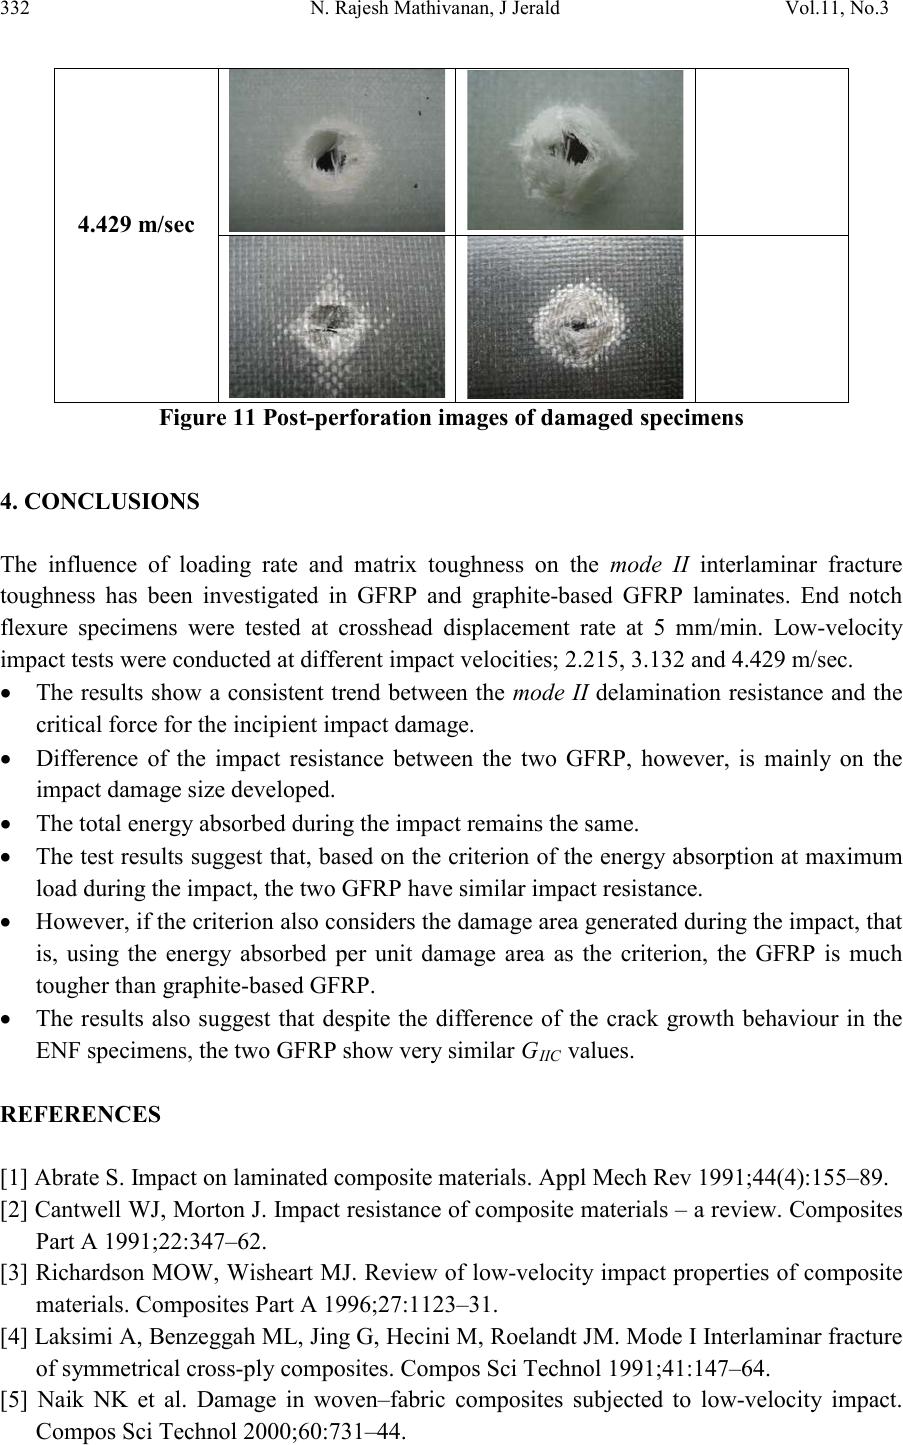 332 N. Rajesh Mathivanan, J Jerald Vol.11, No.3 4.429 m/sec Figure 11 Post-perforation images of damaged specimens 4. CONCLUSIO NS The influence of loading rate and matrix toughness on the mode II interlaminar fracture toughness has been investigated in GFRP and graphite-based GFRP laminates. End notch flexure specimens were tested at crosshead displacement rate at 5 mm/min. Low-velocity impact tests were conducted at different impact velocities; 2.215, 3.132 and 4.429 m/sec. • The results show a consistent trend between the mode II delamination resistance and the critical force for the incipient impact damage. • Difference of the impact resistance between the two GFRP, however, is mainly on the impact damage size developed. • The total energy absorbed during the impact remains the same. • The test results suggest that, based on the criterion of the energy absorption at maximum load during the impact, the two GFRP have similar impact resistance. • However, if the criterion also considers the damage area generated during the impact, that is, using the energy absorbed per unit damage area as the criterion, the GFRP is much tougher than graphite-based GFRP. • The results also suggest that despite the difference of the crack growth behaviour in the ENF specimens, the two GFRP show very similar GIIC values. REFERENCES [1] Abrate S. Impact on laminated composite materials. Appl Mech Rev 1991;44(4):155–89. [2] Cantwell WJ, Morton J. Impact resistance of composite materials – a r eview. Composites Part A 1991;22:347–62. [3] Richardson MOW, Wisheart MJ. Review of low-velocity impact properties of composite materials. Composites Part A 1996;27:1123–31. [4] Laksimi A, Benzeggah ML, Jing G, Hecini M, Roelandt J M. Mode I Interlaminar fracture of symmetrical cross-ply composites. Compos Sci Technol 1991;41:147–64. [5] Naik NK et al. Damage in woven–fabric composites subjected to low-velocity impact. Compos Sci Technol 2000;60:731–44.  Vol.11, No .3 Interlaminar fracture toughness and low-velocity 333 [6] Rajesh Mathivanan N, Jerald J. Experimental investigation of low-velocity impact characteristics of woven glass fib re epoxy matrix composite laminates of EP3 grade. Mater Design 2010;31(9):4553-60. [7] Zhang ZY, Richardson MOW. Low velocity impact induced damage evaluation and its effect on the residual flexural properties of pultruded GRP composites. Compos Struct 2007;81:195–201. [8] Choi HY, Chang F-K. A model for predicting damage in graphite/epoxy laminated composites resulting from low velocity point impact. J Compos Mater 1992;26:2134–69. [9] Razi H, Kobayashi AS. Delamination in cross-pl y laminated composite subjected to low- velocity impact. AIAA Journal 1993;31(8):1498–502. [10] Sun CT, Manoharan MG. Growth of delamination cracks due to bending in a [905/05/905] laminate. Compos Sci Technol 1989;34:365–77. [11] Compston P, J ar P-YB, Burchill PJ, Takahashi K. The effect of matrix toughness and loading rate on the mode II interlaminar fracture toughness of glass-fibre/vinyl-ester composites. Compos Sci Technol 2001;61:321–33. [12] Jar P-YB, Gros XE, Takahashi K, Kawabata K, Murai J, Shinagawa Y. Evaluation of delamination resistance of glass fibre reinforced pol ymers under impact loading. J Adv Mater 2000;32(3):35–45 [13] Kuboki T, Jar P-YB, For est TW. Influence of interlaminar fracture toughness on impact resistance of glass fibre reinforced polymers. Compos Sci Technol 2003;63:943–53. [14] Davies P, Sims GD, Blackman BRK, Brunner AJ, Kageyama K, Hojo M, et al. Comparison of test configuration for determination of mode II interlaminar fracture toughness results from international collaborative test programme. Plast Rub Compos 1999;28(9):432–7. [15] Protocols for interlaminar fracture testing of composites. Delft (The Netherlands): European Structural Integrity Society (ESIS); 1993 [16] Carlsson LA, Gillespie JW. Mode II interlaminar fracture of composites. In: Friedrich K, editor. Application of fracture mechanics to composite materials. Amsterdam: Elsevier; 1989;113–57. [17] Hirai Y, Hamada H, Kim J-K. Impact response of woven glass fabric composites—I. Effect of fibre surface treatment. Compos Sci Technol 1998;58:91–104. [18] Davallo M, Clemens ML, Taylor H, Wilkinson AN. Low energy impact behaviour of polyester-glass composites formed by resin transfer moulding. Plast Rub Compos Proc Appl 1998;27(8):384–91.
|