Paper Menu >>
Journal Menu >>
 Journal of Minerals & Materials Characterization & Engineering, Vol. 11, No.3, pp. 221-242, 2012 jmmce.org Printed i n the USA. All rights reserved 221 Revisiting Sphere Unf olding Relat ionships for the Stereological Analysis of Segmented Digital M icr ost ru ct ur e Im ages E. J. Payton* Institute for Materials, Ruhr-Universität Bochum, 44780 Bochum, Germany *Corresponding author: eric.payton@rub.de ABSTRACT Sphere unfolding relationships are revisited with a specific focus on the analysis of segmented digital images of microstructures. Since the features of such images are most easily quantified by counting pixels, the required equations are re-derived in terms of the histogram of areas (instead of diameters or radii) as inputs and it is shown that a substitution can be made that simplifies the calculation. A practical method is presented for utilizing negative number fraction bins (which sometimes arise from erroneous assumptions and/or insufficient numbers of observations) for the creation of error bars. The complete algorithm can be implemented in a spreadsheet. The derived unfolding equations are explored using both linear and logarithmic binning schemes, and the pros and cons of both binning schemes are illustrated using simulated data. The effects of the binning schemes on the stereological results are demonstrated and discussed with reference to their consequences for practical materials characterization situations, allowing for the suggestion of guidelines for proper application of this, and other, distribution-free stereological methods. Keywords: stereology; image analysis; microstructure; electron microscopy; optical microscopy 1. INTRODUCTION As digital imaging has become standard practice in metallography, so has the use of digital imaging and image processing techniques for materials characterization. There are numerous widely-available softwar e pack ages (b oth comm ercial and freewa re) th at a llo w for enhan cemen t, segmentation, and measurement of image features . These software packages enable a ver y large  222 E. J. Payt on Vol.11, No.3 number of observations to be collected in a fraction of the time that would be required to produce the same results manually. Many phys ics-based models of microstructural evolution require 3D particle sizes as input [1-5]. While 3D serial sectioning methods exist and are becoming more accessible with focused ion beam instruments, observations in planar cross-section remain the most efficient method of micros tru ctu ral chara cter i z at io n for pract ical re asons . Th us , t he 3D part icl e si z e distribution must be stereologically calculated from the 2D observation. In light of recent and continued interest in computer-based segmentation of microstructural images [6-10] and the ongoing need for dat a for the development, calibration, and improvement of microstructural models [5,11,12], it seems appropriate to revisit some remaining issues with the common distribution-free stereological method for ‘unfolding’ the 3D particle size distribution of a population of spheres from the observation of their 2D cross-sections, as it would be of practical benefit to those materials scientists who are using automated image processing techniques and those who are unfamiliar with this procedure. While lineal intercept techniques are often most convenient for quantifying features manually, the observation of features on a digital ima ge is equivalent to a s ystematic point count [13]. The standard solution for converting the 2D observations to 3D data, which is well-chronicled in classical metallurgical stereology texts [14,15], involves the assumption of non-interacting spherical particles observed in perfectly planar cross-section, in which the plane of polish may intersect the particle at any point in that particle’s body, producing a range of possible cross- section sizes. For any shape more complex than either an elongated or flattened spheroid with bivariate axes, there is no analytical solution to the stereological problem without imposing additional assumptions, such as the requirement of a specific size distribution of particles [16-18]. Since particle shapes in materials are neither necessarily uniform nor is the size distribution usually known, the assumption of spherical particles (or at least globally-convex particles which have the average shape of a sphere in rotation) remains common in materials science (e.g., [5,19-21]). In the present work, the unfolding relationship for spheres is re-derived in ter ms of the histogram of observation areas as inputs (rather than radii or diameters) and a practical method is presented for utilizing the un-ph ysical results that propagate during the calculation for the creation of erro r bars. The derived algorithms can be easily programmed into a spreadsheet for rapid implementation, and are useful in situations where it is desirable to be able to examine the error that is introduced by the histogramming procedure. The errors associated with histogramming both on linear and logarithmic scales are then explored to shed light on the number of observations that should be made for best practice in application of the stereological method.  Vol.11, No .3 Revisiting Sphere U nfolding Relationships 223 2. STEREOLOGY OF PLANAR OBSERVATIONS IN TERMS OF AREAS The dist ributions of possible cross-section sizes as well as the intrinsic size distribution of the 3D particles in the material both contribute to the distribution of experimentally-observed cross- section sizes. The central stereological problem is the deconvolution of these distributions. The classical approach involves first assuming that the size class (in the histogram of experi ment all y- observed cross-section sizes) that corresponds to the largest experimentally-observed cross- section is generated by the intersection of a plane with the middle of the largest 3D particle in the system, producing the largest possible cross-section for that particle size. Then, by assuming spherical particles, the distribution of the sizes of the other possible cross-sections through that particle is predi cted. Using the number frequency of this largest-particle size class, the distribution of cross-sections that should come from an array of uniform spheres of this size is then subtracted from the histogram of 2D cross-sections. To calculate a likely 3D distribution of particle sizes, this process is repeated for each bin in the histogram, going from the bins corresponding to the largest particles to those corresponding to the smallest, “stripping” away the part of the histogram that comes from the largest-particle size class that still has a non-zero number fraction, and “unfolding” the 3D particle size distribution. The assumptions described above are most reasonable when the number of measurements is large and there are a large number of bins, two interrelated values when it comes to producing a smoothly-varying histogram. Due to imaging biases, sampling statistics, and other practical problems, the classical approach described above often results in bins with negative number fractions. The problem can be solved numerically in a way that prevents these artifacts from occurring by, for example, using the expectation -maximization (EM) algorithm [22]; however, this approach does not necessarily produce a unique solution [23] and is not easily programmed into a spreadsheet. In addition to being easier to implement, the classical approach also retains a benefit in that error bars can be calculated from the artifacts. The error bars can in turn be used to gauge the quality of the histogramming procedure, as will be demonstrated in the present paper. The results of more adva nced numerical methods such as the EM algorithm are still affected b y the quality of the histogram of the initial data because the binning itself introduces systematic errors in to the stereol ogical resu lts. While it m ust be noted that there are also advanced methods that can b e applied to the histogramming procedure, it remains of general interest to have rules- of-thumb for the numbers of observations, numbers of bins, and the scaling of the bins that should be used to produce a histogram that accurately represents the underlying distribution. Due to the fact that feature size distributions are not necessarily normal or lognormal, “Scott’s rule” [24] may not necessarily apply. These issues will be addressed in the latter part of this paper using a simulation-based approach.  224 E. J. Payt on Vol.11, No.3 The historical development of the classical unfolding method was recorded by Underwood [14,15], and the most useful derivations were contributed by Saltikov [14,15,25]. A primary difference between several of the derivations is whether they use a linear binning scheme, as one typically uses for making a histogram of measurement results, or a logarithmic binning scheme, in which the width of the bins increases logarithmically as the particle size represented by the bin increases, such that there is a higher density of bins corresponding to smaller particles. The logarithmic binning scheme is useful in many materials characterization applications due to sampling statistics, since fewer observations are often made of the largest particl e siz es. Both methods require a fixed number of bins (co rresp ondin g t o siz e class es) in the histogram for performing the calculation due to the usage of either look-up tables or a fixed equation. The Johnson-Saltikov working table [15], for example, assumes that the relative area occupied by cross-sections of each size class is constant relative to the maximum possible cross- sectio n size cl ass, i.e. for 30 bins on a logarithmic (base 10) scale, t he perc entage of sections per area occupied by the bin containing the largest areal cross sections is always 60.749%, the next smaller bin is 16.833%, followed by 8.952%, and so on. In each step of the stripping of the cross-section histogram to produce the 3D histogram, the working table becomes more inaccurate because the percentages no longer sum to 100%. It is no l onger necessar y to us e a working tabl e with fix ed section percentages be cause the en tire histogram stripping process may be performed rapidly, for any number of bins, with simple computer programs (see, for example, Heilbronner's StripStar code [26,27]). Furthermore, usage of fix ed percentages can add to errors cau sed by th e biases of the i maging and image proces sing techniques. It is therefore useful to develop relations that can be used universally for any number of bins, with any scaling of the bin size axis, and with any functional form of imaging bias (a topic that has been explored in greater detail by the present author in a separate paper [20]). Figure 1: Geometry of intersection of a sphere of radius R and planes, producing circular cross-sections of radius r separated by a distance h . 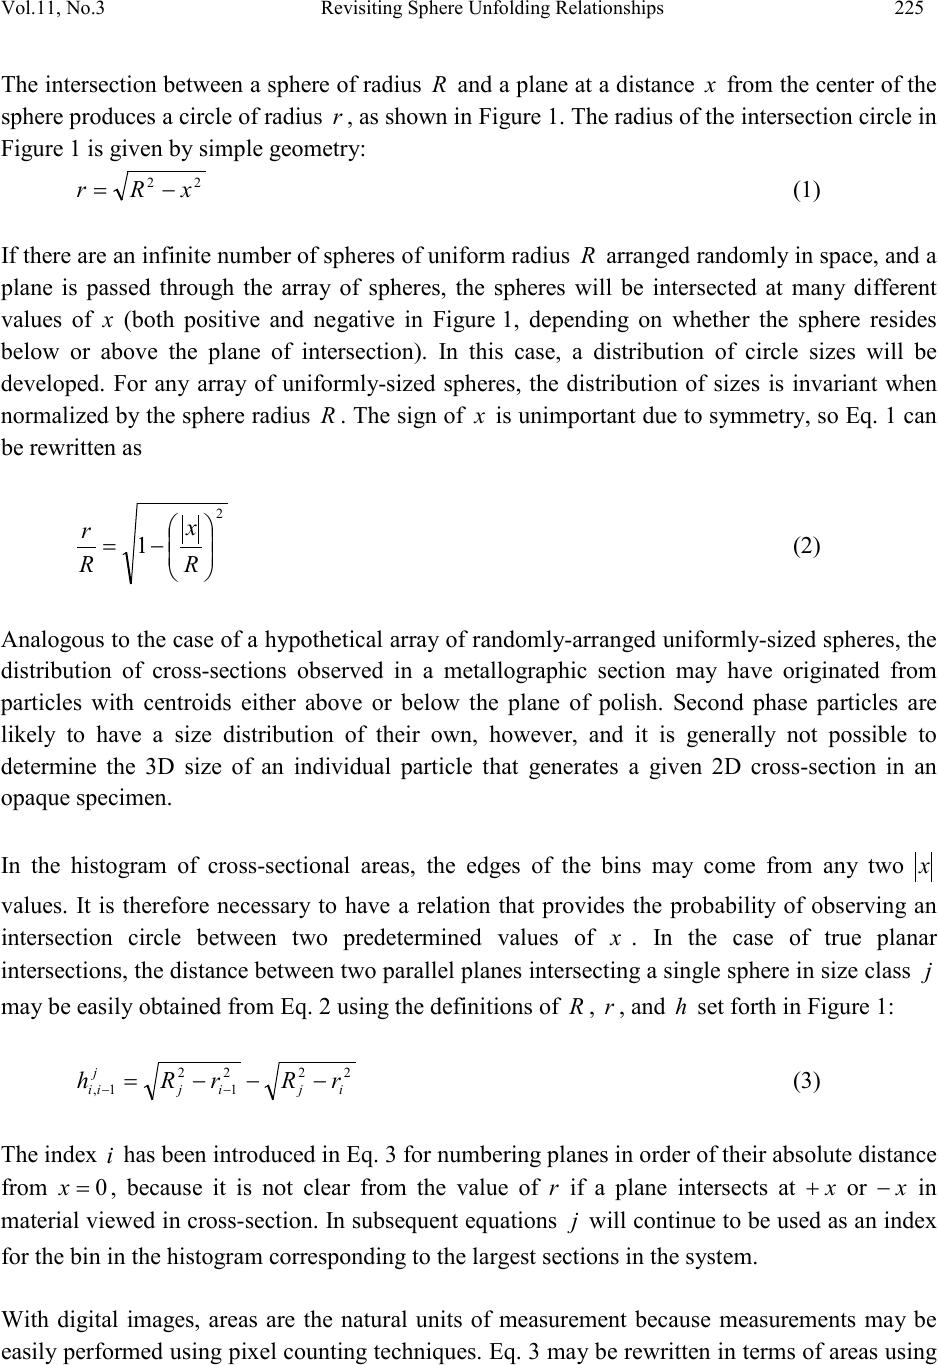 Vol.11, No .3 Revisiting Sphere U nfolding Relationships 225 The in tersectio n between a sphere of radi us R and a plan e at a distan ce x from the center of the sphere produces a circle of radius r , as shown in Figure 1. The radius of the intersection circle in Figure 1 is given by simple geometry: 22 xRr −= (1) If there are an infinite number of spheres of uniform radius R arran ged rand o m l y in sp ac e, and a plane is passed through the array of spheres, the spheres will be intersected at many different values of x (both positive and negative in Figure 1, depending on whether the sphere resides below or above the plane of intersection). In this case, a distribution of circle sizes will be developed. For any array of uniformly-sized spheres, the distribution of sizes is invariant when normalized by the sphere radius R . The sign of x is unimportant due to symmetry, so Eq. 1 can be rewritten as 2 1 −= R x R r (2) Analogous to the case of a hypothetical array of randomly-arranged uniformly-sized spheres, the distribution of cross-sections observed in a metallographic section may have originated from particles with centroids either above or below the plane of polish. Second phase particles are likely to have a size distribution of their own, however, and it is generally not possible to determine the 3D size of an individual particle that generates a given 2D cross-section in an opaque specimen. In the histogram of cross-sectional areas, the edges of the bins may come from any two x values. It is therefore necessary to have a relation that provides the probability of observing an intersection circle between two predetermined values of x . In the case of true planar inters ecti on s, th e di st ance bet ween two pa ral l el p lan es i nt ersect ing a sin gle s ph ere in si z e cl ass j may be easily obtained from Eq. 2 using the definitions of R , r , and h set forth in Figure 1: 2221 2 1, ijij jii rRrRh −−−= −− (3) The index i has been introduced in Eq. 3 for numbering planes in order of their absolute distance from 0=x , because it is not clear from the value of r if a plane intersects at x+ or x− in material viewed in cross-section. In subsequent equations j will continue to be used as an index for the bin in the histogram corresponding to the largest sections in the system. With digital images, areas are the natural units of measurement because measurements may be easily performed using pix el counting techniques. Eq. 3 ma y be rewritten in terms of areas using  226 E. J. Payt on Vol.11, No.3 2 jj RA π = and 2 i j i ra π = , wher e j A corresponds to the maximum intersection area of a sphere of size R j (which occurs at 0=x in Figure 1), and j i a is the area of the circle created by the intersection of plane i and the sphere of size class j : ( ) ijij jii aAaAh −−−= −− 11, 1 π (4) The probability p of intercepting a sphere of radius R within the interval h is given by Rh . Again using the equation for the area of a circle, it is found that ( ) ijij j jii aAaA A p−−−= −− 11, 1 (5) In the correction of imaging biases (which may arise, for example, when using backscatter imaging since the signal comes from an ill-defined volume within the specimen), a transfer function between the correct cross-section a and the observed cross-section a′ can be inserted into Eq. 5 to obtain the bias-corrected probability of intersection [4,20]. The mean area of the cross sections between j i a 1− and j i a , assuming uniform probability of inters ecting at an y height x , is given by dividing the v olume of a sli ce of a sphere b y th e height h of the sl ice, i.e. jii j ii jii hVa 1,1,1, −−− = . Th e volume of a sl ice of a sphere in terms of section areas is [28]: () ( ) ++= − − − − 32 2 1, 1 1, 1, jii j i j i jii j ii h aa h V π (6) The area taken up by each size group is generally given as the product of the average area and the probability of intersection, jii jii pa 1,1, −− ; however, we note that j j ii j jii jii j ii jii jii R V R h h V pa 1,1, 1, 1, 1,1, −− − − −− =⋅= which allows us to write  Vol.11, No .3 Revisiting Sphere U nfolding Relationships 227 () ( ) ++== − − −− −− 3 2 2 1, 1 1,1, 1,1, jii j i j i j jii j j ii jii jii h aa A h R V pa ππ (7) Now, substituting the definition j jii jii Rhp 1,1, −− = into Eq. 7, we find that jii jii pa 1,1,−− can be writ ten more simply as: ( ) ( ) ++= − − − −− 32 2 1, 1 1, 1,1, jiij j i j i jii jii jii pA a a p pa (8) The above substitution allows for jii jii pa 1,1, −− to be obtained in only two calculation steps, using Eqs. 5 & 8. The fraction of sections per unit area with cross-sectional areas between j i a1− and j i a that come from an array of particles of size class j , ( ) j ii A N1, − , may now be obtained using ( ) ∑ −− −− − = j i jii jii jii jii j ii A pa pa N 1,1, 1,1, 1, (9) The value of the fraction in the 3D distribution for the bin j is given by ( ) j jj A j D j DN f f 1, 2 3 − = (10) where j D f 2 is the result of stripping away the influence of all bins greater than j from the area- weighted histogram of observations, j A f . For all values ji < , j D f2 is obtained by stripping the distribution of cross-sections coming from j D f 3 (Eq. 10) from the 2D distribution: ( ) ∑ += − −= k ji j ii A iD j A j DNfff 11, 32 (11) where j A f corresponds to the histogram of measured area fractions per feature size group. This process is performed for all j starting from the bin corresponding to the largest particles remaining in the histogram. The volume-weighted fractions can be converted to the number of particles per unit volume by dividing each bin by the volume of the particles represented therein,  228 E. J. Payt on Vol.11, No.3 and can be converted to number fractions by dividing the number of particles per unit volume by their sum. 3. ERROR IN 3D PARTICLE SIZE DISTRIBUTION CALCULATION The histogram stripping process often produces negative bin values in the 3D distribution. Negative number fractions do not have any physical meaning, and can only be produced by errors in either the measurement process or poor assumptions in the 2D → 3D conversion calculation. Th e errors are propagated throu gh the calculation. Previ ous r es earchers have tra cked the negative bin values that are propagated during the histogram subtraction [26,27], but to the present author’s knowledge, a meaningful usage of the resultant negative values has not been provided in the literature for practical application by researchers continuing to use the classical unfolding methods. The best choice for dealing with the negative volume fractions is not immediately obvious. If the negative frequencies are simply discarded, the volume fraction resulting from the stereological calculation will not be equal to that of the measured area fraction. Thus, the histogram must be re-normalized after the stereological calculation; however, without error bars, the effect of the normalization on the final result will remain unclear and potentially misleading. Despite problems associated with the spherical assumption (which will be discussed later), the sphere-based methods remain in frequent use because of their relative simplicity, so it would be useful to exploit the un-physical values in the production of error bars. If it is assumed that the error producing the negative-frequency bin could come from any single bin corresponding to larger particles than those contained in the bin with a negative number fraction, then the required change in the number fraction of any bin k to produce a negative frequency at bin j may be calculated (assuming that all of the error is concentrated at bin k ) using: ( ) k jj A j D k jN f 1, 2 − = ε (12) where k j ε is the change at bin k required to return the frequency at bin j to the physically- reasonable value of zero. It must be noted that k j ε as calculated by Eq. 12 may exceed k D f3; in this case, w e s et k D k j f 3 −= ε . It should be noted at this point that k j ε can be converted into volume fractions, number fractions, or particles per unit area similar to j D f3 from Eq. 10. We may provide the sample standard deviation of the possible physically-reasonable values of k D f3 that do not produce negative frequencies at an y bins by summing the k j ε matrix values over  Vol.11, No .3 Revisiting Sphere U nfolding Relationships 229 their index k for each bin j , dividing by the number of bins that could contribute to the error for that bin, and taking the square roots: ( ) ∑ > =k ji k ij j s2 1 ε (13) because k j ε is the difference between the expected value and the required value for a nonnegative result at j . It is not known which bins k contribute to the erroneous result at j . Realistically, there is a correlation between the errors because they propagate during the calculation from bins corresponding to coarser particle sizes toward bins corresponding to finer particle sizes; however, for many practical applications, it is probably sufficient to simply provide descriptive error bars such that the reader can gauge the error introduced during the process. If it is assumed that all bins jk > have an equal probability of producing the error at j , then the standard error of these values is then given by j s SE j j = (14) This standard error value may be used to estimate a lower bound to the error produced during the stereological unfolding procedure. 4. ILLUSTRATION OF RESULTS The derivation presented in the previous section can be programmed efficiently in either a spreadsheet or in modern computer languages in a few lines, as illustrated by the matlab/octave source code provided in the appendix. After the 3D conversion, the x-ax is may be rescal ed from areas to diameters. The mean spherical-equivalent particle diameter is then estimated as ∑ = j j D dfd 3 . The method derived in the previous section takes as input the area fraction of particles of a given size class. In the case of 100% volume fraction, as in a grain size distribution, the sum of the number fractions or volume fractions should be unit y. In the case of a distribution of particles, the initial area fraction should be used. When corrections for observation biases are not used, then the area fraction at the beginning of the calculation is identical to the volume fraction after the stereological calculation. The number fraction of particles per size class in the initial state may be obtained by dividing the area fraction t aken up b y particles of the given siz e class by the area represented by that bin, then normalizing such that the sum of the number fractions is unity.  230 E. J. Payt on Vol.11, No.3 To illustrate the results of the above-described procedure, the lognormal distribution was randomly sampled to simulate a hypothetical distribution of sphere cross-sectional areas. The number of samples, the shape parameter σ of the distribution, and the number of bins were varied while holding the mean particle size constant. The lognormal distribution was chosen because it is observed over a large range of materials that particle size cross-sections are often approximately lognormally distributed. It is probably worth noting at this point that the minimum bin size must not correspond to particles below the resolution limit of the imaging technique; otherwise, excessively large error bars will be computed by the method proposed in the previous section. Also, the choice of binning scale is extremely important: A sufficient number of bins must be chosen such that the average s iz e r etu rn ed by the hi st ogr am i s as clo se as po ss ib le t o t he m ean of the co ll e ct ed dat a. If an excessive number of bins is chosen, then the fluctuations in the bin height will increase the uncertainty in the stereologically-calculated result. Figure 2 shows the standard deviation of the mean particle size represented by a linearly-binned histogram (a) and a logarithmically-binned histogram (b), as determined by 5000 simulations of particle size observations with a mean particle diameter of 1.2 microns and a lognormal shape parameter σ of 0.5. Isocontour lines of constant standard deviation regions are shown, wi th the number of bins plott ed on the x-ax is an d (a) (b) Figure 2: The standard deviation of the apparent population mean resulting from histogram binning, for 5000 simulations of particle size measurements given by randomly sampling a lognormal distribution with a mean particle diameter of 1.2 microns and a lognormal shape parameter of 0.5: (a) Linear binning; (b) Logarithmic binning. Linear binning produces the most accurate results for low numbers of observations for this value of sigma, but the difference between logarithmic and linear binning decreases significantly as the number of observations increases.  Vol.11, No .3 Revisiting Sphere U nfolding Relationships 231 the number of observations plotted on the y-axis. From the comparison of Figures 2 (a) and (b), it is clear that linear binning produces more accurate results for low numbers of observations, but the difference between logarithmic and linear binning decreases significantly as the number of observations exceeds 500. Figure 3 shows the variation in the standard deviation of the mean particle size with the shape parameter σ of a lognormal distribution (with a mean value of 1.2 microns) represented by a linearly-binned histogram (a) and a logarithmically-binned histogram (b). For each standard deviation, 5000 simulations of 500 particle size observations with a mean particle diameter of 1.2 microns were performed. Isocontour lines of constant st andard deviation re gions are shown, with the number of bins plotted on the x-axis and the shape parameter of the distribution plotted on the y-axis. Comparing Figures 3 (a) and (b), it is seen that logarithmic binning generally provides better performance for more skewed distributions. Linear binning is only better when the number of bins is large and the shape parameter is small. On initial examination of Figures 2 and 3, it appears that linear binning offers some distinct benefits. For example, the mean particle size is more easily accurately reproduced for fewer observations, as shown in Figure 2. A tradeoff exists, however, because a smoothly-varying distribution is better for the purposes of our stereological calculation since it reduces the (a) (b) Figure 3: The standard deviation of the apparent population mean resulting from histogram binning, for 5000 simulations of particle size measurements given by 500 random samples of a lognormal distribution with a mean particle diameter of 1.2 microns: (a) Linear binning; (b) Logarithmic binning. Logarithmic binning generally provides better performance at this number of observations except when the number of bins is large and the shape parameter is small.  232 E. J. Payt on Vol.11, No.3 likelihood of the negative number fraction artifacts. The production of a smoothly-varying histogram is explored in Figures 4 and 5, in whic h a given number of observations are randomly sampl ed from a lognormal distribution of known parameters under different binning schemes to determine the deviation of the histograms from the known shape of the distributions. The smoothness of the histograms was quantified using the mean absolute value of the deviation of each bin height from the expected height of that b in (i.e., the height that would be observed if an infinite number of measurements were made on a particle population of the given size distribution). S o that t he deviat ion valu es for th e cases with different numbers of bins would fall in comparable ranges, the distributions in all cases were normalized by the maximum height of the smooth distribution of the same number of bins. Simulations were performed for distributions with lognormal shape parameters ranging from 0.2 to 1.4, 6 to 36 bins on both linear and logarithmic scales, and between 50 and 3000 observed particles. The mean diameter of the simulated particles was 1.2 microns in all cases. The presented values are the mean v alues from 5000 repeated simulations. (a) (b) Figure 4: Smoothness of histograms with mean particle size of 1.2 microns, as characterized by the 5000 repeat measurements of the deviation of the observed number fractions from the expected number fractions for the input distribution: (a) Linear binning, 500 observed particles; (b) Logarithmic binning, 500 observed particles. It can be seen that lognormal binning provides more consistent smoothness over a wider range of shape parameter values.  Vol.11, No .3 Revisiting Sphere U nfolding Relationships 233 Figures 4 (a) and (b) contain the results for the binning of the simulated observations of 500 particles of various lognormal distribution shapes in the linear and logarithmic binning cases, respectively. The plots show isocontour lines of constant smoothness of the histograms; low (a) (b) (c) (d) Figure 5: Smoothness of histograms of lognormal distributions with a mean particle diameter of 1.2 microns, as characterized by the 5000 repeat measurements of the deviation of the observed number fractions from the expected number fractions for the input distribution: (a) Linear binning, σ=0.2; (b) Logarithmic binning, σ=0.2; (c) Linear binning, σ=1.4; (d) Logarithmic binning, σ=1.4. While the performance of linear and lognormal binning are comparable at low values of the shape parameter, the relative performance of lognormal binning improves relative to linear binning as the skew of the distribution increases.  234 E. J. Payt on Vol.11, No.3 values represent smaller deviations from the expected values, and thus a more accurate reproduction of the actual distribution shape. The variation in the lognormal shape parameter is given on the y-axis; the differing numbers of bins used in the binning procedure are given on the x-axis. While large numbers of bins improve the reproduction of the mean particle size of the population (Figures 2 and 3), it is shown in both subfigures of Figure 4 that increasing the number of bins reduces the smoothness of the distributions for a given distribution shape – which will, in turn, increase the errors propagated through the stereological procedure. In Figure 4, it can be observed that logarithmic binning (of a lognormal distribution of observation sizes) provides more consistent smoothness over a wider range of shape parameter values than linear binning, with much improved performance at higher numbers of observations. Figures 5 (a) and (b) contain the results for binning different numbers of observed particles over different numbers of bins, for linear and logarithmic binning schemes, respectively, of a distribution with a shape parameter of 0.2; Figures 5 (c) and (d) show the results corresponding to a shap e p aram eter of 1. 4. The plots again show isocontour lines of constant smoothness of t he histograms, using the same procedure for quantifying the smoothness as was used in Figure 4. The number of particles observed is plotted on the y-axis and the number of bins used is plotted on the x-axis. All subfigures of Figure 5 show that increasing the number of bins (which was observed to improve the reproduction of the mean particle size in Figures 2 and 3) generally reduces the histogram smoothness fo r a given number of observations. As would be expected, the smoothness improves as the number of observations is increased. Increasing the number of simulated measurements (to something more than the 5000 used here) could be expected to further smoothen the variations in the isocontours such that the sm oothness at a constant number of observations continually degrades with increasing numbers of bins (the jaggedness is particularly notable in Figure 5 (b)); however, the trend is more than sufficiently clear in the present results. Figures 5 (a) and (b) show that the performance of linear and logarithmic binnin g is comparable for narrow particle size distributions, while Figures 5 (c) and (d) illustrate that the performance of logarithmic binning is superior to that of linear binning when the particle size distribution is highly skewed. Lognormal binning provides more consistent smoothness over a wider range of shape parameter values, with consistently improving smoothness as the number of observations increases, as seen by comparison of Figures 5 (b) and (d). The errors produced in the binning process are propagated to the stereology. Figure 6 shows the results of binning with 12 and 36 bins on linear and logarithmic scales for 800 observations simulated by random sampling of a lognormal distribution with a mean of 1.2 microns and a shape parameter of 0.8. The set of observations produced a mean cross-sectional diameter of 1.23 m icrons. When too few linear bins are used, as in Figure 6 (a), the details of the distribution are lost. A larger number of bins are required to more accurately represent the distribution under a linear binning scheme, as shown in Figure 6 (b). The excess bins on the coarse side of the distribution result in strong fluctuations in number fractions on this side of the distribution. A  Vol.11, No .3 Revisiting Sphere U nfolding Relationships 235 reasonable number of bins in the linear scheme is often excessive under a logarithmic binning scheme, as s een b y comparison of Figures 6 (b) an d (d). As suggested b y the results of Fi gures 2 through 5, the most appropriate binning scheme for this particular set of particles – at least in terms of producing a smooth variation of number fractions and accurate reproduction of the shape of the distribution – is logarithmic binning with a moderate number of bins, such as Figure 6 (c). (a) (b) (c) (d) Figure 6: Illustration of the stereological results of varying the number of bins for 800 simulated observations obtained from randomly sampling a logarithmic distribution with a shape parameter of σ=0.8: (a) 12 linear bins; (b) 36 linear bins; (c) 12 logarithmic bins; (d) 36 logarithmic bins.  236 E. J. Payt on Vol.11, No.3 (a) (b) Figure 7: The distribution of 2D cross-sections observed from a 3D population of spheres with a mean diameter of 1.2 microns and (a) a shape parameter of σ=0.2; (b) a shape parameter of σ=1.4. In practice, observations of cross-sections of spheres may be easily mistaken for lognormal distributions, although a lognormal distribution of cross-sections cannot be produced by a lognormal distribution of spheres due to the probabilities at the fine side of the distribution. Interestingly, the logarithmic binning scheme in Figure 6 (c) produces some of the largest error bars. One reason for this is that the error bar scheme proposed here favors linear binning: The error bars cannot exceed the height of an individual bin, and the strong fluctuations in bin height are concentrated at the long tail (on the right-hand side) in the linear binning scheme. There exis ts another reason fo r the relati vely large error bars in Figure 6 (c): They ar e actuall y, in part, due to the more appropriate reproduction of the distribution shape. In fa ct, Figure 6 (c) partially illustrates that a truly lognormal distribution of 2D cross-sections cannot be generated by a lognormal distribution of spheres. To explore this further, consider Figure 7, which shows the 2D cross-sections that should be produced by two lognormal 3D distributions. Figure 7 (a) shows the results for a lognormal distribution of spheres with a mean diameter of 1.2 microns and a shape parameter of 0.2; Figure 7 (b) shows the results for a lognormal distribution of spheres with the same mean size and a shape param eter of 1.4. Bot h plots were created by taking 5E6 s amples of the described lognormal distribution and using 30 bins on a logarithmic scale. If the 3D particle size distribution is lognormal, as is often observed in nature [29], then it is likely that the distribution of cross-sections may also fit quite well to a lognormal distribution, as illustrated by Figure 7 (b). The 2D distribution appears increasingly lognormal as the skew of the distribution increases. It may be clearly seen, however, that a narrow distribution such as that shown in Figure 7 (a) does not produce an approximately lognormal distribution of cross-sections. This observation may shed some light on the ongoing debate in the literature as to the true shape of  Vol.11, No .3 Revisiting Sphere U nfolding Relationships 237 the distributions of grains and particle sizes observed in materials, though further work is required to determine what distribution shape (Rayleigh, Weibull, or Lognormal) matches best to the present 2D results, and whether the 3D distribution is indeed lognormal. Despite the difference in the fine-side tail observed in Figure 7 (a), it is still likely that a distribution with such a shape may still be mistaken for a lognormal distribution in practice, as re al measu remen ts rarely produce a perfectly smooth histogram, and there are other sources of error – such as imaging bias – that can affect the measurement. 5. DISCUSSION It is clear when comparing Figures 6 (a) and (b) with Figures 6 (c) and (d) that logarithmic binning more efficiently reproduces the distribution shape (i.e. uses fewer bins) under the explored circumstances. The most accurate stereological results will be produced using a histogram that simultaneously reproduces the correct mean size of the observed values (Figures 2 and 3) and the details of the shape of the true underlying distribution (Figures 4 and 5). Thus, a tradeoff exists between the number of bins used, the binning scheme, the n umber of observations made, and the quality of the stereological results. The mean values for bot h the input histograms and the stereological results are given in the subfigures of Figure 6. There is significant variation between the resulting 3D stereological means for the input 2D histograms. The true mean of the population and the shape are best reproduced by Figure 6 (c); it must be assumed that this also represents the best stereological result of the four binning options shown in this figure. It comes as no surprise that logarithmic binning of a lognormal distribution of particle size observations produces a more smoothly-varying distribution than linear binning; however, Figures 2 through 5 of the present work should help clarify the situation in which logarithmic binning is beneficial. The results shown in Figures 2 through 5 also emphasize the importance of making a large number of individual particle measurements in stereological practice, as the accurate reproduction of the mean particle size in a histogram depends significantly on the number of measurements made when logarithmic binning is used. Binning on a logarithmic scale is typically useful in metallurgical particle size measurements because it reduces the number of measurements required to produce a smoothly-varying histogram for appro ximat ely-lognormally skewed distributions, as shown in Figures 5 (c) and (d). In practice, producing a smoothly- varying histogram for input into the stereological procedure may be more difficult than is implied in the present cases, which were formed from randomly sampling a lognormal distribution. There are many additional aspects that should be considered when performing the stereology on real particle populations. It is well-known that the variations in the shape of the particles generating the cross-sections can have great consequences on the final results [16-18,30]. The situation often arises, however, that particle shapes vary within a single specimen (such as, for  238 E. J. Payt on Vol.11, No.3 example, Ni-based superalloys exhibiting populations of both secondary and tertiary γ’ phase). In this case, the spherical assumption is not easily avoided, and it becomes much more challenging to produce 3D data for model inputs [22]. A trade-off exists between metallographic efficiency and the ability to obtain accurate results. In terms of providing 3D data for use in physics-based models, many microstructural models for which 3D data is needed also contain the spherical assumption (e.g. [1,4,5,12]). In these situations, a sphere-based unfolding method may be thought of as a necessary first step toward producing the required data, and refinement of both the stereological method and the modeling parameters may be completed at a later stage as necessary for producing realistic simulation results. Ultimately, it is important that metallurgists continuing to use sphere unfolding relationships are aware that the assumption of spherical particles can produce errors in the final results. The calculation of error bars presented in the present paper is inten ded to h elp th e resear cher gau ge the d egree to which the assumptions in the stereological method are weak for the specific set of data under investigation, but it should be noted that the utility of the error bars is dependent upon a reasonable choice of binning parameters for a given set of measured particle cross-sections. 6. SUMMARY AND CONCLUSIONS In light of the rapidly increasing adoption of digital image segmentation methods in metallography, and their potential for use in calibration and future development of physics-based models of microstructure evolution, the sphere unfolding relationship has been re-derived in terms of areas for practical usage by metallographers continuing to use these stereological techniques and for materials scientists who may not be familiar with the technique. A practical method has been presented for usin g the negative frequency bins that som etimes arise during the calculation for the creation of error ba rs, and the method has b een demonstrated using simulated measurements. The effect of binning on the smoothness of histograms for input into the unfolding algorithm has been explored to gauge the errors introduced by the binning process, and the unfolding results have been illustrated for some interesting cases. From the results of the present study, the following conclusions may be drawn: 1. For increas ingly left-skewed particle size distributions, logarithmic binning more accurately reproduces the population mean than linear binning (Figure 3) as long as a sufficient number of observations is made (Figure 2). As a rule of thumb, at least 500 individual particle size measurements should be used for a reasonable probability of accurately reproducin g the mean particle size of a skewed population under a logarithmic binning scheme (Figure 2). 2. Logarithmic binning is often useful in metallurgical particle size measurements due to sampling statistics: Fewer observations tend to be made of the largest cross-sections. Thus, logarithmic binning consistently produces smoothly-varying histograms over a wider range of left-sided distribution skews than linear binning (Figure 4). The smooth ness continuously improves with an increasing number of observations (Figure 5).  Vol.11, No .3 Revisiting Sphere U nfolding Relationships 239 3. Errors in binning are propagated to the stereology. If the binning method is unable to reproduce the correct mean particle size, the error will be passed along to the stereological result (Figure 6). 4. If the 3D particle size distribution that generates the observed cross-sections is approximately lognormal, it is very likely that the distribution of observed cross-sections will likely appear approximately lognormal, even though the cross-section distribution cannot strictly be lognormal (Figure 7). ACKNOWLEDGEMENTS This work was initiated while the author was at The Ohio State University and completed at Ruhr-Universität Bochum. The author wishes to gratefully acknowledge support from GE Aviation for the portion of the work performed at Ohio State and Lehrstuhl Werkstoffwissenschaft (G. Eggeler) for the portion of the work completed at Ruhr-Uni. The author also wishes to express his gratitude to Dr. V. A. Yardley for reading the draft of this paper and providing several helpful suggestions. REFERENCES [1] Abbruzzese G., 1985, “Computer simulated grain growth stagnation.” Acta Metall., Vol. 33, pp. 1329–1337. [2] Dieter, G.E., 1986, Mechanical Metallurgy, 3rd ed., McGraw-Hill Series in Materials Science and Engineering, McGraw-Hill, Boston, MA. [3] Porter, D.A. and Easterling, K. E., 1992, Phase Transformations in Metals and Alloys, 2nd ed., CRC press, Boca Raton, FL. [4] Payton, E.J., 2009, Characterization and Modeling of Grain Coarsening in Powder Metallurgical Nickel-based Superalloys, Ph.D. thesis, The Ohio State University, Columbus, OH. [5] Wang, G., Xu, D.S., Payton, E.J., Ma, N., Yang, R., Mills, M.J., and Wang, Y., 2011, “Mean-field statistical simulation of grain coarsening in the presence of stable and unstable pinning particles.” Acta Mater ., Vol. 59, pp. 4587-4594. [6] Kahn, H., Mano, E.S., and Tassinari, M.M., 2002, “Image analysis coupled with a SEM- EDS applied to the characterization of a Zn-Pb partially weathered ore.” J. Miner. Mat er. Charact. Eng., Vol. 1, pp. 1-9. [7] Gu, Y., 2003, “Automated scanning electron microscope based mineral liberation analysis: An introduction to JKMRC/FEI mineral liberation analyzer.” J. Miner. Mater. Charact. Eng., Vol. 2, pp. 33-41. [8] Hagni, A.M., 2008, “Phase identification, phase quantification, and phase association determinations utilizing automated mineralogy technology.” JOM, Vol. 60, pp. 33-37.  240 E. J. Payt on Vol.11, No.3 [9] Payton, E.J., Phillips, P.J., and Mills, M.J., 2010, “Semi-automated characterization of the gamma prime phase in Ni-based superalloys via high-resolution backscatter imaging.” Mater. Sci. Eng. A, Vol. 527, pp. 2684–2692. [10] Schouwstra, R.P. and Smit, A.J ., 2011, “Developments in mineralogical techniques – What about mineralogists?” Miner. Eng., Vol. 24, pp. 1224-1228. [11] Payton, E.J., Wang, G., Wang, G., Ma, N., Wang, Y., Mills, M.J., Whitis, D.D., Mourer, D.P., and Wei, D., 2008, “Integration of simulations and experiments for modeling superalloy grain growth,” in: Superalloys 2008, pp. 975-985, The Minerals, Metals & Materials Society, Warrendale, PA. [12] Wang, G., Xu, D.S., Ma, N., Zhou, N., Payton, E.J., Yang, R., Mills, M.J., and Wang, Y., 2009, “Simulation study of effects of initial particle size distribution on dissolution.” Acta Mater., Vol. 57, pp. 316-325. [13] Hilliard, J.E. and Cahn, J.W., 1961, “An evaluation of procedures in quantitative metallography for volume-fraction analysis.” Trans. AIME, Vol. 221, pp. 344-352. [14] Underwood, E.E., 1968, “Particle-size Distribution,” in: Quantitative Microscopy, pp. 149– 200, McGraw-Hill Book Company, New York, NY. [15] Underwood, E.E., 1970, Quantitative Stereology, 2nd ed., Addison-Wesley Publishing Company, Reading, MA. [16] Cruz-Orive, L.M., 1976, “Particle size-shape distributions: the general spheroid problem.” J. Microsc., Vol. 107, pp. 235–253. [17] Cruz-Orive, L.M., 1978, “Particle size-shape distributions: the general spheroid problem: II. Stochastic model and practical guide.” J. Microsc., Vol. 112, pp. 153–167. [18] Cruz-Orive, L.M., 1983, “Distribution-free estimation of sphere size distributions from slabs showing overprojection and truncation, with a review of previous methods.” J. Micros c., Vol. 131, pp. 265–290. [19] Takahashi, J. and Suito, H., 2003, “Evaluation of the accuracy of the three-dimensional size distribution estimated from the Schwartz-Saltikov method.” Metall. Mater. Trans. A, Vol. 34, pp. 171-181. [20] Payton, E.J. and Mills, M. J., 2011, “Stereology of backscatter electron images of etched surfaces for characterization of particle size distributions and volume fractions: Estimation of imaging bias via Monte Carlo simulations.” Mater. Charact., Vol. 62, pp. 563-574. [21] Jeppsson, J., Mannesson, K., Borgenstam, A., and Ågren, J., 2011, “Inverse Saltikov analysis for particle-size distributions and their time evolution.” Acta Mater., Vol. 59, pp. 874-882. [22] Ohser, J. and Mücklich, F., 2000, Statistical analysis of microstructures in materials science, John Wiley & Sons, New York, NY. [23] Ohser, J. and Mucklich, F., 1995, “Stereology for some classes of polyhedrons.” Adv. Appl. Prob., Vol. 27, pp. 384-396. [24] Scott, D.W., 1979, “On optimal and data-based hist ograms.” Biometrika, Vol. 66, pp. 605- 610.  Vol.11, No .3 Revisiting Sphere U nfolding Relationships 241 [25] Saltikov, S.A.: “The determination of the size distribution of particles in an opaque material from a measurement of the size distribution of their sections,” in: Stereology: Proceedings of the Second International Congress for Stereology, Chicago, 1967, pp. 163– 173. [26] Heilbronner, R. and Bruhn D., 1998, “The influence of three-dimensional grain size distributions on the rheology of polyphase rocks.” J. Struct. Geol., Vol. 20, pp. 695–705. [27] Heilbronner, R., 2002, “How to derive size distributions of particles from size distributions of sectional areas,” Conférence Universitaire de Suisse Occidentale, 3ème Cycle Séminaire: “Analyse d’images et morphométrie d’objets géologiques,” Organisé à Neuchâtel, Institut de Géologie, Université de Neuchâtel. [28] Ford, W.B., 1922, A Brief Course in College Algebra, The Macmillan Company, New York, NY. [29] Limpert, E., Stahel, W.A., and Abbt, M., 2001, “Log-normal Distributions across the Sciences: Keys and Clues.” BioScience, Vol. 51, pp. 341-352. [30] Russ, J.C. and Dehoff, R.T., 2000, Practical Stereology, Kluwer Academic, New York, NY. APPENDIX: SOURCE CODE The equations given in the present paper can be coded in a spreadsheet or rather efficiently in a few lines of code in, for example, the Matlab/Octave programming languages, as demonstrated in the following example where the number fractions in the histogram of o bservations are inputs the array ‘f2d’, the edges of the areal binning array are input as ‘a’, the mean areas of the bins are given as ‘ab’, the particle volumes represented by the bins are given by ‘V’, and the volume fraction of particles is given as ‘vf’: nb=length(a)-1; % Number of bins p=zeros(1,nb);am=zeros(1,nb);ap=zeros(1,nb); % Preallocate variables NA=zeros(nb);e=zeros(nb);am(1:end)=a(1:end-1);% " fA=ab.*f2d;fA=vf*fA/sum(fA); % Convert to area-weighting for j=nb:-1:1 % Loop through bins p(1:j)=(sqrt(a(j+1)-am(1:j)) ... -sqrt(a(j+1)-a(2:j+1)))/sqrt(a(j+1));% Eq. 5 ap(1:j)=0.5.*p(1:j).*(am(1:j) ... +a(2:j+1)+(a(j+1).*p(1:j).^2)./3);% Eq. 8 NA(j,1:j)=ap(1:j)/sum(ap(1:j));% Eq. 9 f3d(j)=fA(j)/NA(j,j);% Eq. 10 if f3d(j)<0 e(j,j+1:nb)=fA(j)./NA(j+1:nb,j);f3d(j)=0.0; % Eq. 12 end; fA(j)=0.0;fA=fA-f3d(j)*NA(j,:); % Eq. 11 end;clear p ap am NA j fA e=max(-repmat(f3d,[nb 1]),e); % Limit error array values  242 E. J. Payt on Vol.11, No.3 f3d=vf.*f3d/sum(f3d); % Restore correct volume fraction f3d=f3d./V;e=e./repmat(V,[nb 1]); % Number of particles per unit volume e=e/sum(f3d);f3d=f3d/sum(f3d); % Number fractions SE=-sqrt(sum(e.^2,1)./(1:nb))./sqrt(1:nb); % Eqs. 13 & 14 clear e nb |