Atmospheric and Climate Sciences
Vol.3 No.4(2013), Article ID:38225,8 pages DOI:10.4236/acs.2013.34063
Solar Activity, Solar Wind and Geomagnetic Signatures
1Université Polytechnique de Bobo-Dioulasso, Bobo-Dioulasso, Burkina Faso
2LPP-Laboratoire de Physique des Plasmas/UPMC/Polytechnique/CNRS, Saint-Maur-des-Fossés, France
3Laboratoire d’Energies Thermiques Renouvelables (L.E.T.RE), Université de Ouagadougou, Ouagadougou, Burkina Faso
4Ecole Normale Supérieure de l’Université de Koudougou, Koudougou, Burkina Faso
5Institut National des Sciences de l’Univers (INSU), Paris, France
6Kavli Institute for Astrophysics and Space Research, Massachusetts Institute of Technology, Cambridge, USA
Email: *jeanlouis.zerbo@gmail.com
Copyright © 2013 Jean-Louis Zerbo et al. This is an open access article distributed under the Creative Commons Attribution License, which permits unrestricted use, distribution, and reproduction in any medium, provided the original work is properly cited.
Received September 13, 2013; revised October 10, 2013; accepted October 18, 2013
Keywords: Solar Wind; Geomagnetic Activity; Solar Activity; Geomagnetic Index aa
ABSTRACT
The present study investigates solar events through geomagnetic activity and physical processes on the Sun: 1) Quiet activity (QA) related to the slow solar wind, 2) Recurrent activity (RA) related to high and moderate speed solar wind streams from coronal holes, 3) Shock activity (SA) identified by observations of SSCs and 4) Unclear activity (UA) which contains all activity not covered by the first three cases. For recent cycles, we analyze and emphasize some important results: Quiet activity is predominant for cycle 23, comprising 40% of the total activity and over 80% of the activity near solar minimum. Shock and recurrent activity contributions to total geomagnetic activity are largest in cycle 20. The most fluctuating events are observed during cycles 21 and 22. Throughout solar cycle 23, the contribution, from each type of activity, differs from recent solar cycles, with larger percentages of quiet and recurrent activity and less unclear activity. These percentages are similar to those in solar cycles observed in the late 1800s. Since 1963, solar wind data are available. We analyze the distribution of the solar wind velocity for each geomagnetic class of activity and find that: 1) Within each activity type aa does not depend on V, 2) Approximately 80% of the solar wind has V < 450 km/s for QA and 80% of the solar wind has V > 450 km/s for RA, 3) SA and UA both have 60% of the solar wind V > 450 km/s. We found the following conditions for all four solar cycles: 1) For QA 95% of solar wind speeds are in the range 399 ± 69 km/s, 2) For RA 95% of the solar wind speeds range from 582 ± 110 km/s, 3) For SA 95% of the solar wind velocities are order of 482 ± 101.4 km/s, and 4) For UA 95% of solar wind speeds are 480 ± 85.82 km/s. These results confirm the classification scheme that QA reflects slow wind effects, RA effects high wind stream and UA answers to the fluctuations between high wind stream (~60%) and slow wind (~40%). The study shows that high wind stream (~60%) and slow wind (~40%) are both registered for SA.
1. Introduction
Geomagnetic activity may be divided into four classes: quiet, recurrent, shock, and fluctuating/unclear [1-7]. Legrand and Simon [1] and Simon and Legrand [2] proposed the first classification of geomagnetic activity for the period 1868-1977 using pixel diagram. Pixel diagrams represent the geomagnetic data as a function of solar activity for each solar rotation (27 days) and give an overview of the geoeffectiveness of solar events. Previous pixel diagrams were built using the the geomagnetic aa index defined and explained by Mayaud [8-10], the times of SSCs (Sudden Storm Commencements) and the strong correlation between the aa index and solar wind established by Svalgaard [11]. Important works [12, 13] show that geomagnetic activity has two components. The first component varies in phase with the sunspot cycle and the second begins immediately after the maximum of the sunspot cycle. Following Legrand and Simon [1]’s works, Ouattara and Amory-Mazaudier [6] investigate the time variation of solar activity from 1968 to 1996. Very recent study [7] extends and improves the classification of geomagnetic activity, and we use it to investigate the time profiles of geomagnetic activity during solar cycles 20, 21, 22, and 23. We also study the statistical distribution of solar wind speeds in each class of geomagnetic activity for cycles 20 to 23.
2. Data and Methodology
2.1. Data
The times of sudden substorm commencements (SSC), which are rapid increases in the magnetic field observed at the ground per day are taken from http://isgi.latmos. ipsl.fr/. The solar wind speed and the international sunspot number (SSN) are obtained from http://omniweb. gsfc.nasa.gov/form/dx1.html.
2.2. Geomagnetic Classification Methodology
Legrand and Simon [1] justified their use of the aa index to classify geomagnetic activity on two features: 1) The contribution of solar wind shocks to geomagnetic activity can be determined from ground-based observations of SSCs; time periods with SSCs are defined to have shock activity (SA). 2) The strong correlation between the aa index [8-10] and the solar wind speed [11]. This correlation allows the data to be divided into three classes of geomagnetic activity: 1) low-speed solar wind, 2) variable-speed solar wind and 3) high speed solar wind. Zerbo J.-L. et al. [7] consider these criteria, the contributions of magnetic clouds, and the contribution of moderate speed wind streams to improve the classifications [1]. We divide the solar wind into classes using the aa index and then use the results to study correlations with solar wind parameters. Figure 1 illustrates the pixel diagrams of the aa indices. The top panel illustrates the year 1974a very active year [7], and the bottom panel the year 2009, a very geomagnetic quiet year at the minimum of the sunspot cycle. The pixel diagrams display the daily averages of aa as a table. Each horizontal line contains 27 days corresponding to a 27-day Bartels solar rotation with two days of overlap on each end. The number in each square is the mean daily value of the aa index and the squares are color coded based on these values using the color bar shown in Figure 1. Circles show the days when SSCs were observed. This diagram, similar to a Bartels diagram, simplifies the identification of geomagnetic phenomena. From the pixel diagrams, the class of activity, QA, SA, RA or UA, for each day is determined. The 1974 pixel diagram illustrates the different classes of activity. The use of these diagrams is best explained by Zerbo J.-L. et al. [7]. 1) Quiet activity days are defined as days when aa < 20 nT (colors white and blue on Figure 1). The three other classes (shock activity, recurrent activity and fluctuating activity) constitute the disturbed geomagnetic activity classes which occur on days when aa ≥ 20 nT. These classes are distinguished as follows:
2) Recurrent (stream) activity corresponds in the pixel diagrams to days where aa ≥ 20 which repeat at the same solar longitude for at least two consecutive solar rotations. This class is driven by fast solar wind from coronal holes which persist for more than one solar rotation. SSCs are not observed during the main phases of storms driven by recurrent streams. An example of RA is shown in Figure 1 (top panel).
3) Shock activity is defined to occur on days when SSCs are observed and up to 3 days after the shock passage if aa remains > 20 nT. SA is driven by CMEs on the Sun which often produces high solar wind speeds. An example of shock activity which persists for three days is shown in Figure 1 (top panel).
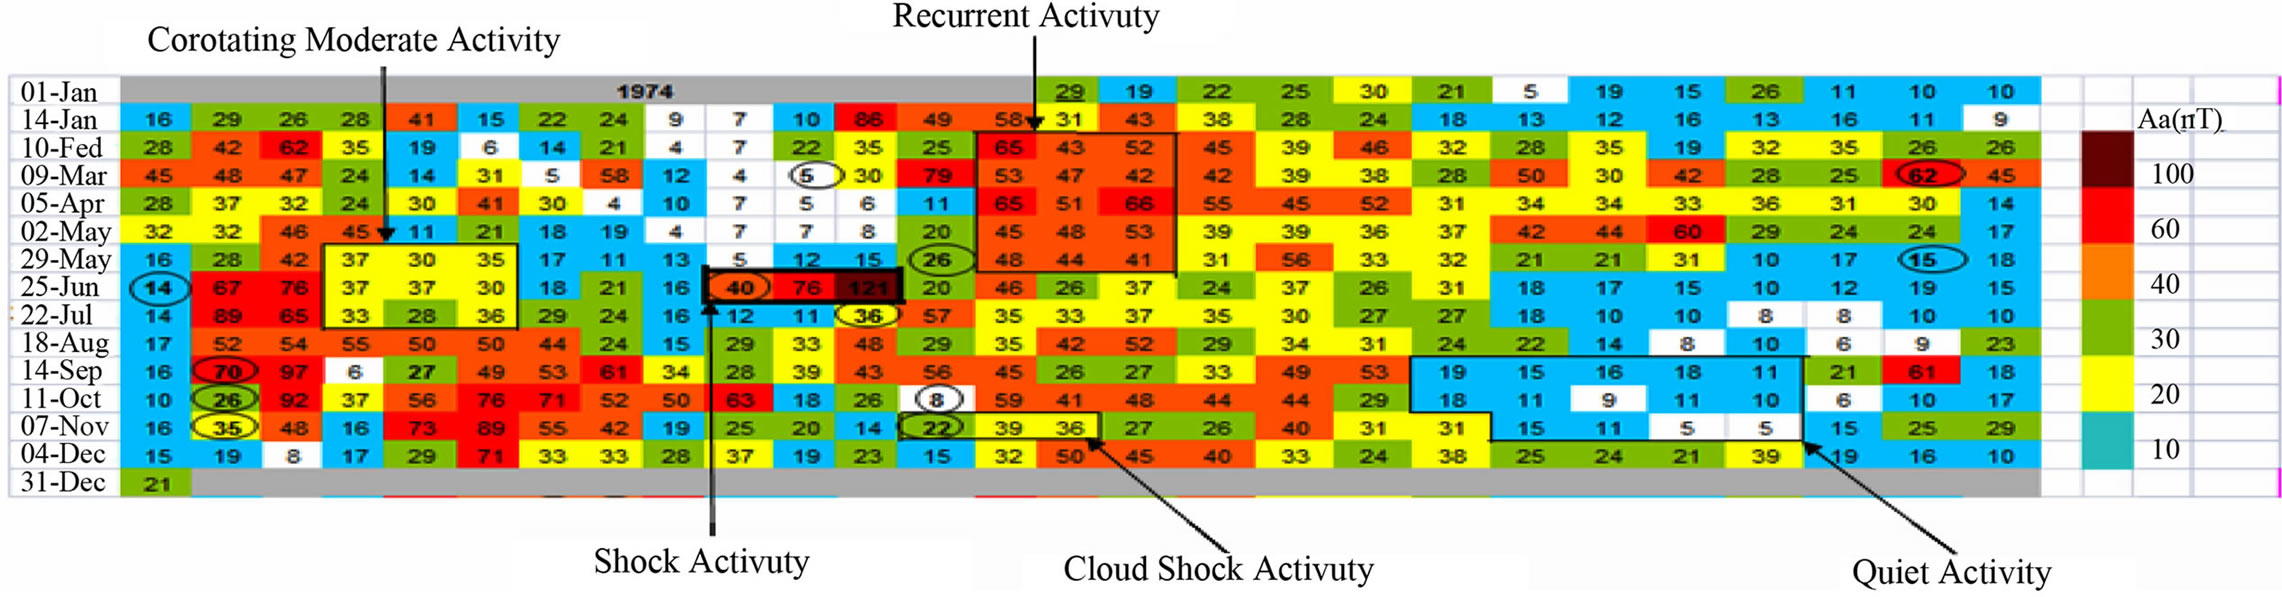
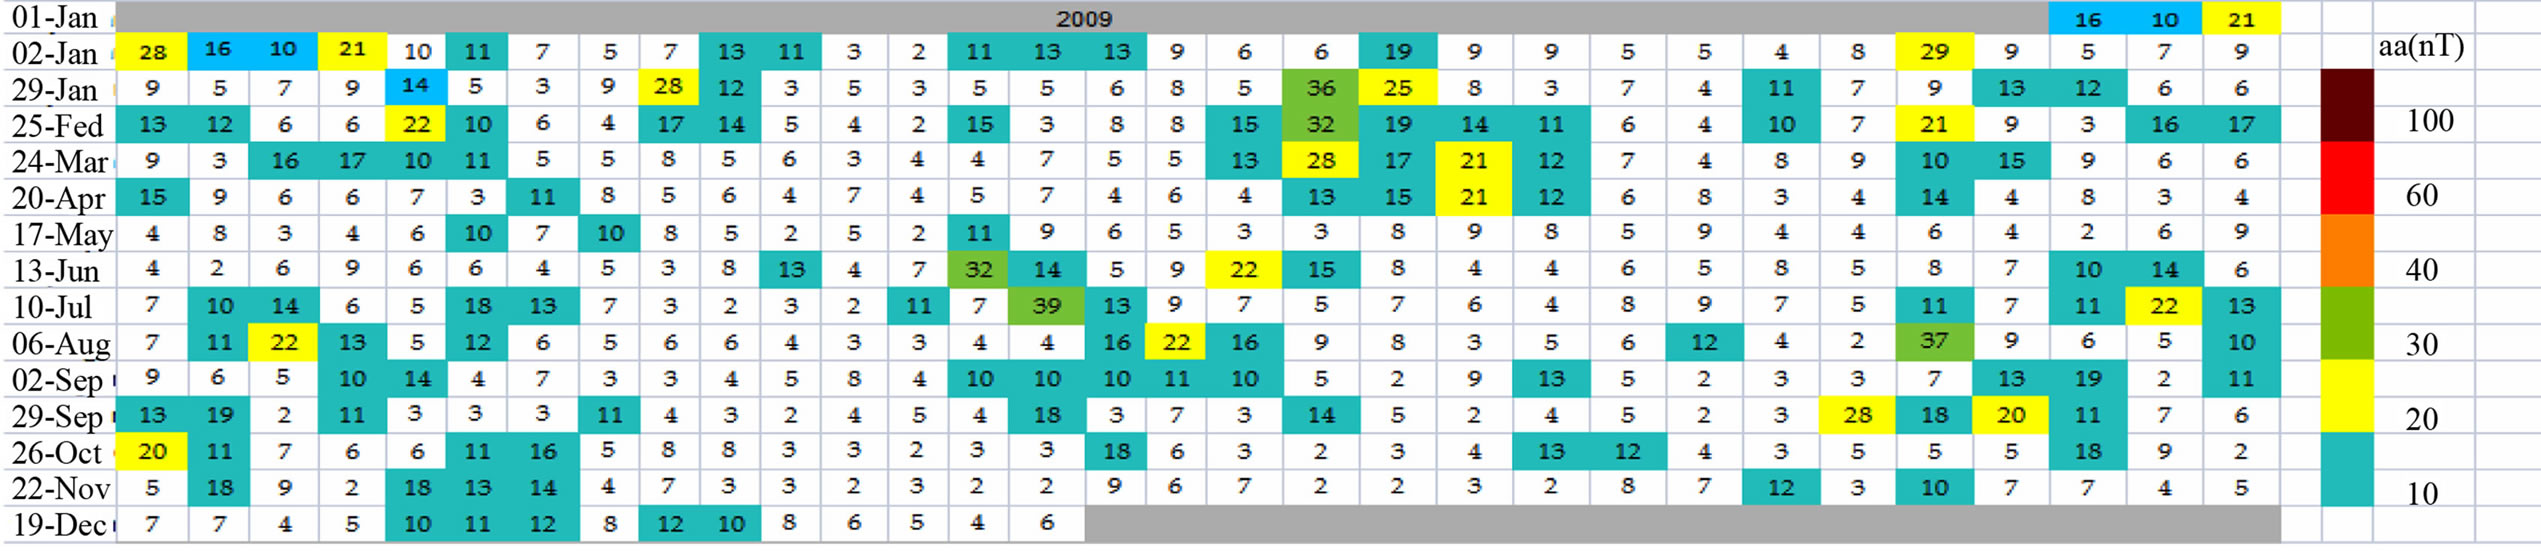
Figure 1. Pixel diagrams for the years 1974 (panel a) and 2009 (panel b) constructed with aa indices.
4) Unclear activity includes all times which do not fit the criteria for the other three classes and is thus a mixed class of disturbances. This activity results from variable moderate and high-speed solar wind and may be related to the fluctuations of the heliospheric neutral sheets.
3. Results
3.1. Geomagnetic Classes, Their Activity Variation during the Solar Cycles 20, 21, 22, and 23
In this section, we study the four latest solar cycles using aa indices and solar wind data. Figure 1 shows the large difference in solar activity between the beginning of the declining phase in 1974 and very quiet recent solar minimum in 2009.
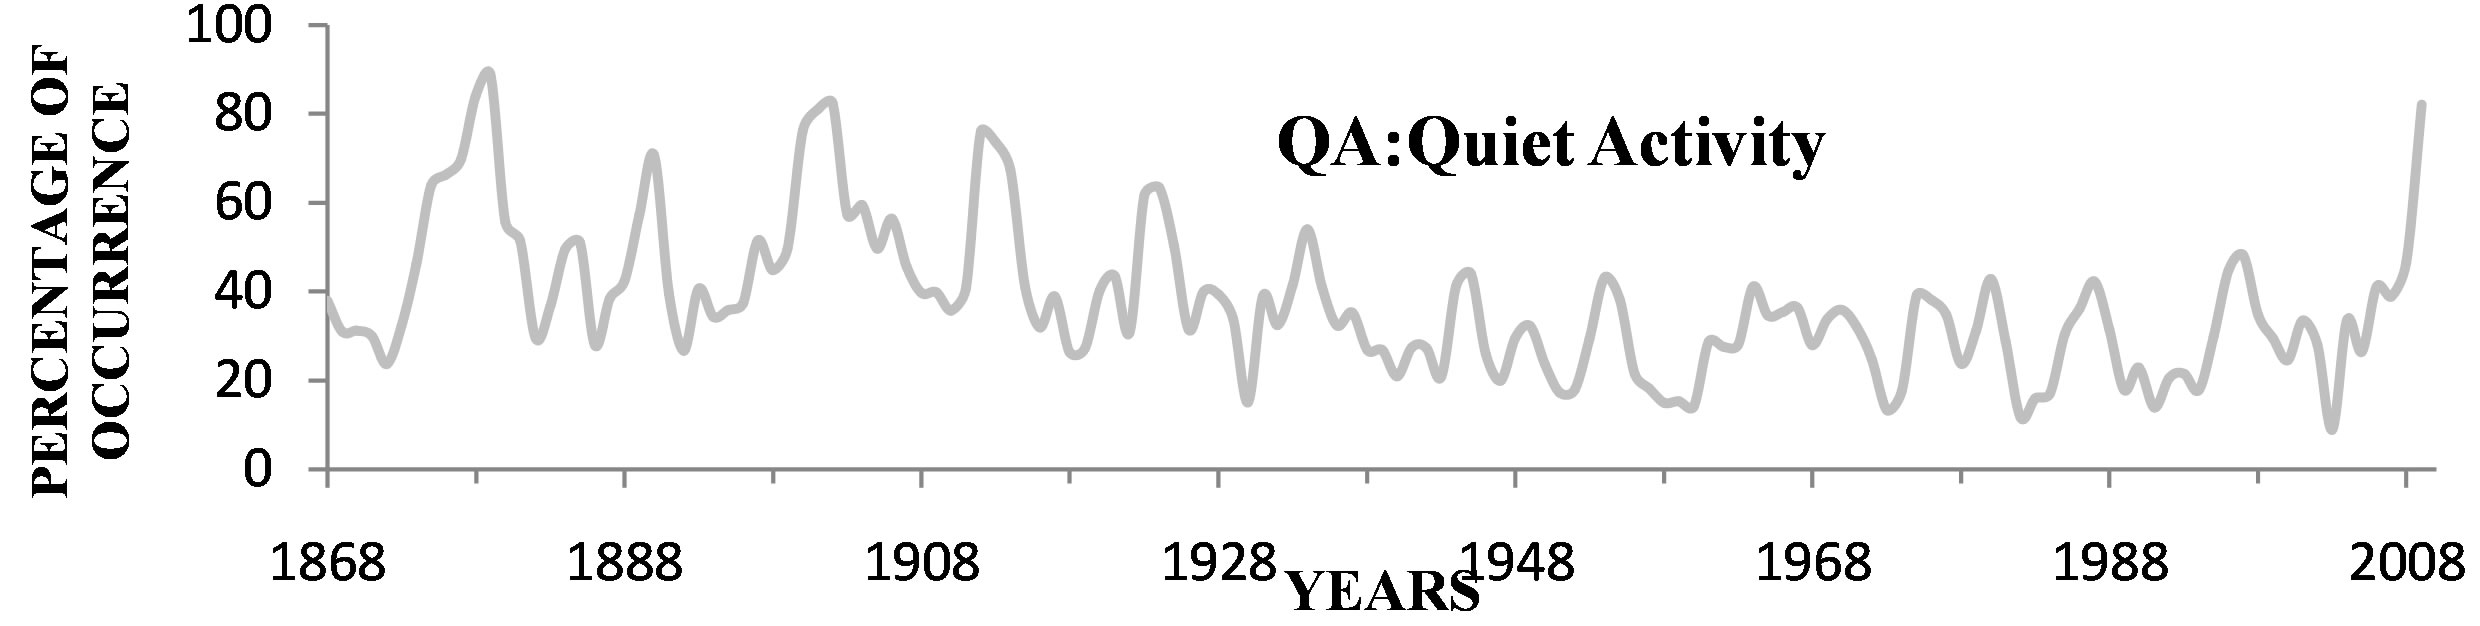
Figure 2 extends the Legrand and Simon [1]’s work to include 32 more years of data. It shows the yearly percentage of occurrence of each class of geomagnetic activity from 1868 through 2009. Figures 2(a)-(e) show long time variations of QA, RA, SA, FA, and SSN respectively (classification of Legrand and Simon, 1989). QA decreases with time from 1868 until solar cycle 22 and then strongly increases at the end of solar cycle 23.
 (a)
(a)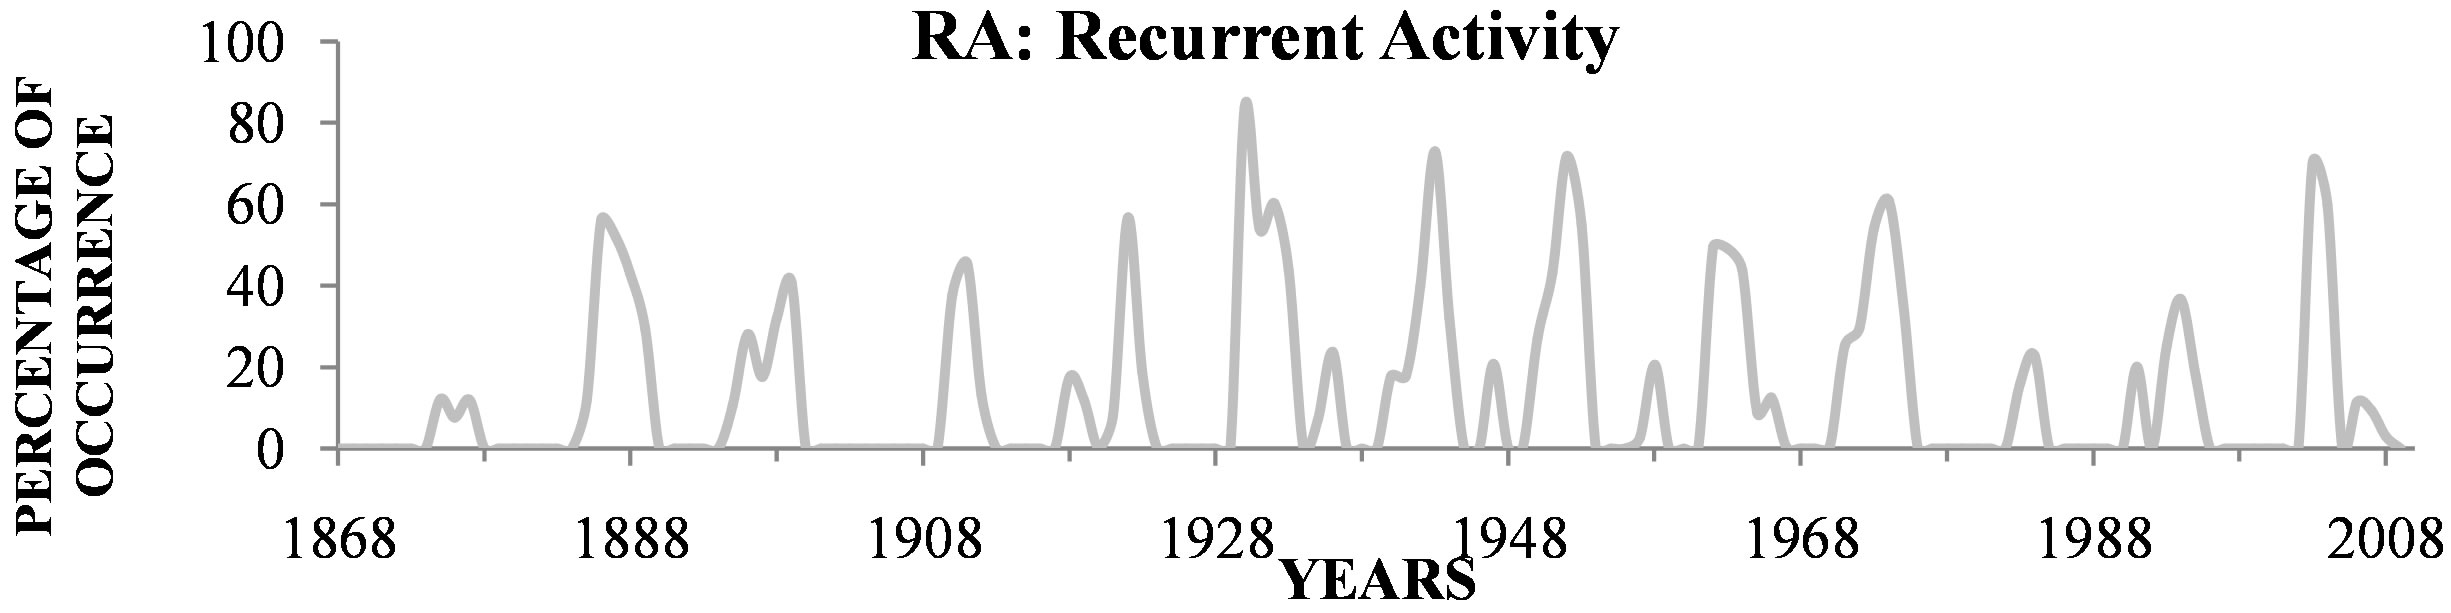 (b)
(b)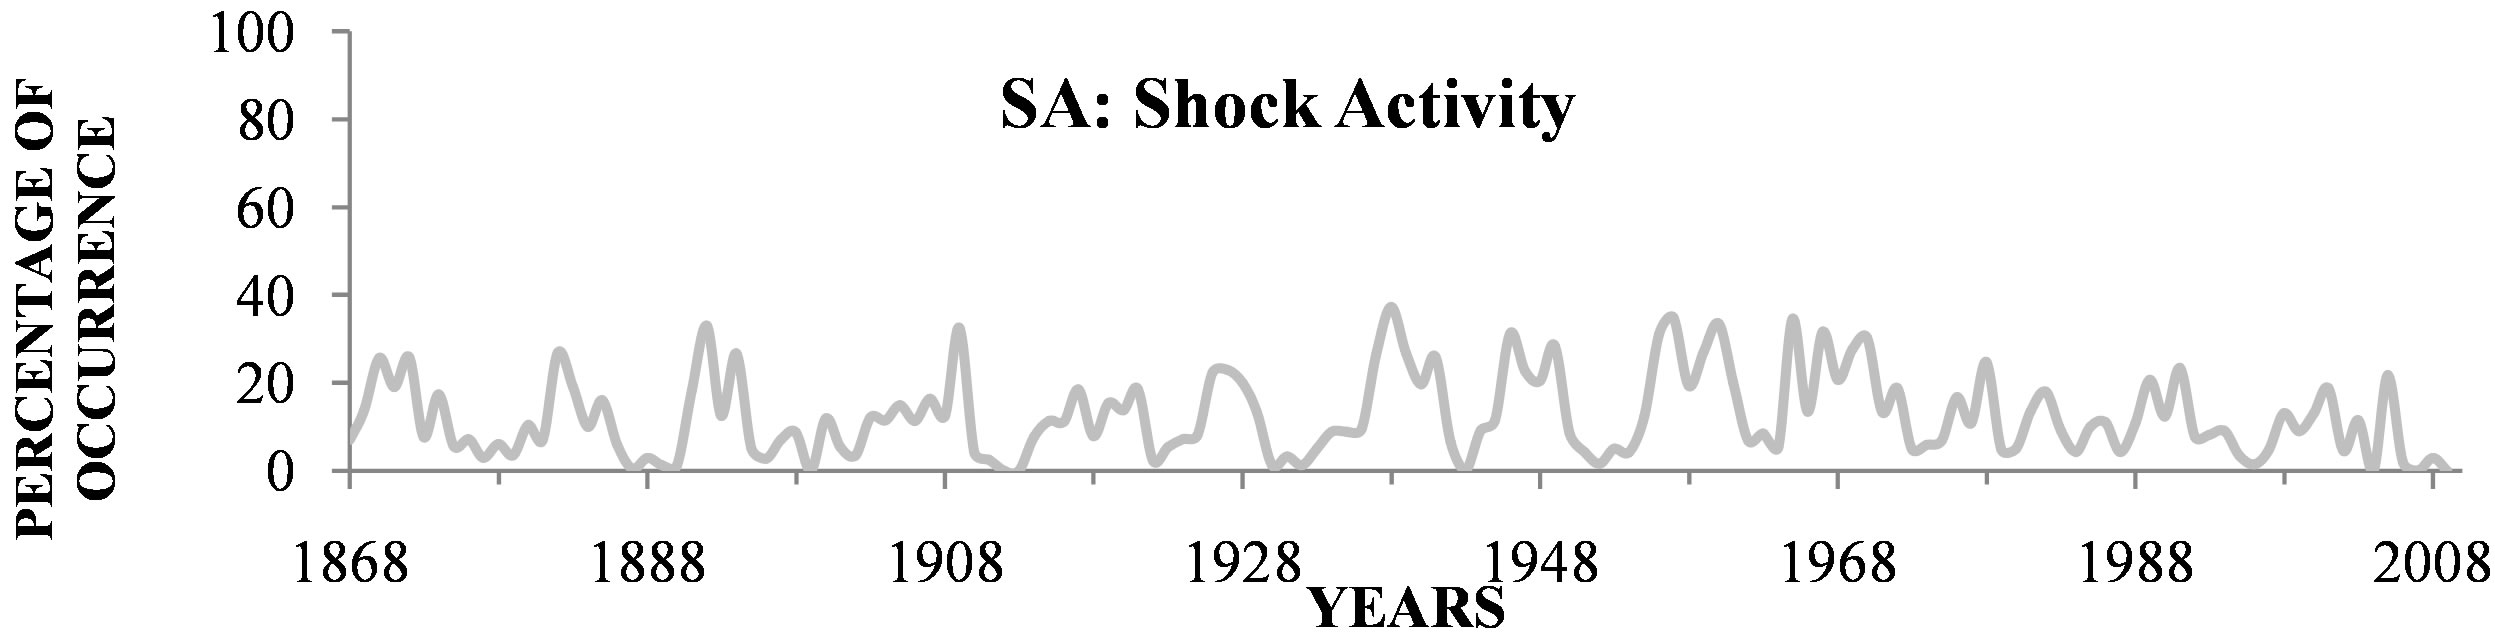 (c)
(c)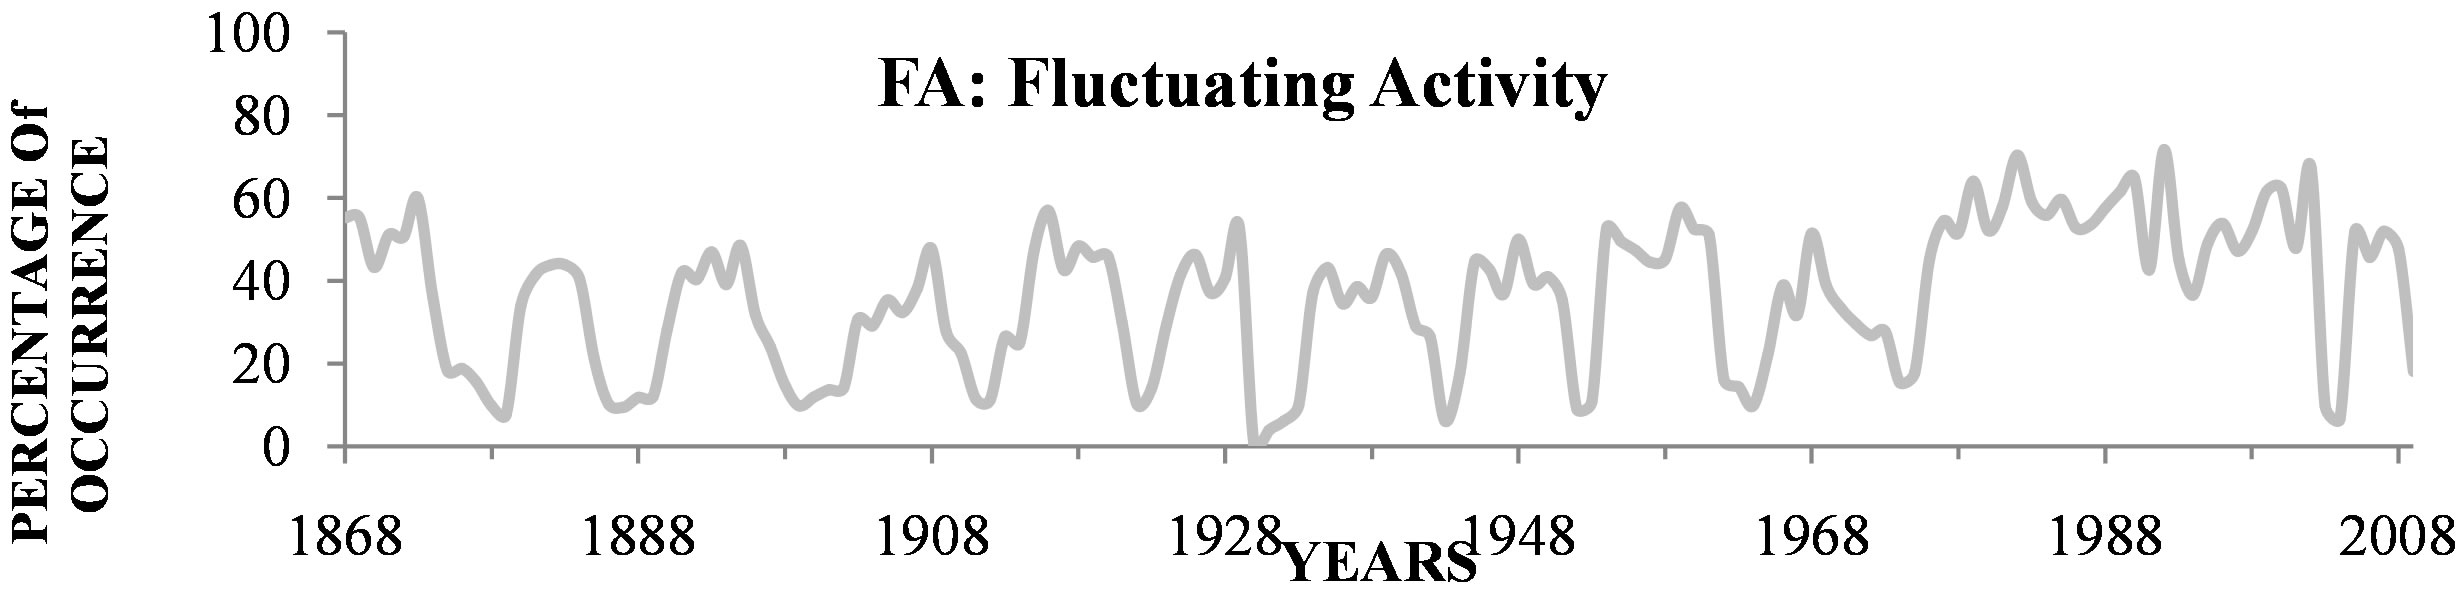 (d)
(d)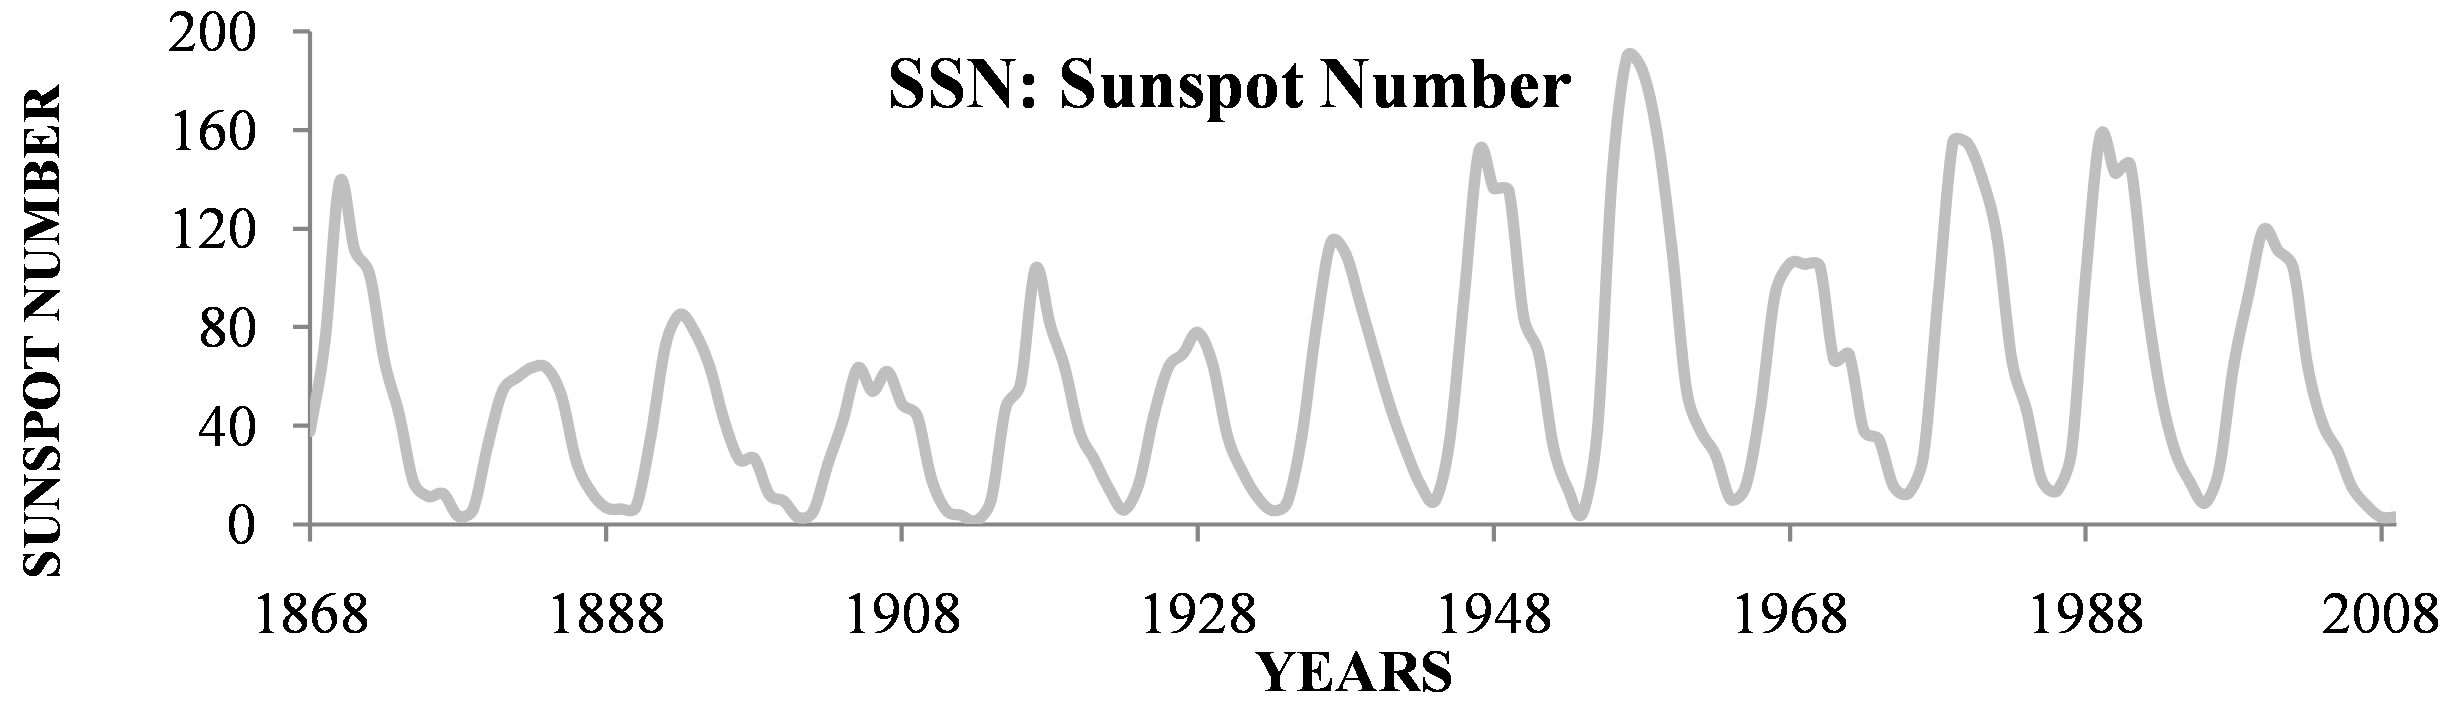 (e)
(e)
Figure 2. Long-term trends of solar activity classified using the aa index from 1868 to 2009. Quiet activity (a) Recurrent activity (b) Shock activity (c) and Fluctuating activity (d).
The recurrent activity RA in solar cycle 23 is one of the four highest since 1868. The shock activity SA is low compared to other recent cycles.
Cycle 23 is different from recent solar cycles in that RA and QA are more frequent and SA is less frequent. This cycle is more similar to the cycles observed in the late 1800s. Likewise, cycle 22 seems to be similar to the cycles observed in the beginning of the 1900s. These results are perhaps indicative of longer-scale solar changes.
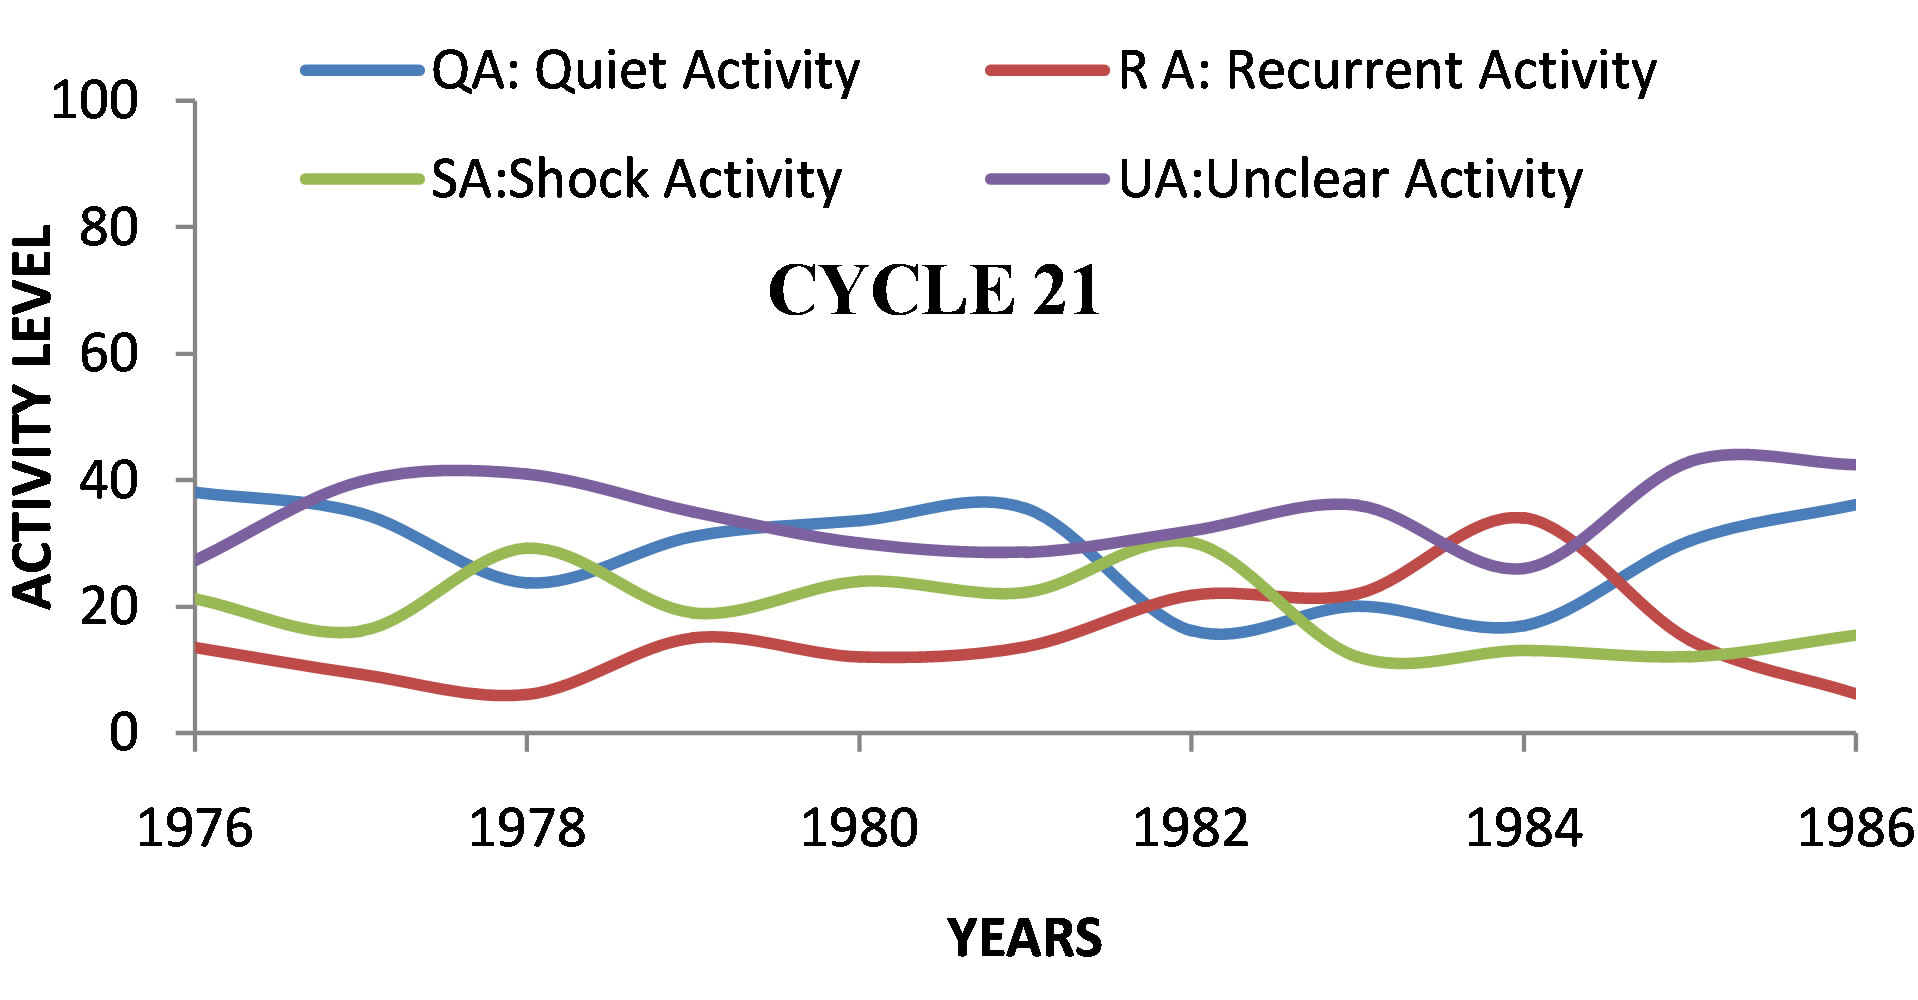
Figure 3 shows the percentages of each class of geomagnetic activity for each solar cycle year per year using the most recent geomagnetic activity [7]. From this figure, it is easy to remark that all four types of geomagnetic activity coexist most of the time over these four solar cycles.
Figure 3(a) shows the profiles of the four classes during the solar cycle 20. Quiet activity (QA) makes the highest contribution in 1975 and 1976 (39% and 38%) and the lowest in year 1973 (13%). Recurrent activity (RA) exhibits the most important contribution to geomagnetic activity in 1973 and 1974 (61% and 74%). The shock activity (SA) has the highest percentages in 1965, 1969 and 1970 (51%, 39%, and 38%). Unclear activity (UA) has the lowest contributions in 1964, 1965, and 1974 (0%).
The time profiles of the different geomagnetic classes are plotted in Figure 3(b) for solar cycle 21. QA is most important in 1976, 1981 and 1986 (~37%) and makes its lowest contribution from 1982 to 1984 (16%). SA shows a large occurrence frequency in 1978 and 1982 (~30%). As to UA, it is important most of the time with more occurrences in 1977, 1978 and 1985(~40%).
Figure 3(c) plots the four classes during solar cycle 22. QA is most important in 1987 and 1996 (42% and 47%). RA presents the highest contributions from 1993 to 1994 (30% - 44%). SA is important in 1989 and 1991 (~30%). For UA, the occurrence is ≥27% over the entire solar cycle 22. In Figure 3(d), the time profiles of each class are plotted for solar cycle 23. In 1996, QA was observed 45% of the time. The most SA in cycle 23 occurs during the maximum and declining phases with very little near solar minimum. QA and UA are observed in all solar cycle phases. Almost all RA is observed in the declining phase. This figure shows that UA has a fairly constant time profile with an average occurrence rate of about (40%), with lower values in the declining phase in 2003 (9%), 2004 (4%), and 2005 (0%). The largest UA value is 57% and occurs near the maximum phase in 1999. RA is the dominant activity in 2003 (~70%) and is still important in 2004 (~63%). QA is most frequent in 1997 and 2009 when it comprises 48% and 91% of the activity, respectively. The QA frequency minimum of 9% occurred in 2003 near solar maximum.
These results show that the most UA occurs during the ascending phase, SA occurs mainly near solar maximum and most RA is observed during the declining phase, consistent with the results of previous works [1,6,7].
 (a)
(a)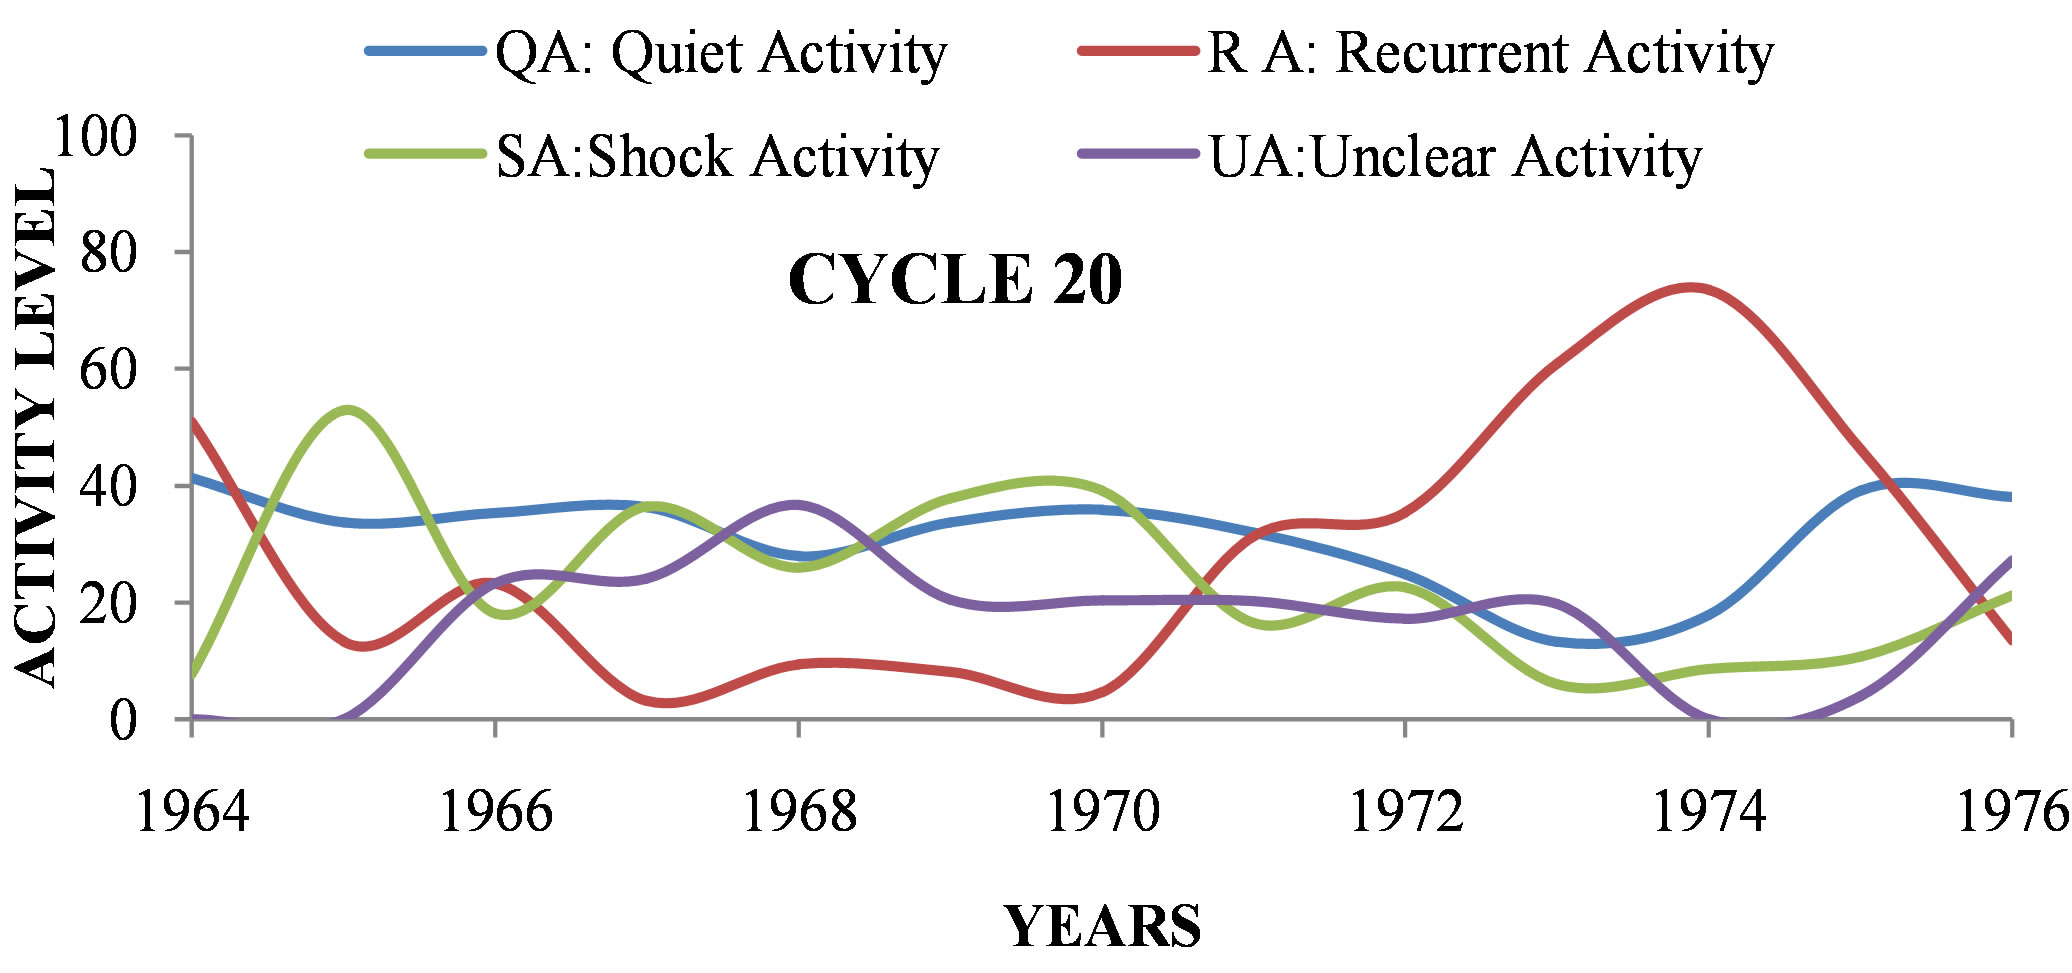 (b)
(b)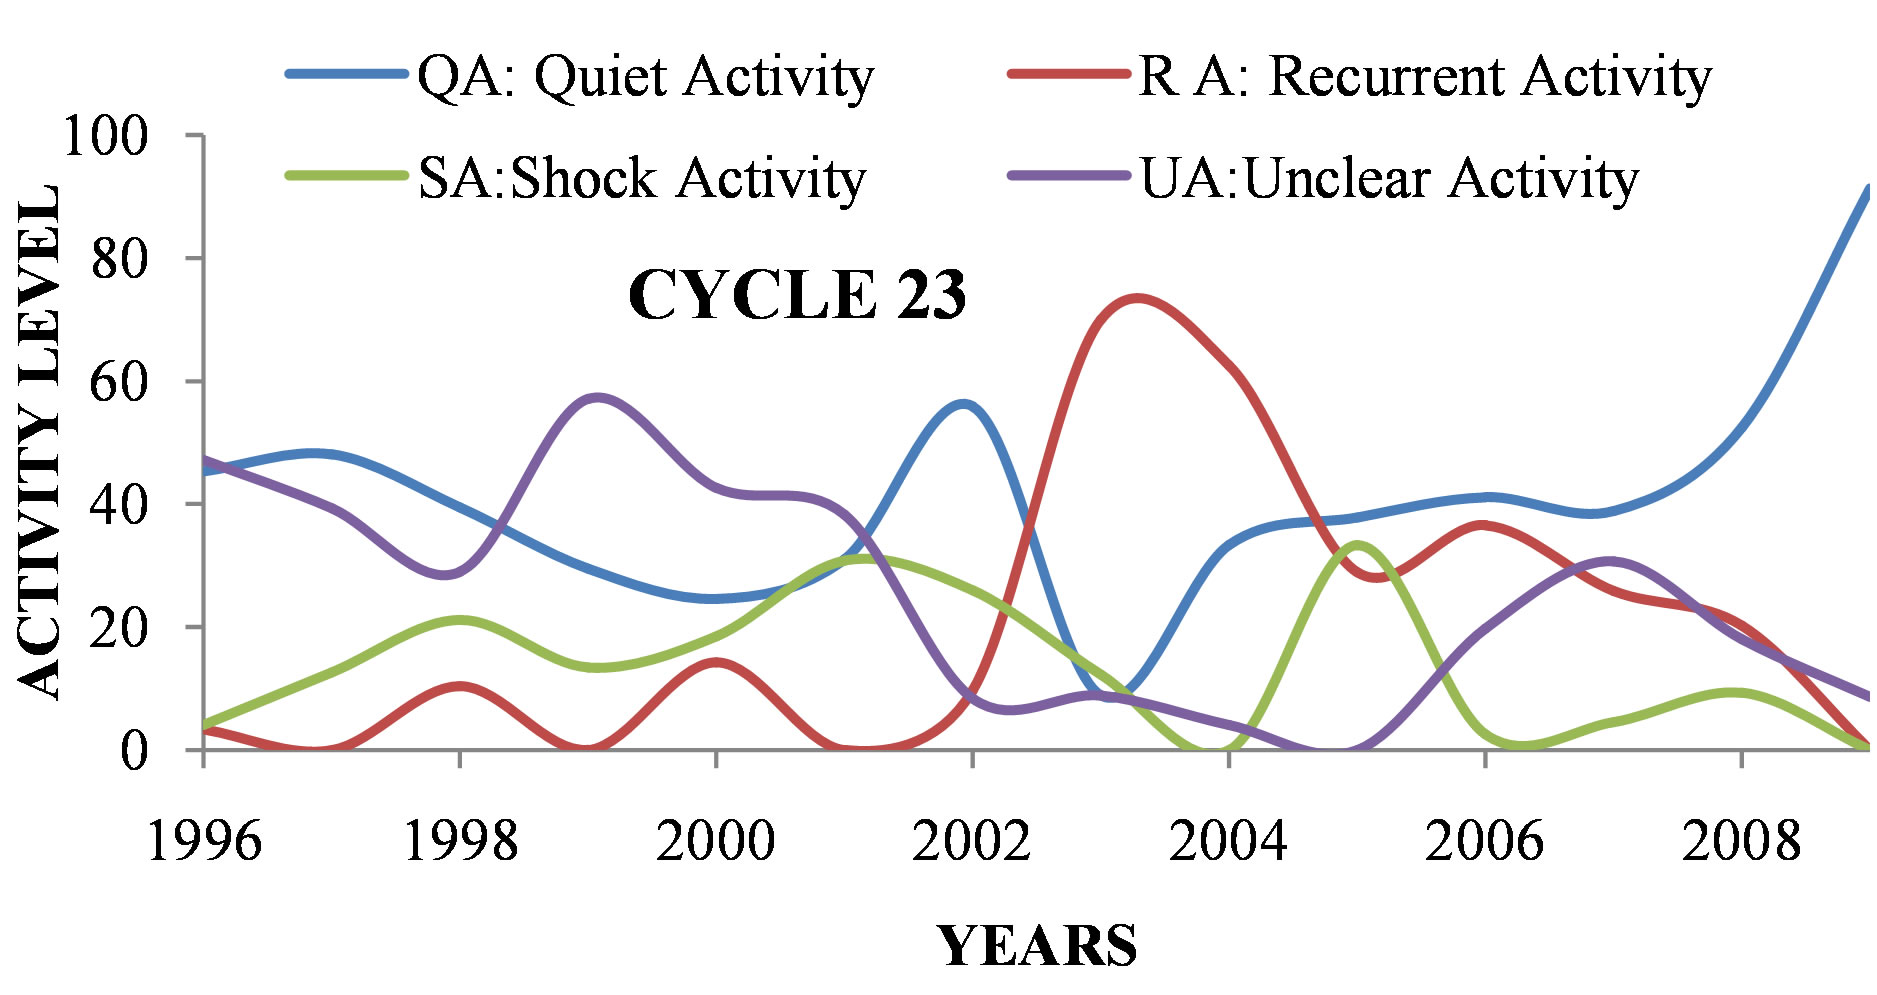 (c)
(c)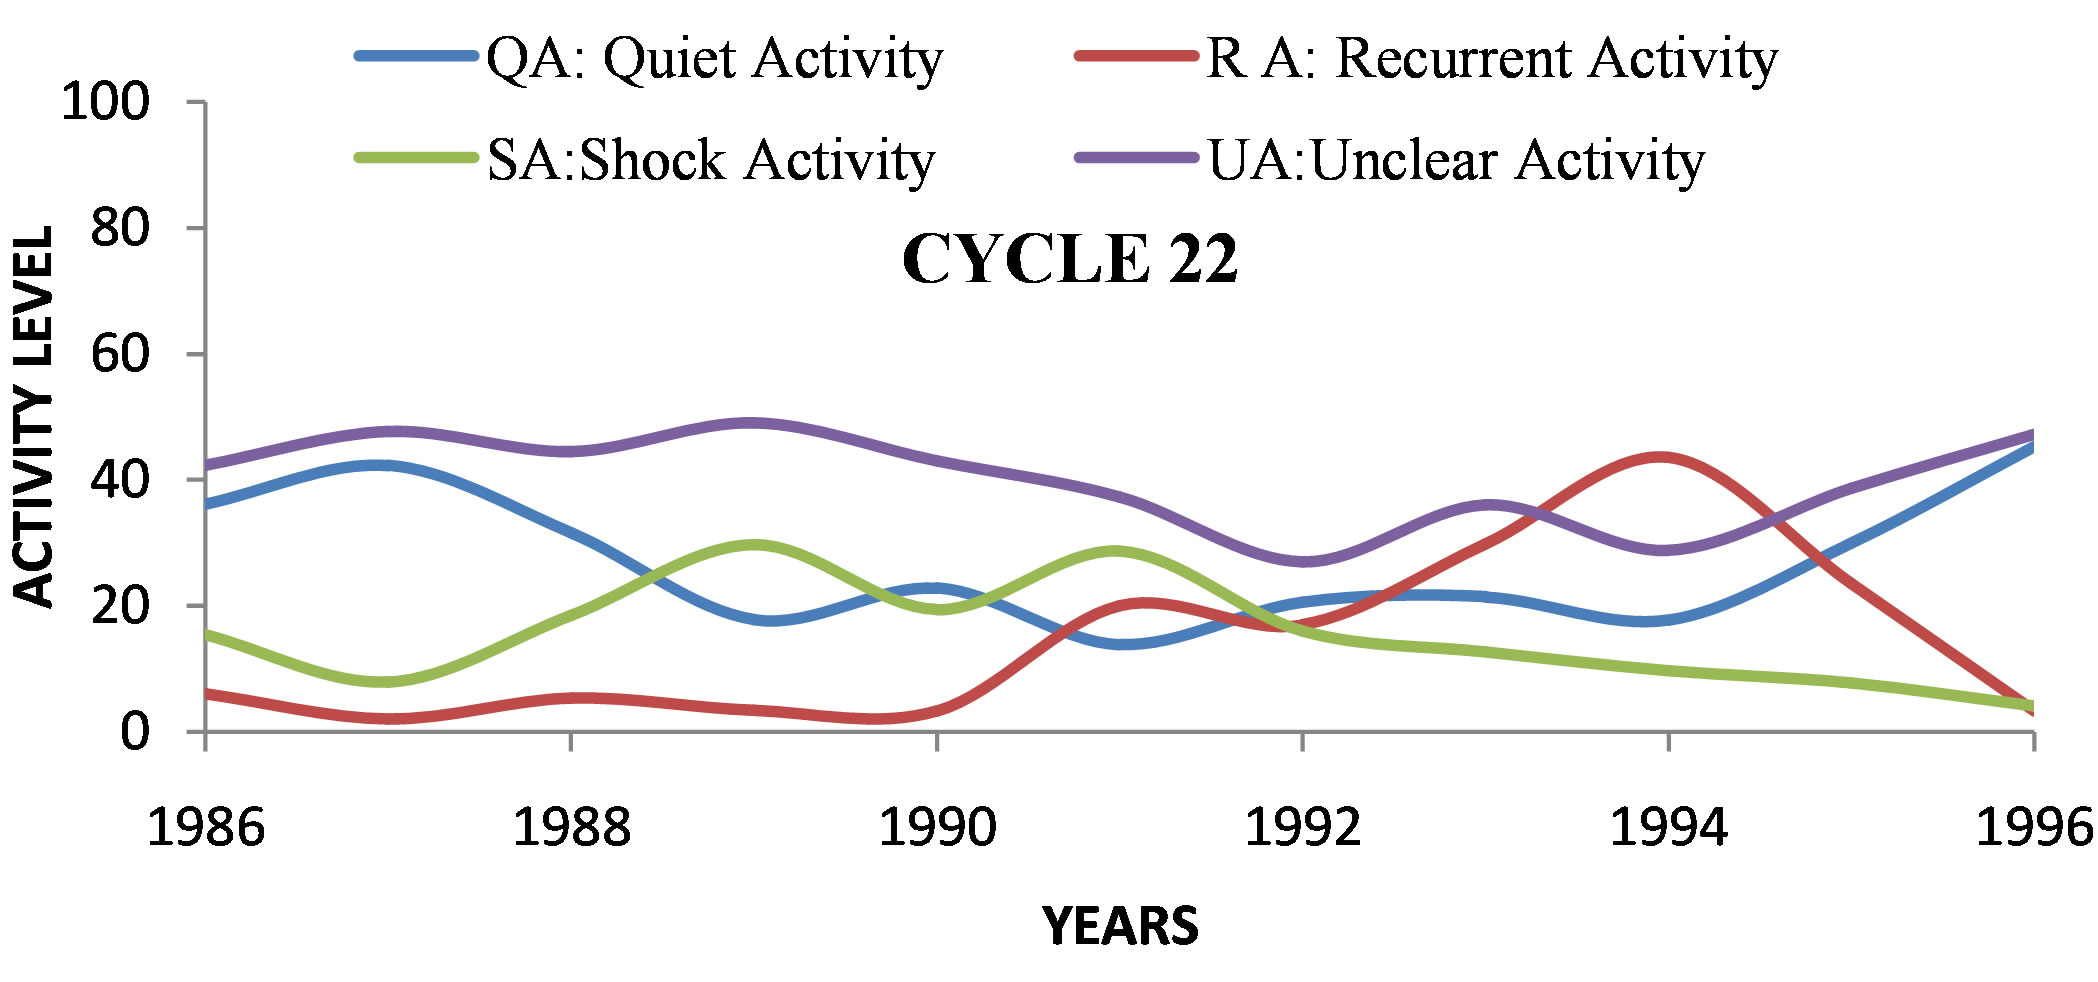 (d)
(d)
Figure 3. Percentage of each class of activity for: (a) Cycle 20; (b) Cycle 21; (c) Cycle 22; (d) Cycle 23.
3.2. Solar Wind Characteristic and Geomagnetic Activity during the Four Latest Solar Cycles 20, 21, 22, and 23
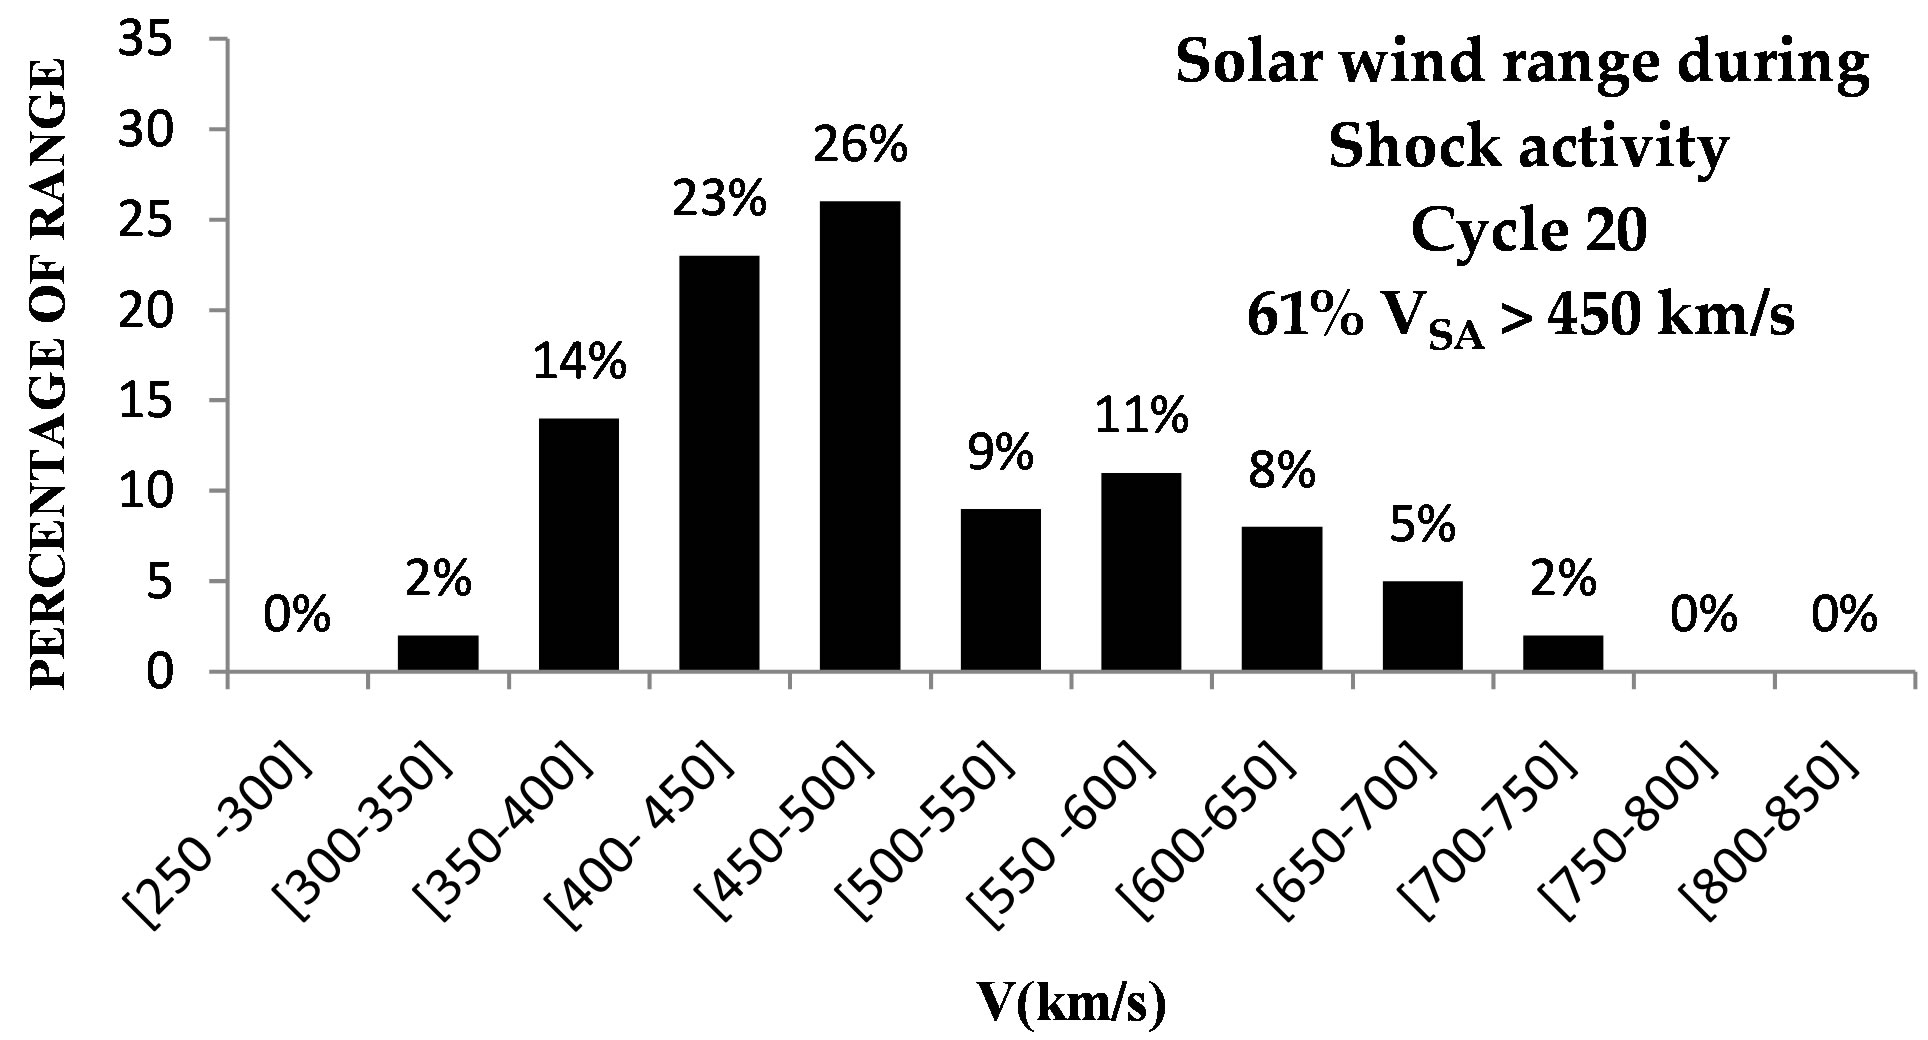
Time scales for solar variation range from solar flare timescales of several seconds, to the solar rotation period of 27 days for corotating streams, to 11 years (sunspot cycle), to 22 years (Hale cycle). Hourly solar wind data and three-hourly geomagnetic data are available for only a few sunspot cycles, so we can only analyze time scales from days to years. Figures 4-7 show the correlation between the daily-averaged aa index and solar wind speed for the four classes of geomagnetic activity during the cycles 20, 21, 22, and 23.
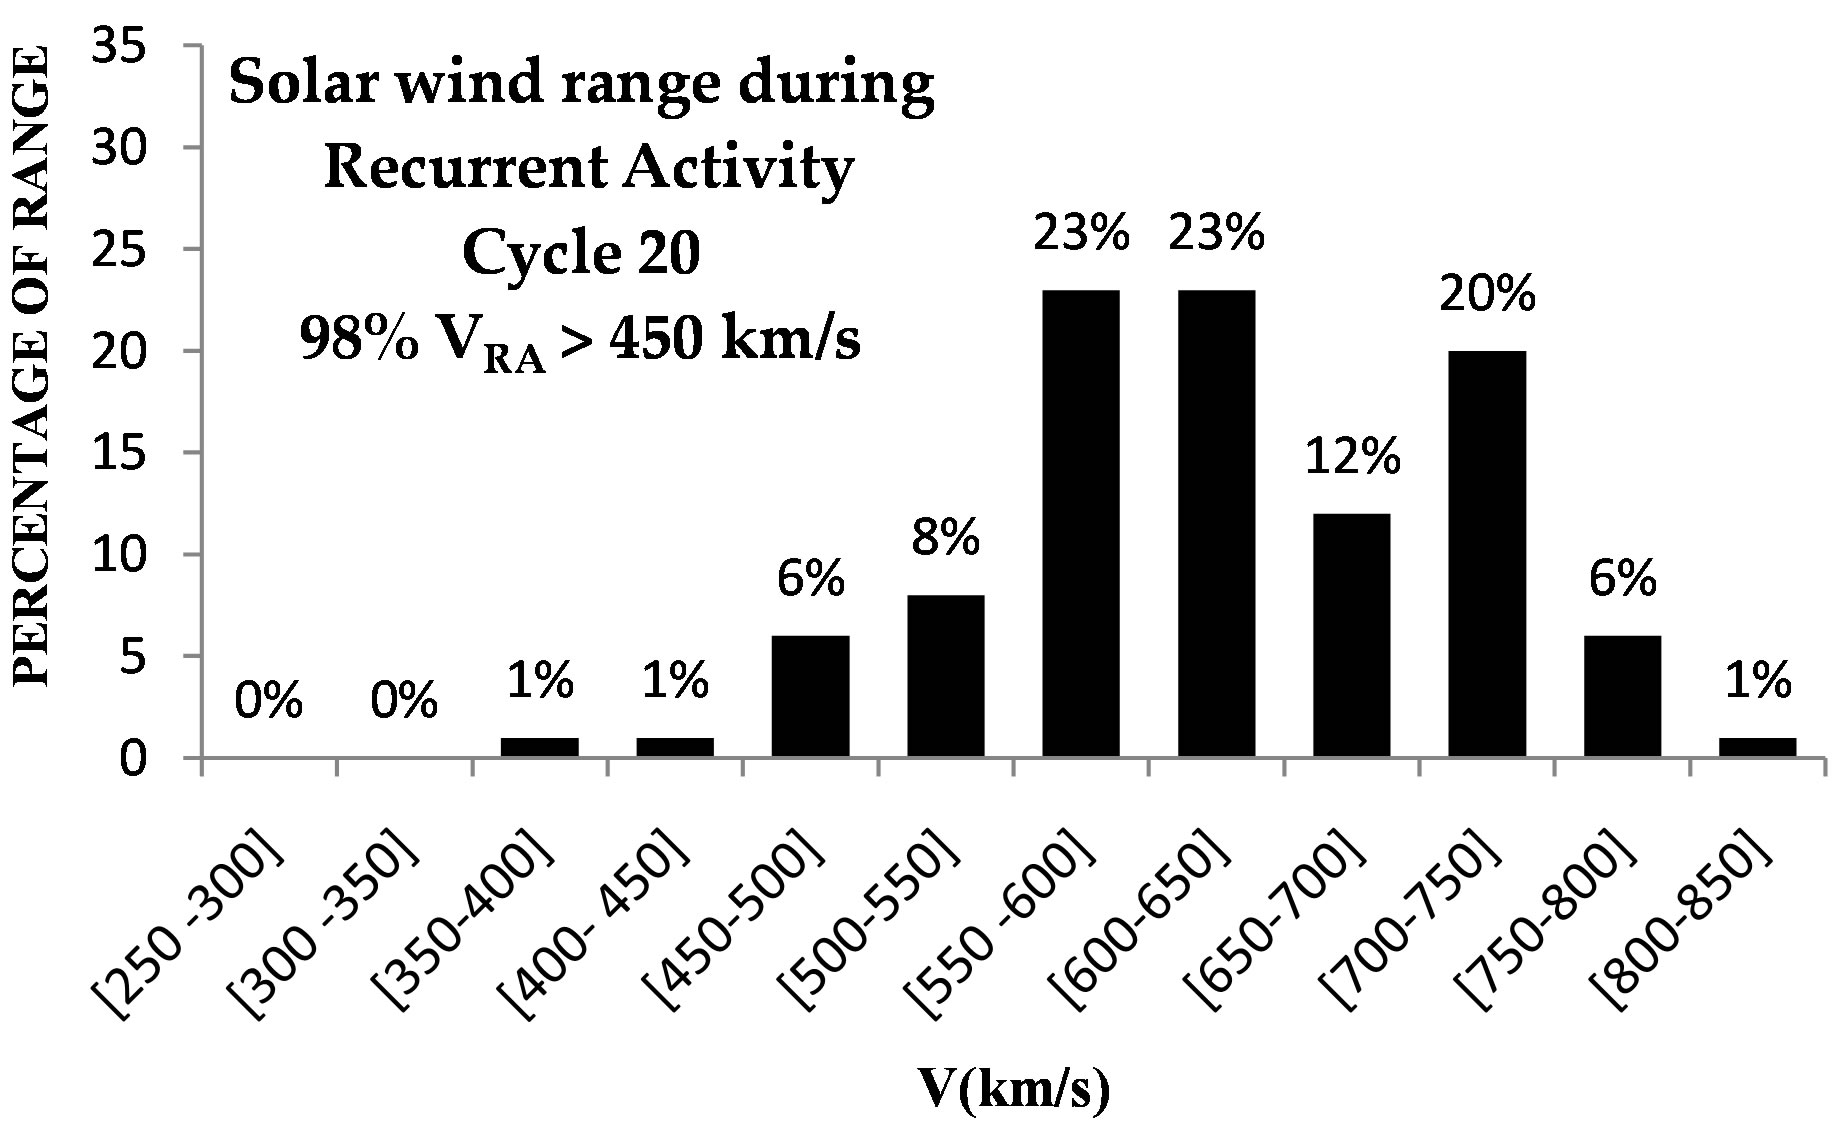
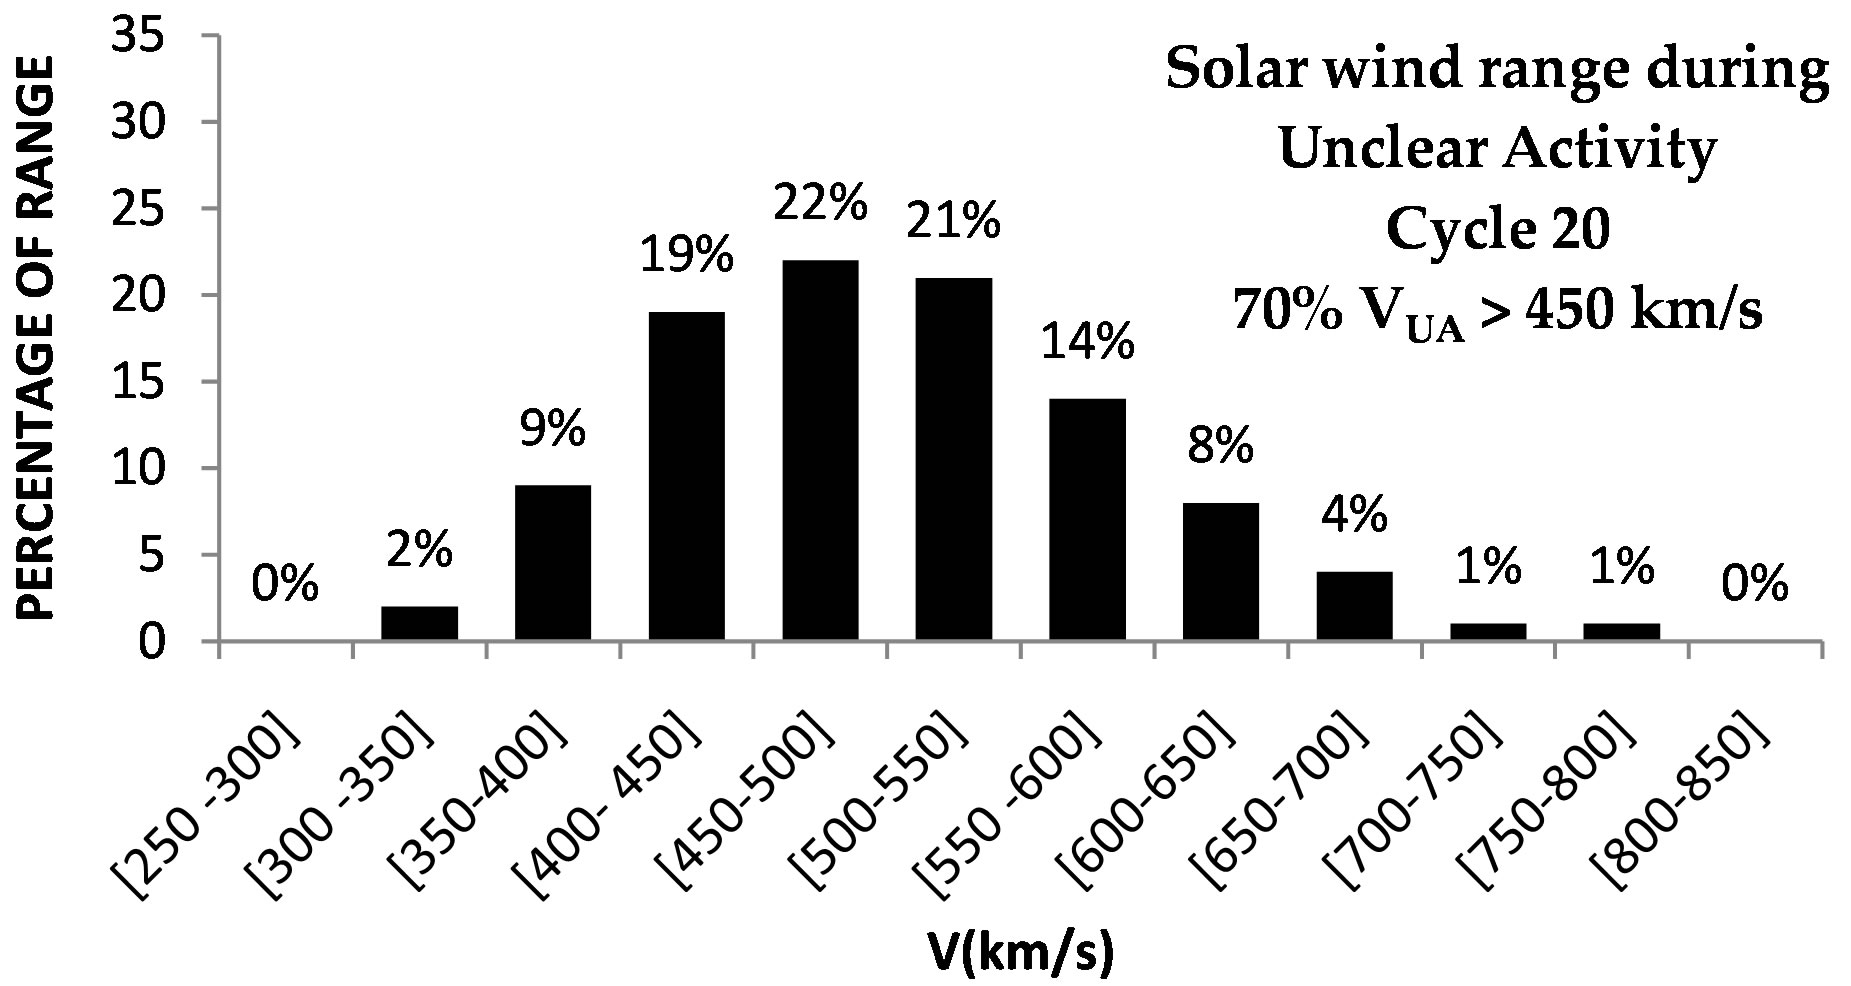
Figures 4 shows the daily aa index as a function of solar wind speed and the range of solar wind speeds observed during periods with quiet geomagnetic activity, respectively for the solar cycle 20 (panel a), solar cycle 21 (panel b), solar cycle 22 (panel c), and the solar cycle 23 (panel d). Figure 5, devoted to recurrent geomagnetic activity, present the same morphology as Figure 4" target="_self"> Figure 4. Similarly, Figure 6 shows the link between geomagnetic activity and solar wind during periods with shock activity. Figure 7 shows the statistical distribution of the solar wind for unclear activity. It emerges from all the plots (Figure 4) that there is no linear correlation between the aa index and solar wind speed for the combined data. It means that within each activity type aa does not depend only on V. Nevertheless, all the panels from the Figure 4" target="_self"> Figure 4-7 show interesting statistics:
1) Figure 4 shows that more than 77% of the solar wind speeds for QA are less than 450 km/s for all four solar cycles. This result agrees with [1,7] where the quiet magnetic activity is fixed; 2) For RA, Figure 5 shows that 79% - 98% of solar wind speeds are more than 450 km/s; 3) In Figure 6, 59% - 61% of the wind speeds are over 450 km/s for SA over all four solar cycles; 4) 59% - 70% of the wind speeds are more than 450 km/s for UA, Figure 7. The last three classes form the disturbed magnetic activity groups [1,7]. These results show the plausible role plays by the interplanetary magnetic field, in particular the southward component, within the groups of solar activity. That is in phase with the work of Feynman and Crooker [14] who conclude that aa~BV**2.
This study is the first to discuss of the solar wind distribution for each geomagnetic class. To classify the geomagnetic activity, Legrand and Simon [1] and Zerbo J.-L. et al. [7] based their solar wind condition on the correlation made by Svalgaard [11] to estimate and fix the value of solar wind: V < 450 km/s for the quiet activity and V ≥ 450 km/s for the three other classes. Our study will help to understand the links between solar and geomagnetic events.
4. Discussion and Conclusion
The solar cycle 23 is one of the longest cycles since 1868 (13 years) and the geomagnetic activity in this cycle presents some interesting features:
 (a)
(a)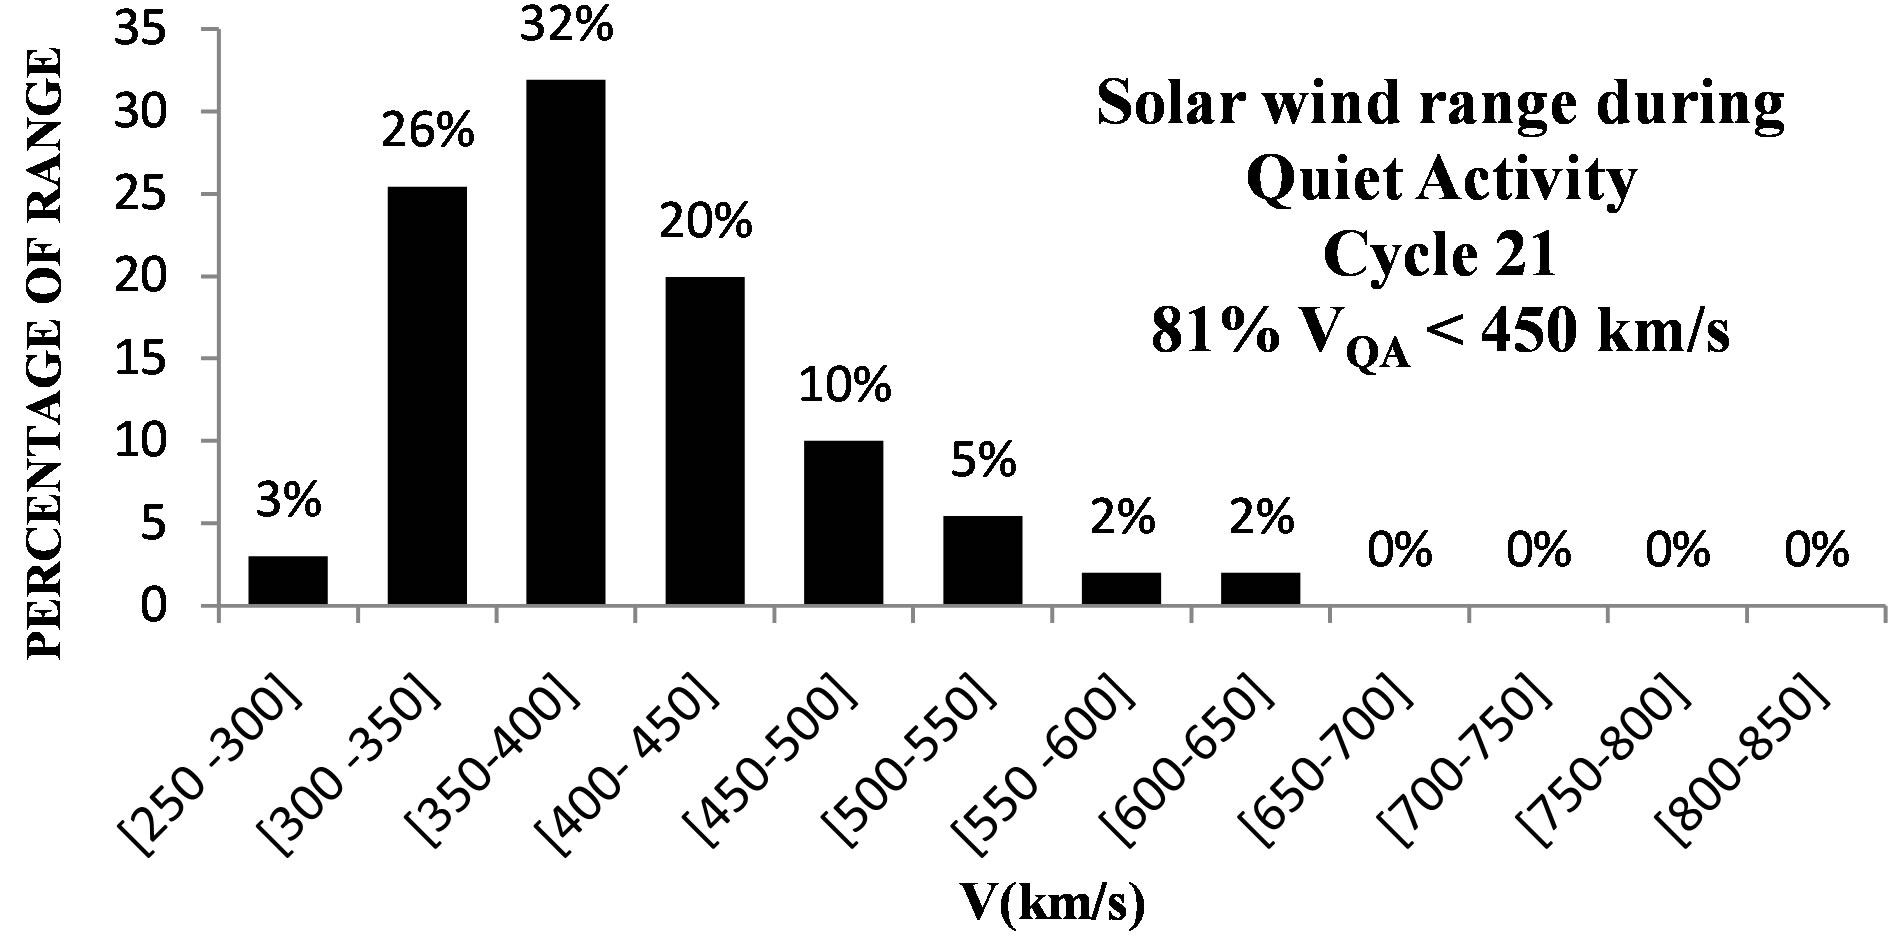 (b)
(b) (c)
(c)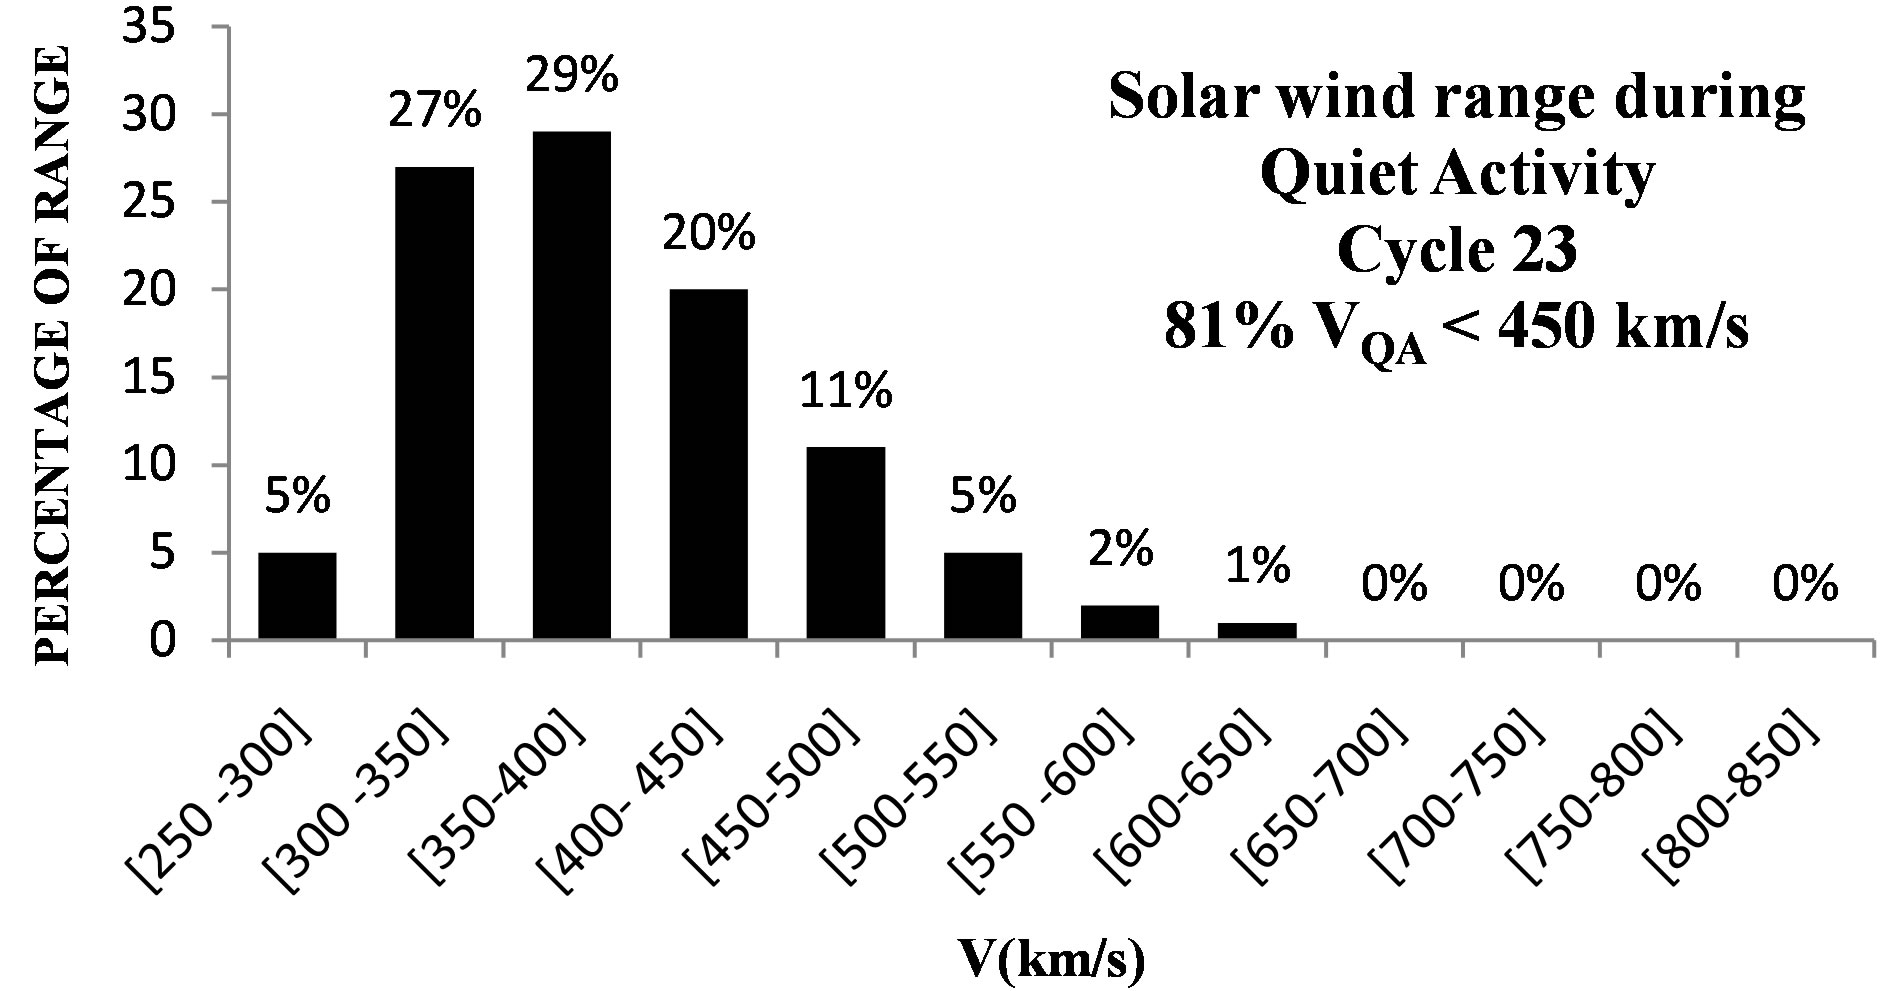 (d)
(d)
Figure 4. The range of solar wind speeds for quiet activity: (a) Solar cycle 20; (b) Solar cycle 21; (c) Solar cycle 22 and (d) Solar cycle 23.
 (a)
(a)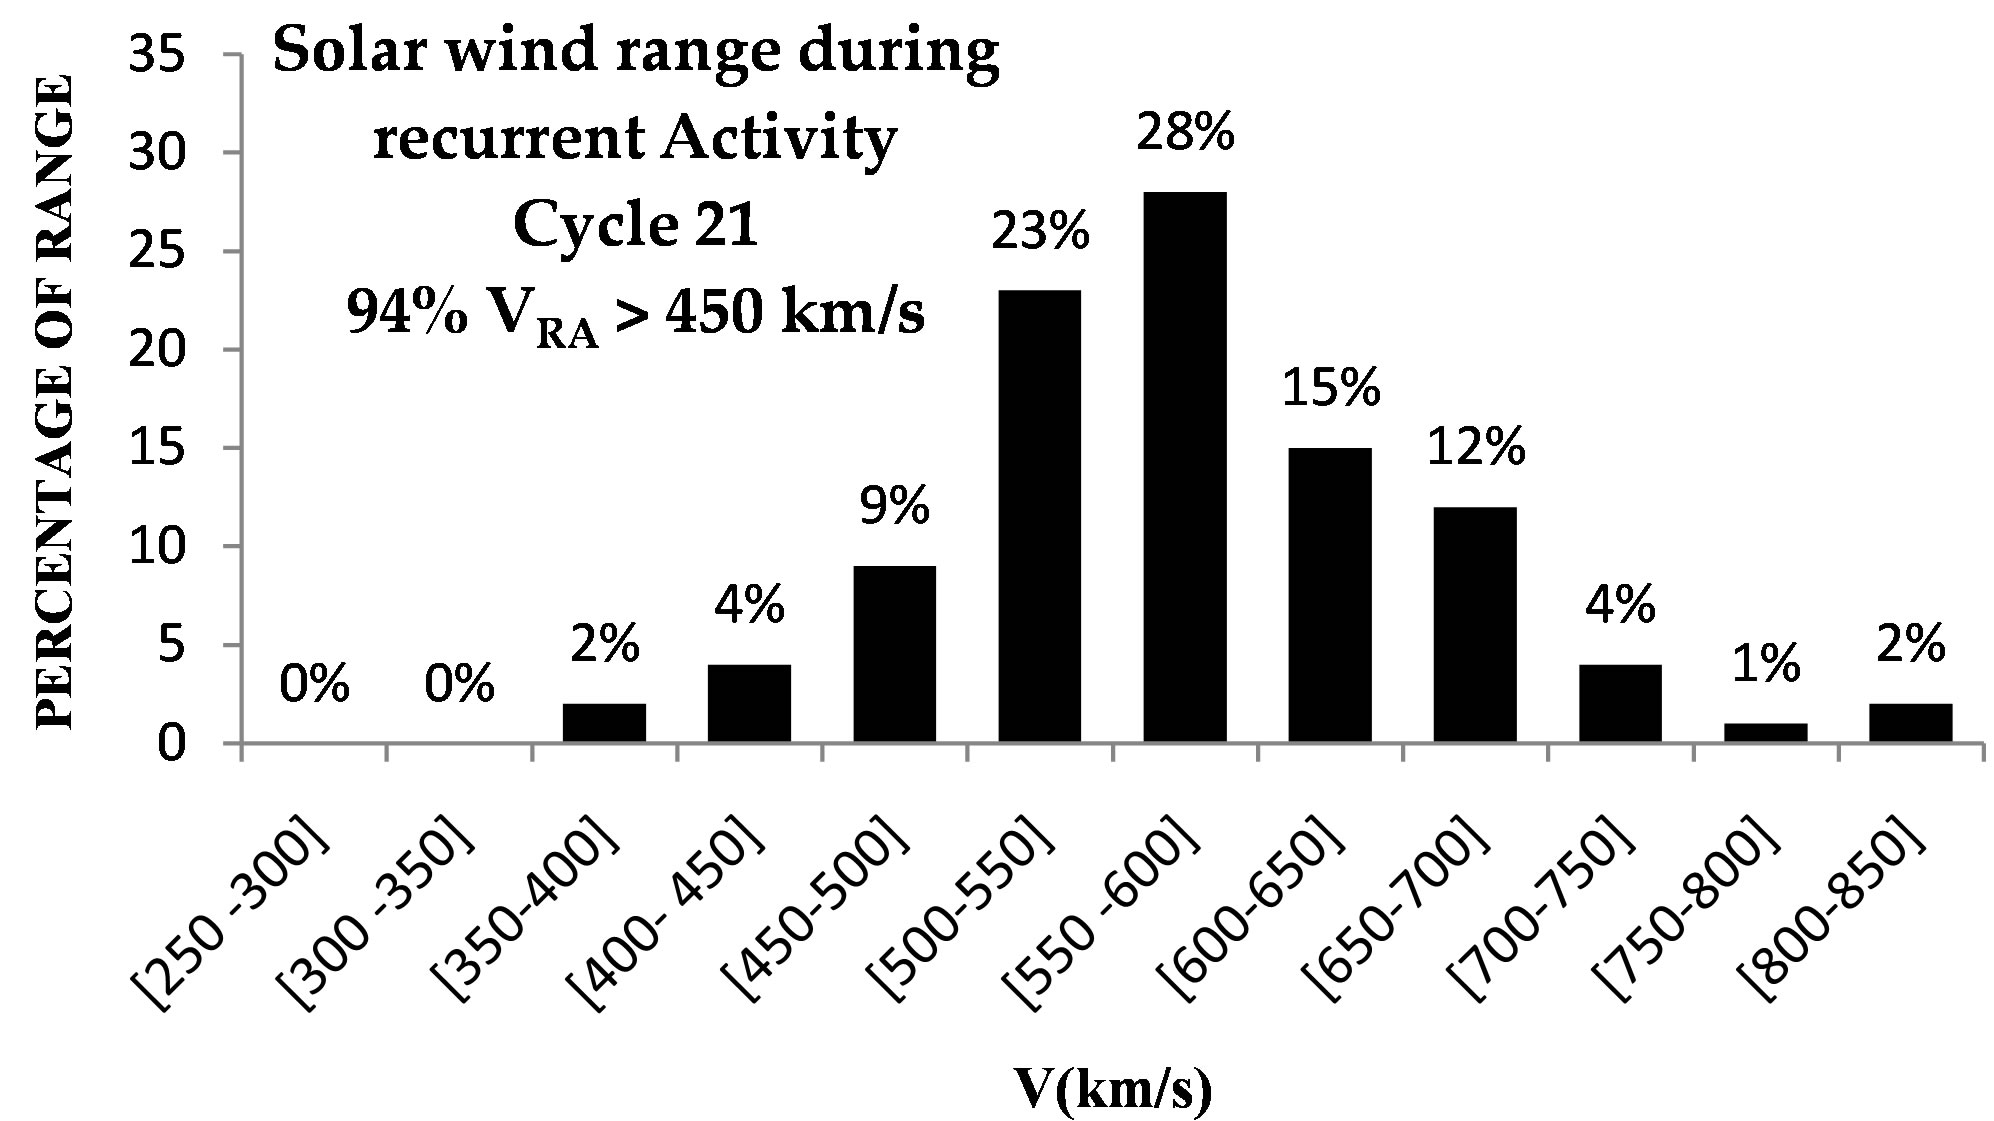 (b)
(b)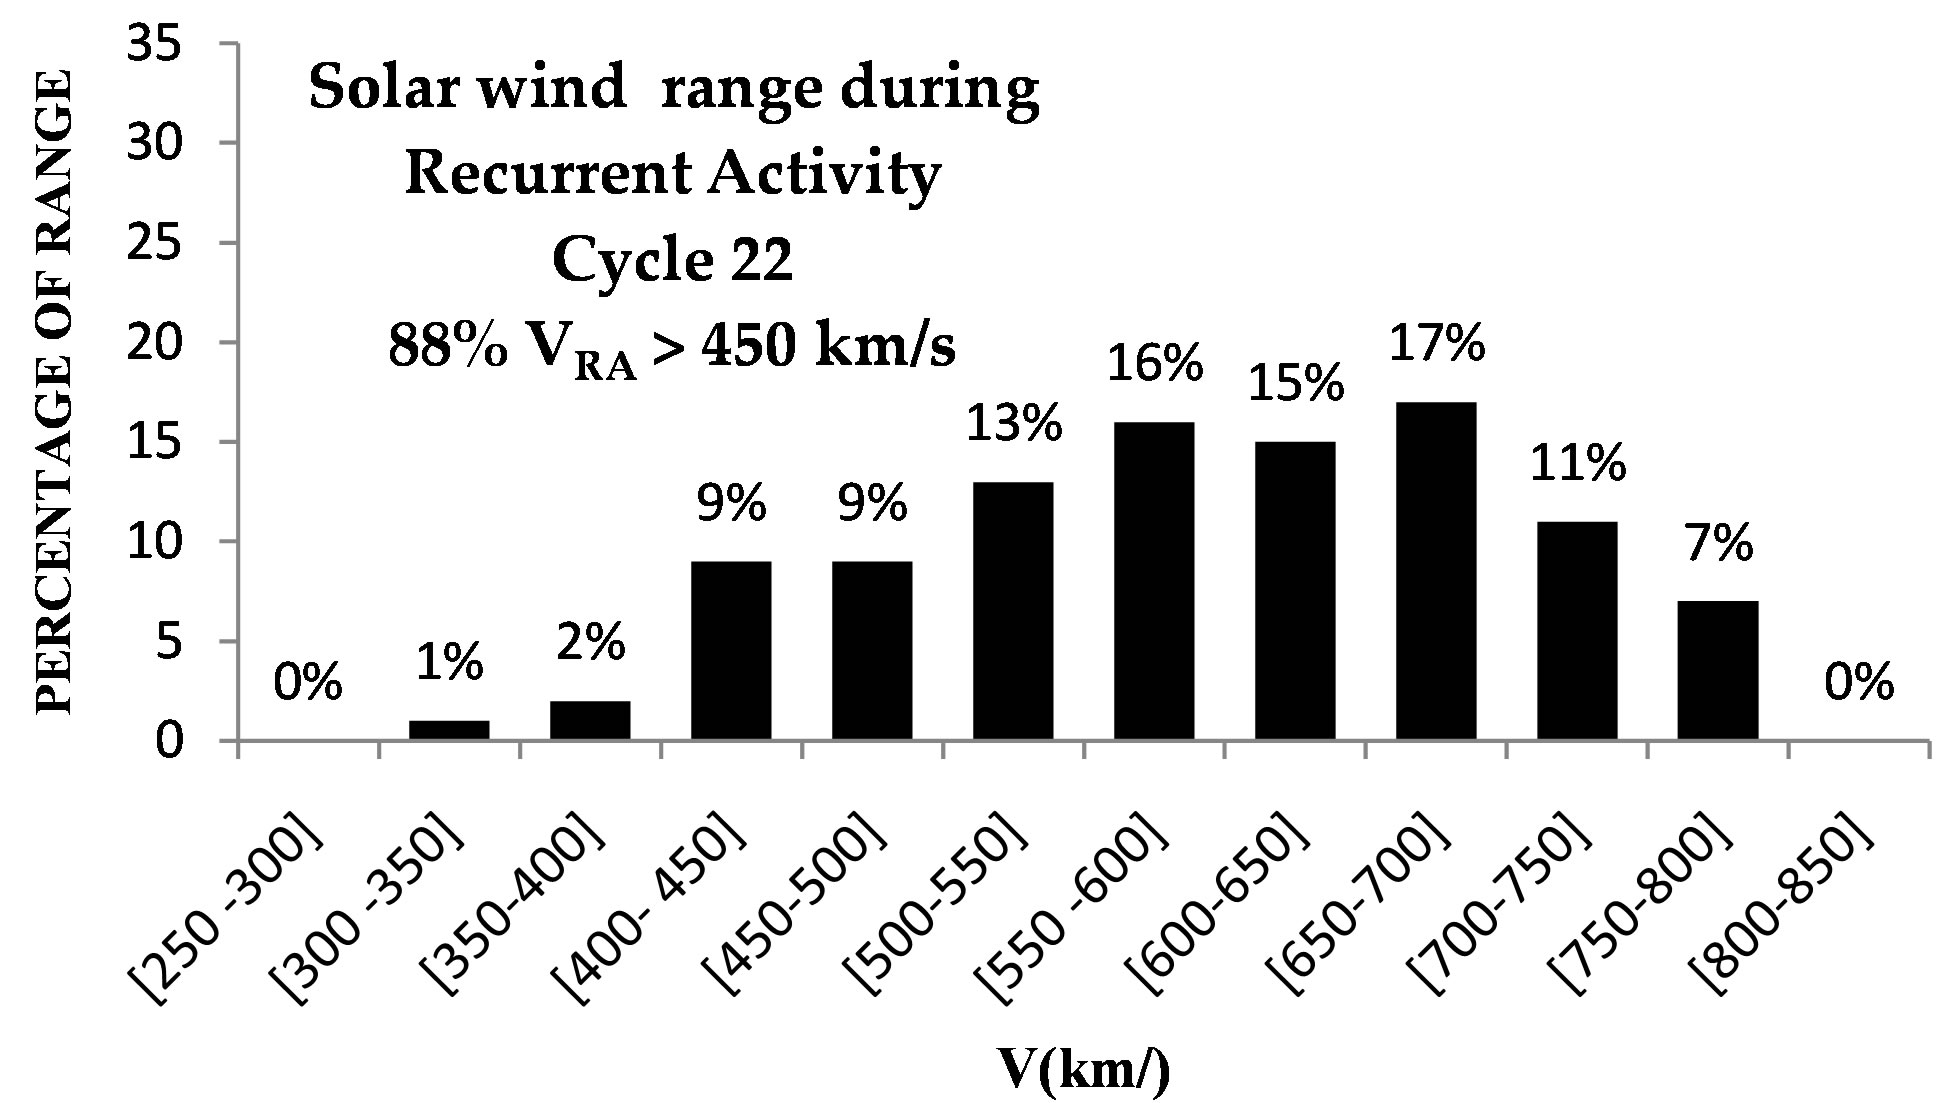 (c)
(c)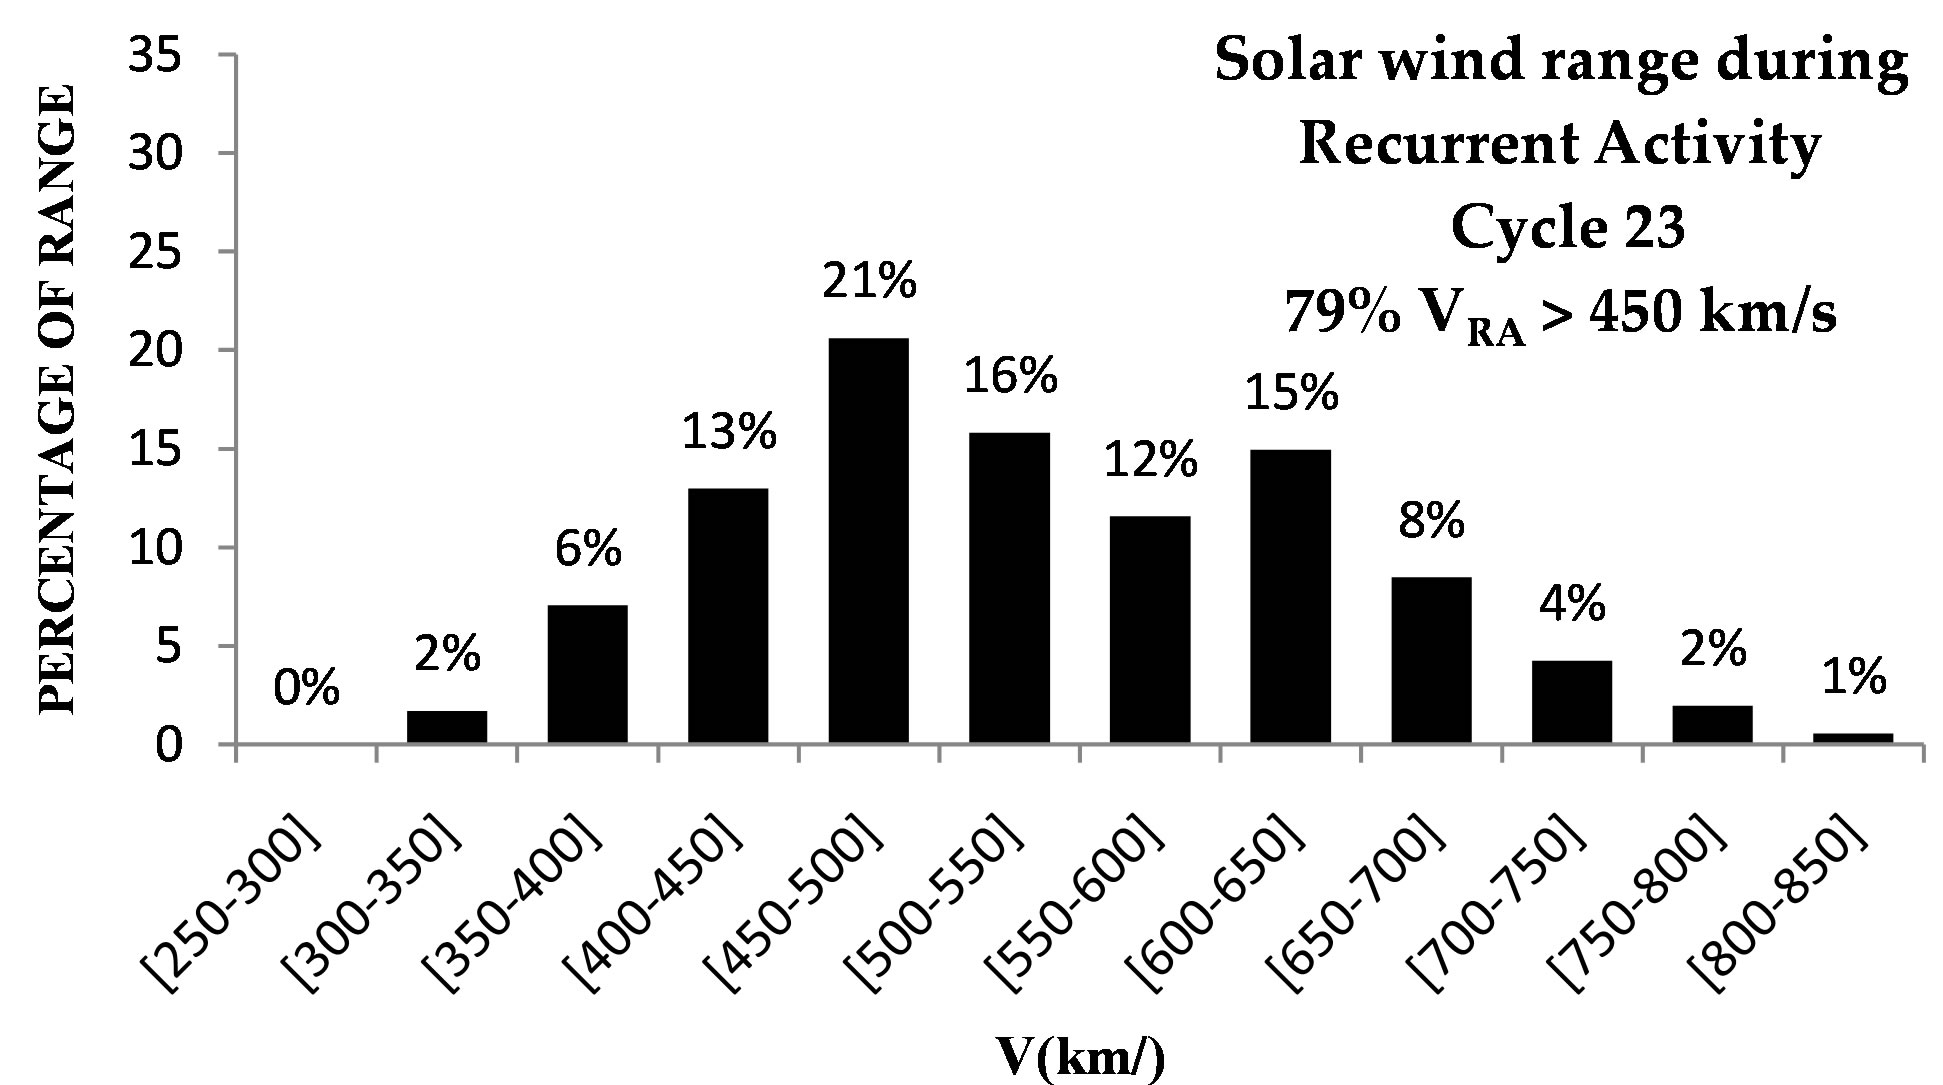 (d)
(d)
Figure 5. The range of solar wind speeds for recurrent activity: (a) Solar cycle 20; (b) Solar cycle 21; (c) Solar cycle 22 and (d) Solar cycle 23.
 (a)
(a)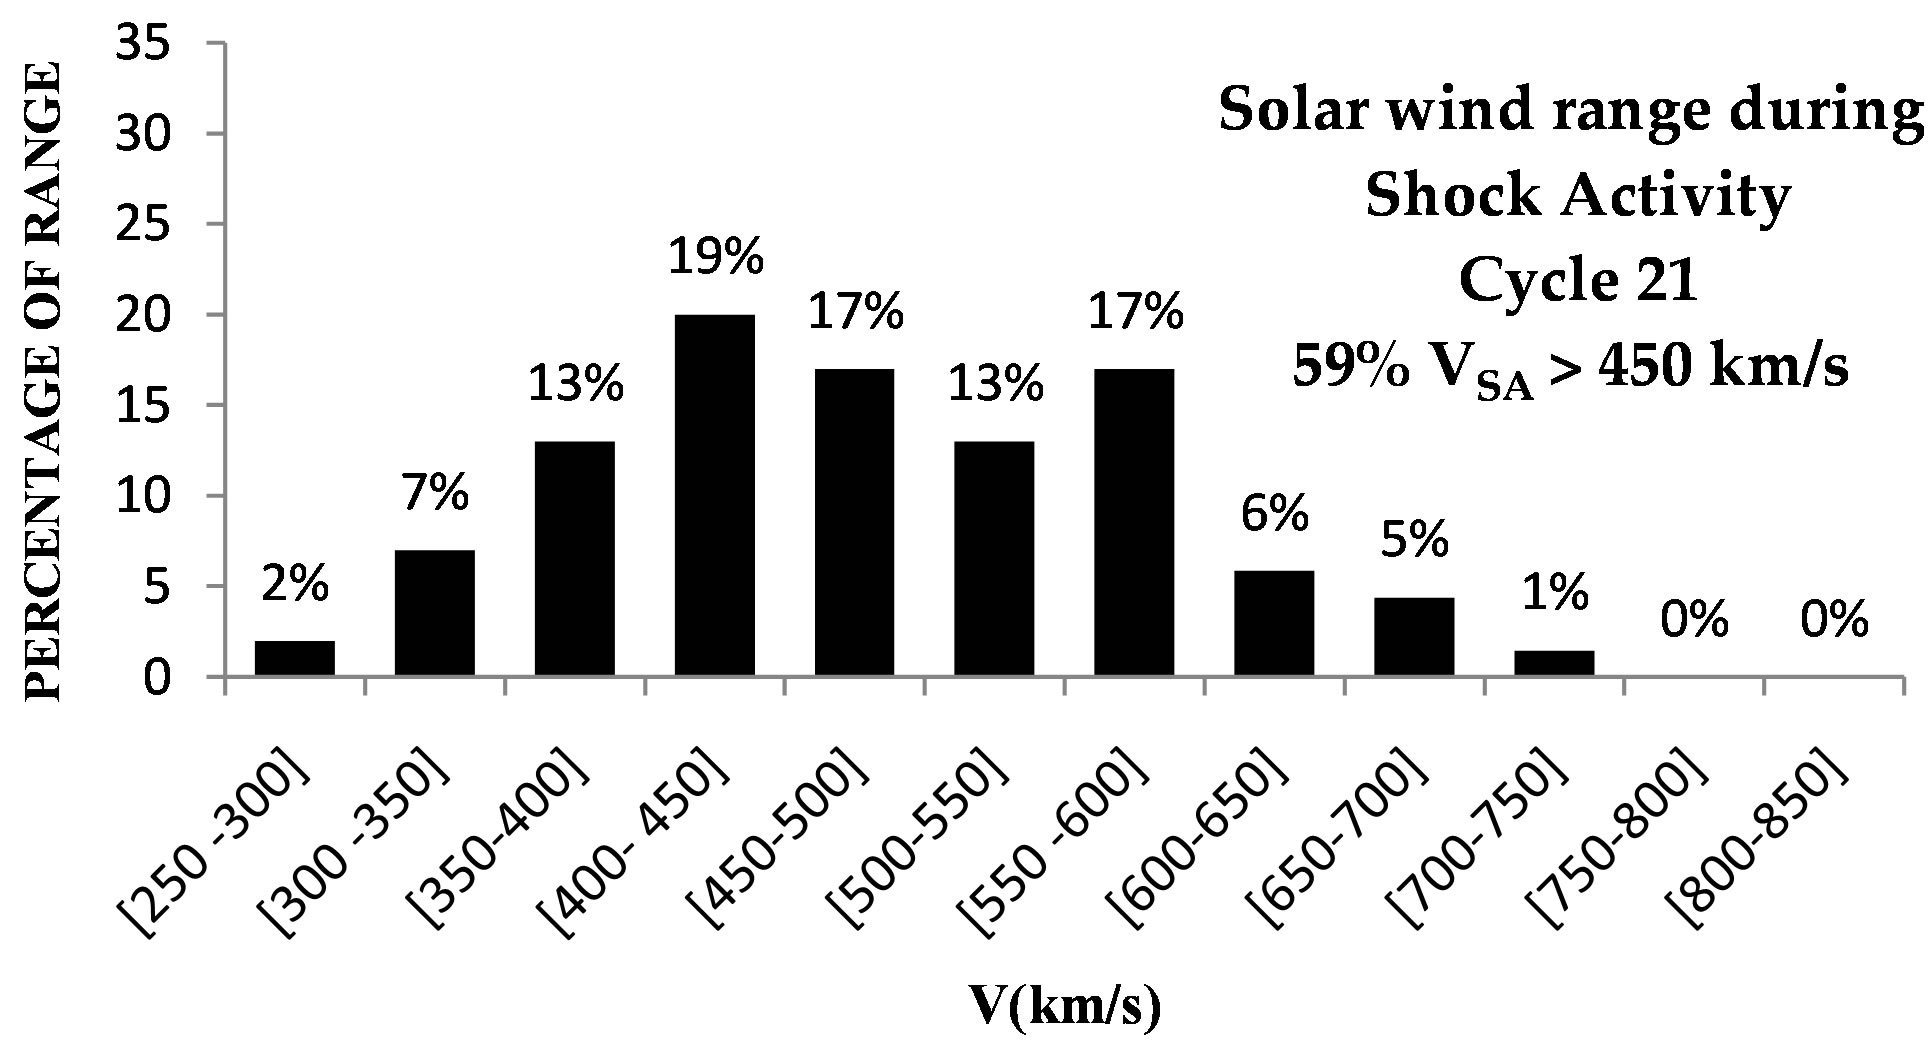 (b)
(b)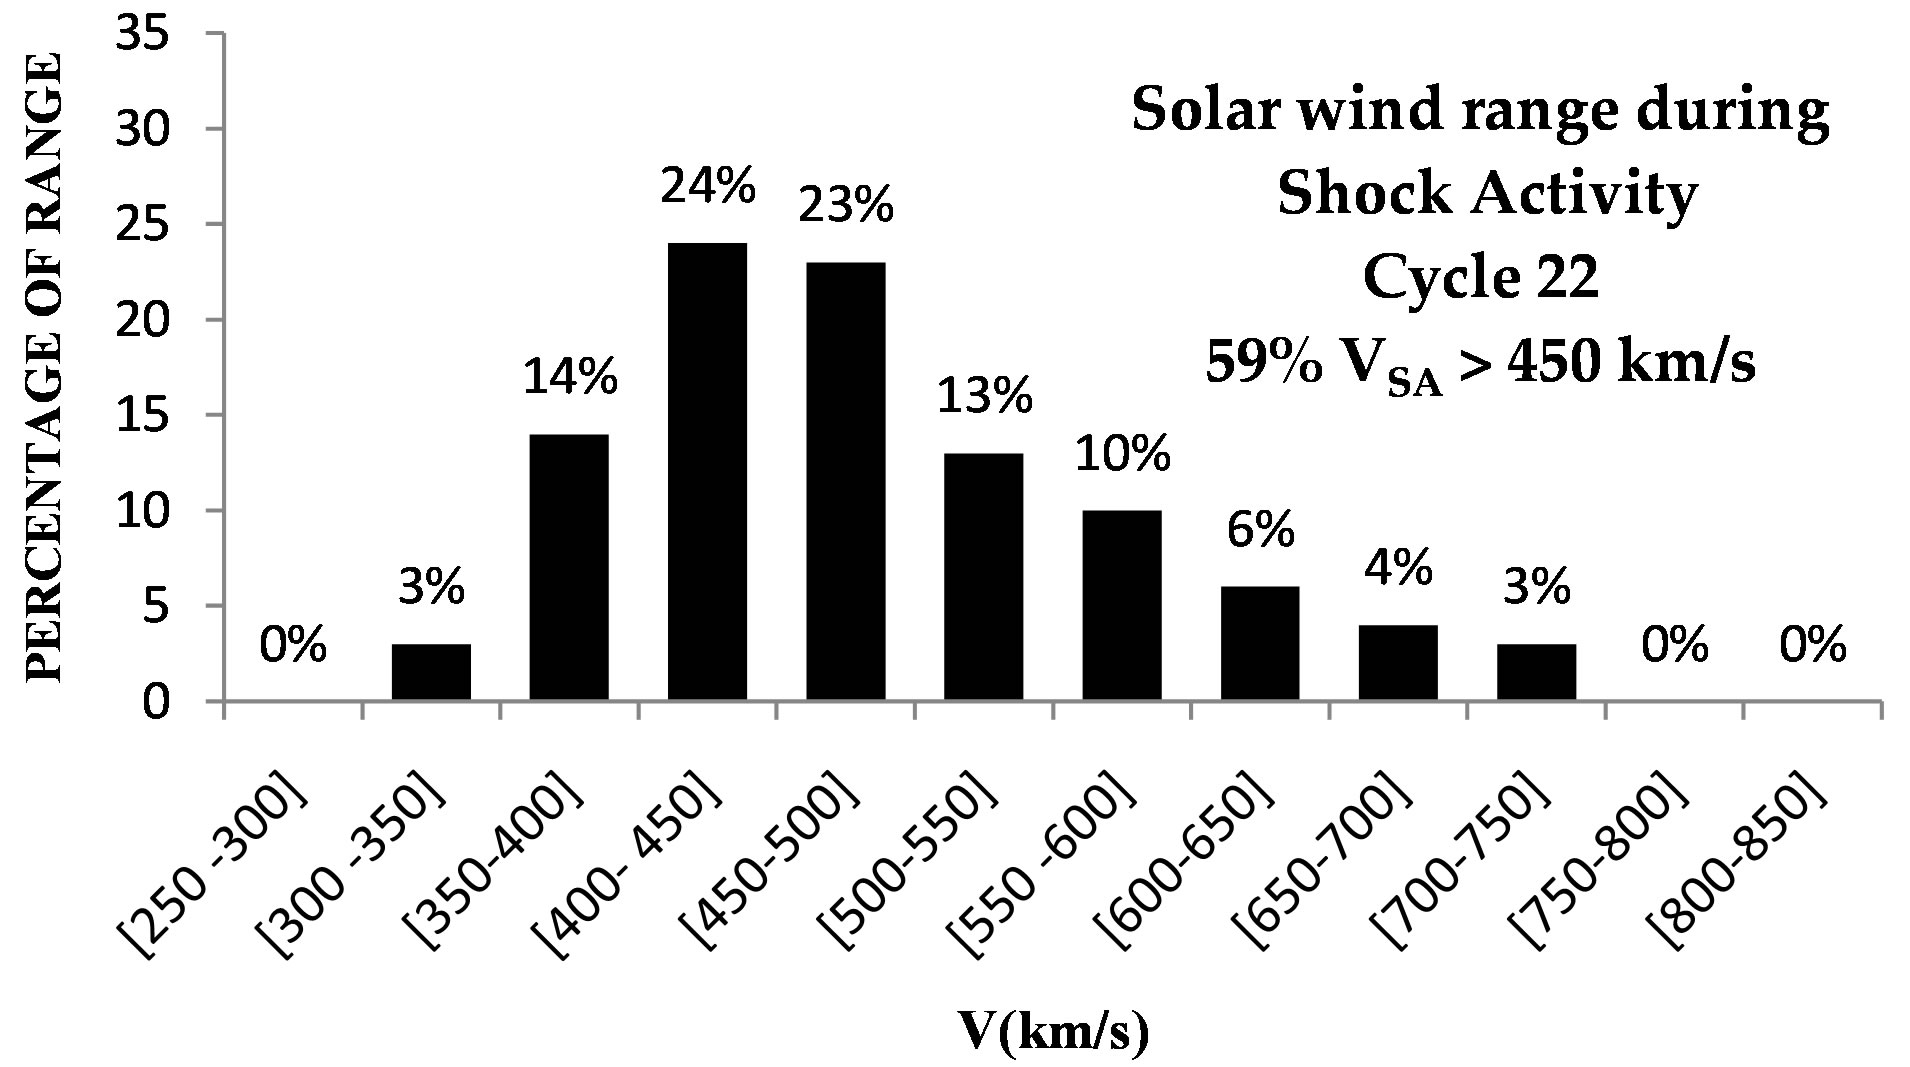 (c)
(c)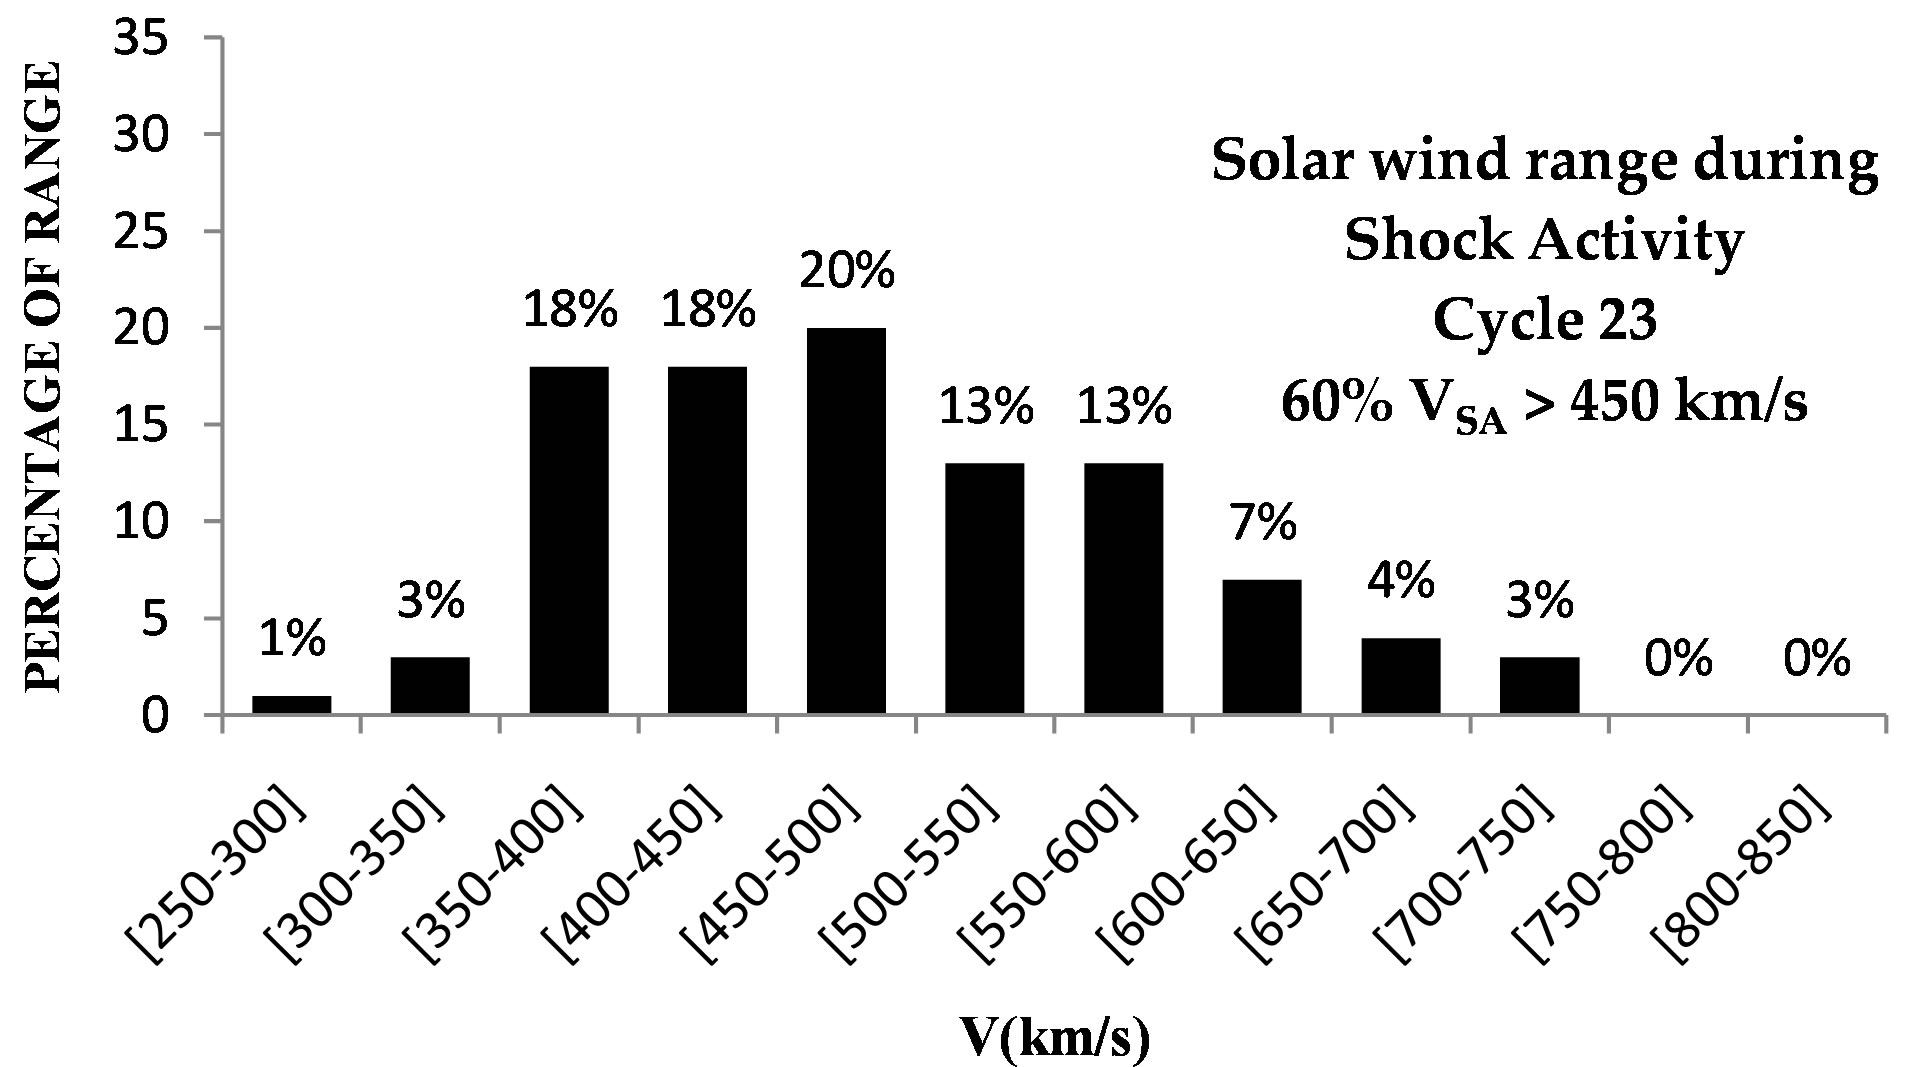 (d)
(d)
Figure 6. The range of solar wind speeds for shock activity: (a) Solar cycle 20; (b) Solar cycle 21; (c) Solar cycle 22 and (d) Solar cycle 23.
 (a)
(a)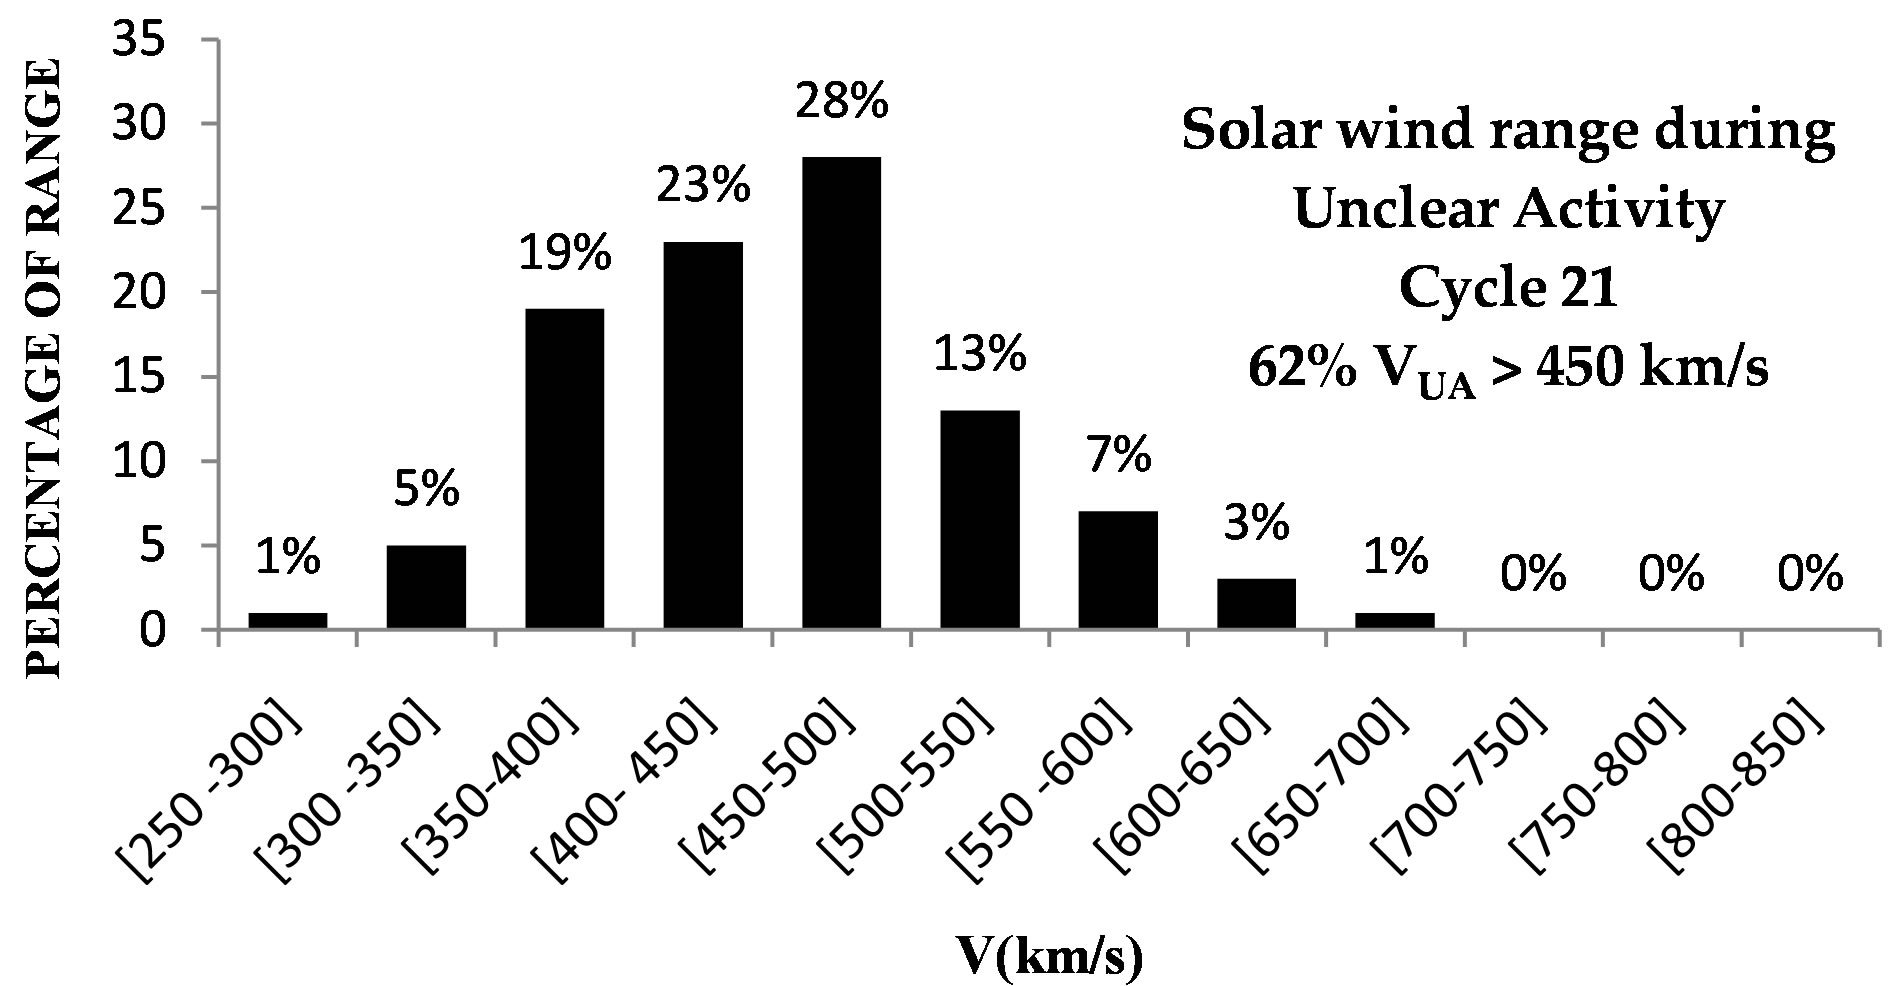 (b)
(b)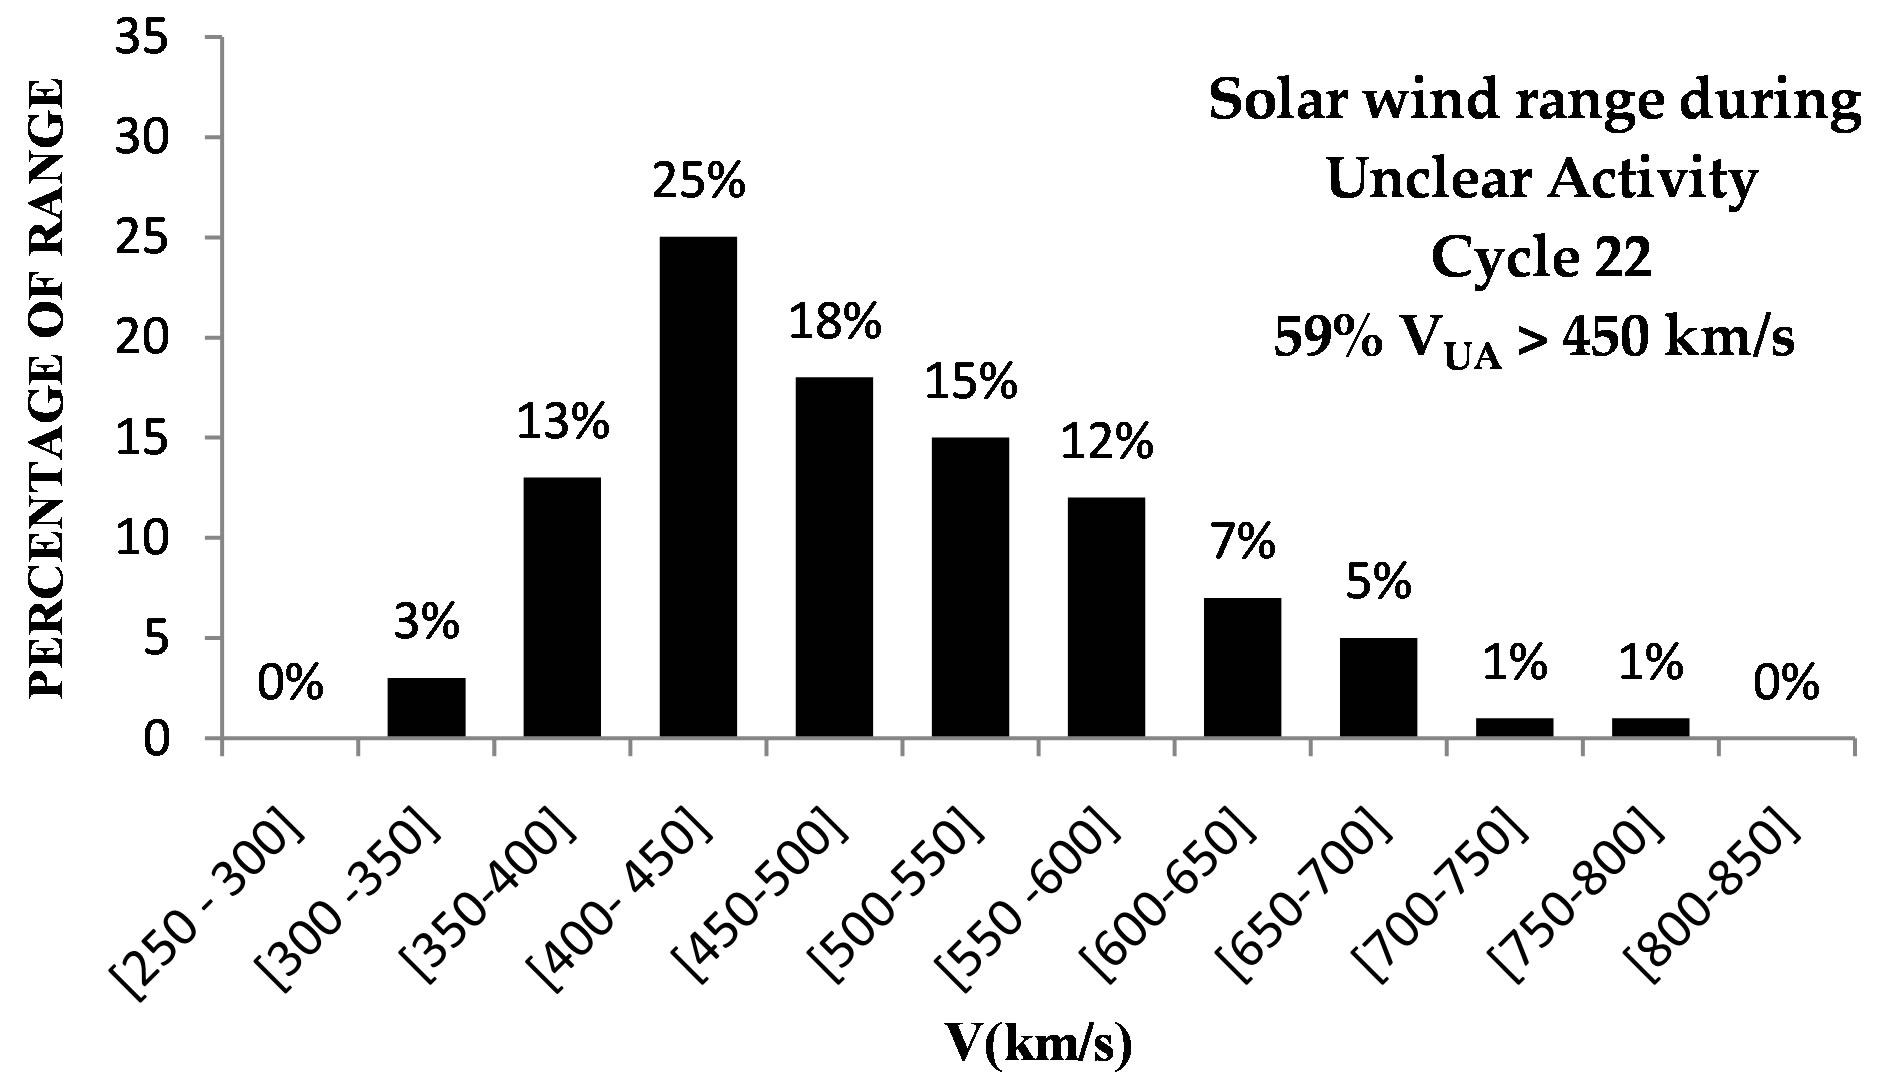 (c)
(c)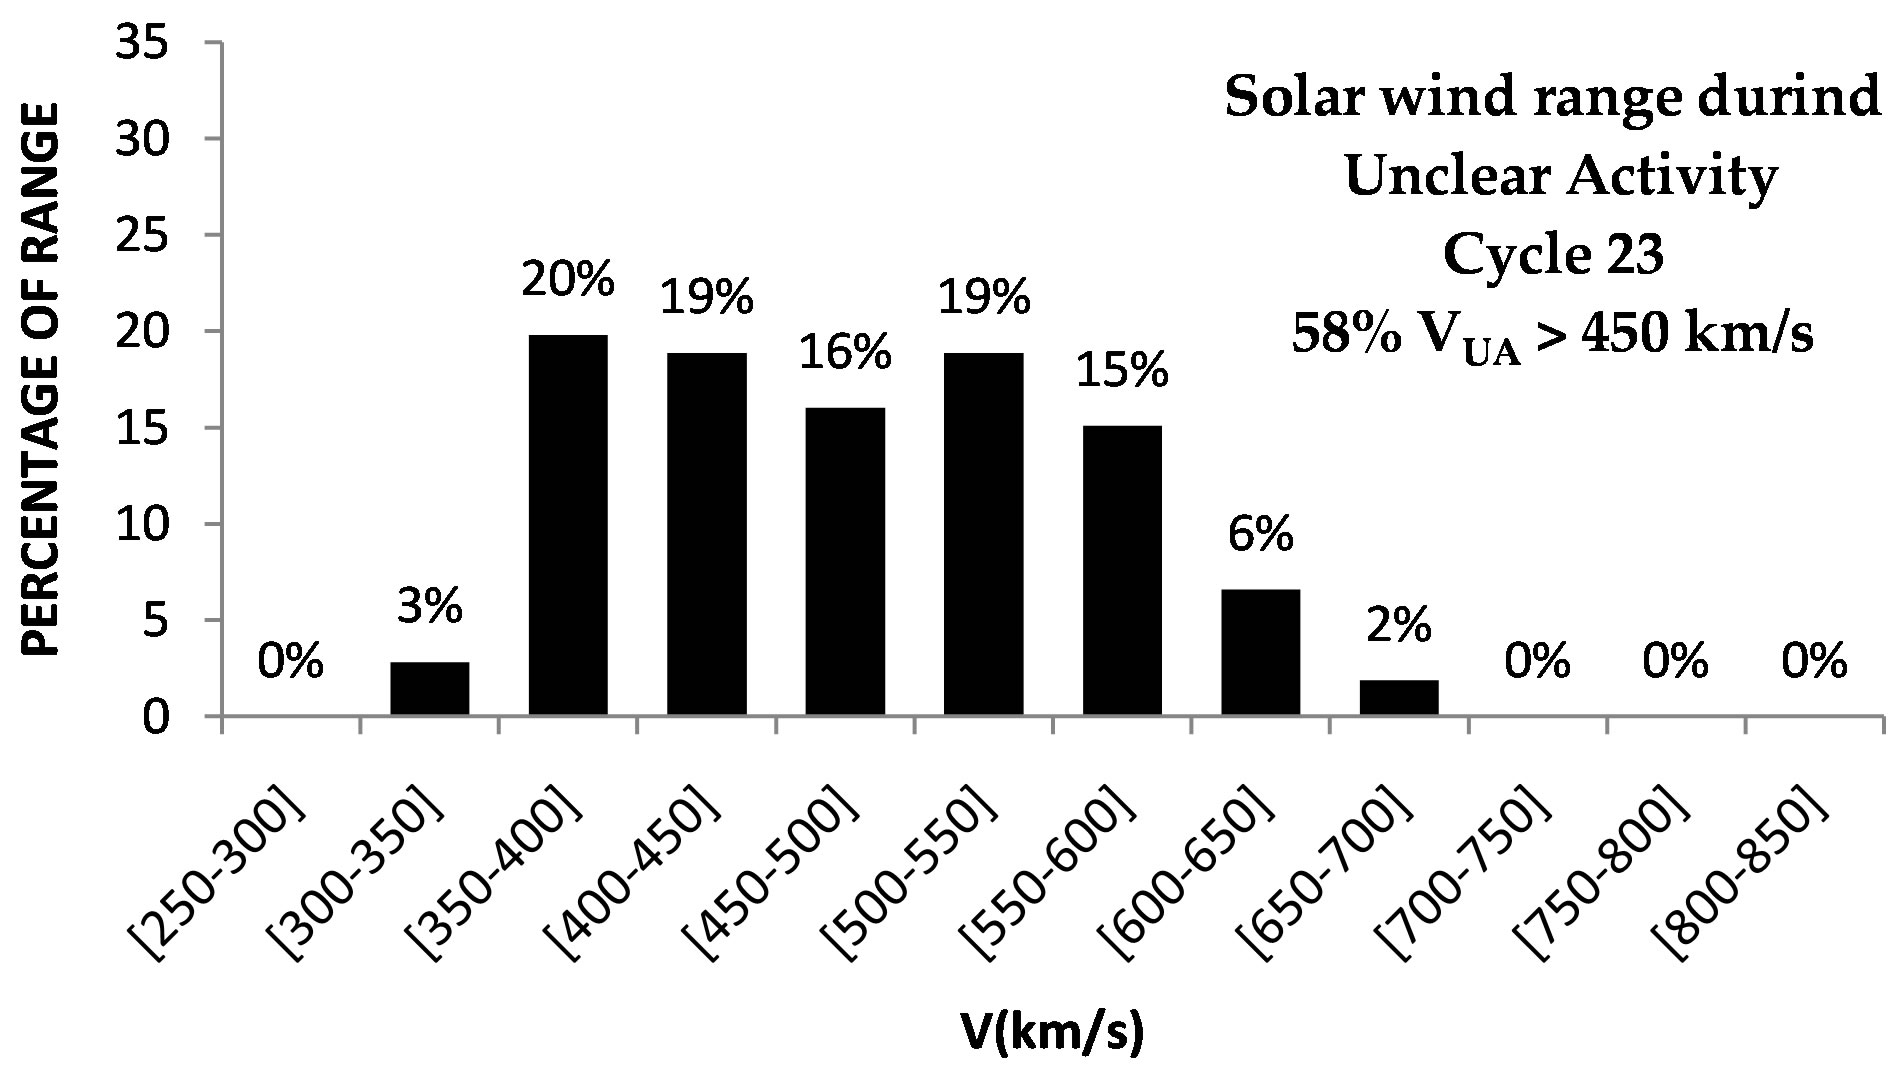 (d)
(d)
Figure 7. The range of solar wind speeds for unclear activity: (a) Solar cycle 20; (b) Solar cycle 21; (c) Solar cycle 22 and (d) Solar cycle 23.
QA is the most frequent geomagnetic class in solar cycle 23 with the highest percentages (91%) near solar minimum. UA is the second most frequent with the highest occurrence rate (57%) at the ascending phase of the solar cycle. SA is the least frequent class of activity and occurs mainly at the maximum and in the declining phase.
Figure 8 summarizes the contribution of each type of geomagnetic activity to the global activity during cycles 20, 21, 22, and 23. The high frequency of QA during cycle 23 in comparison with the other cycles may be due to the sudden increase of quiet magnetic days at the end of this cycle as shown in Figure 2. Cycles 20 and 23 have the highest frequency of recurrent events (RA). The highest level of shock activity (SA) is observed during cycle 21. Cycle 23 is largely under the influence of unclear events (UA).
We note that RA is caused by high wind speed streams ejected by coronal holes and RA is observed mainly in the declining phase of the sunspot solar cycle when the poloidal solar magnetic field component is maximal. The statistical study points out very interesting wind conditions for each class of geomagnetic activity: 1) For QA 95% of wind speed is about 399 ± 69 km/s, 2) For RA 95% of the wind speed is about 582 ± 110 km/s, 3) for SA 95% of the solar wind velocity is order of 482 ± 101.4 km/s, and 4) for FA 95% of wind speed is about 480 ± 85.82 km/s. These results which give in average the order of magnitude of wind speed into each geomagnetic class
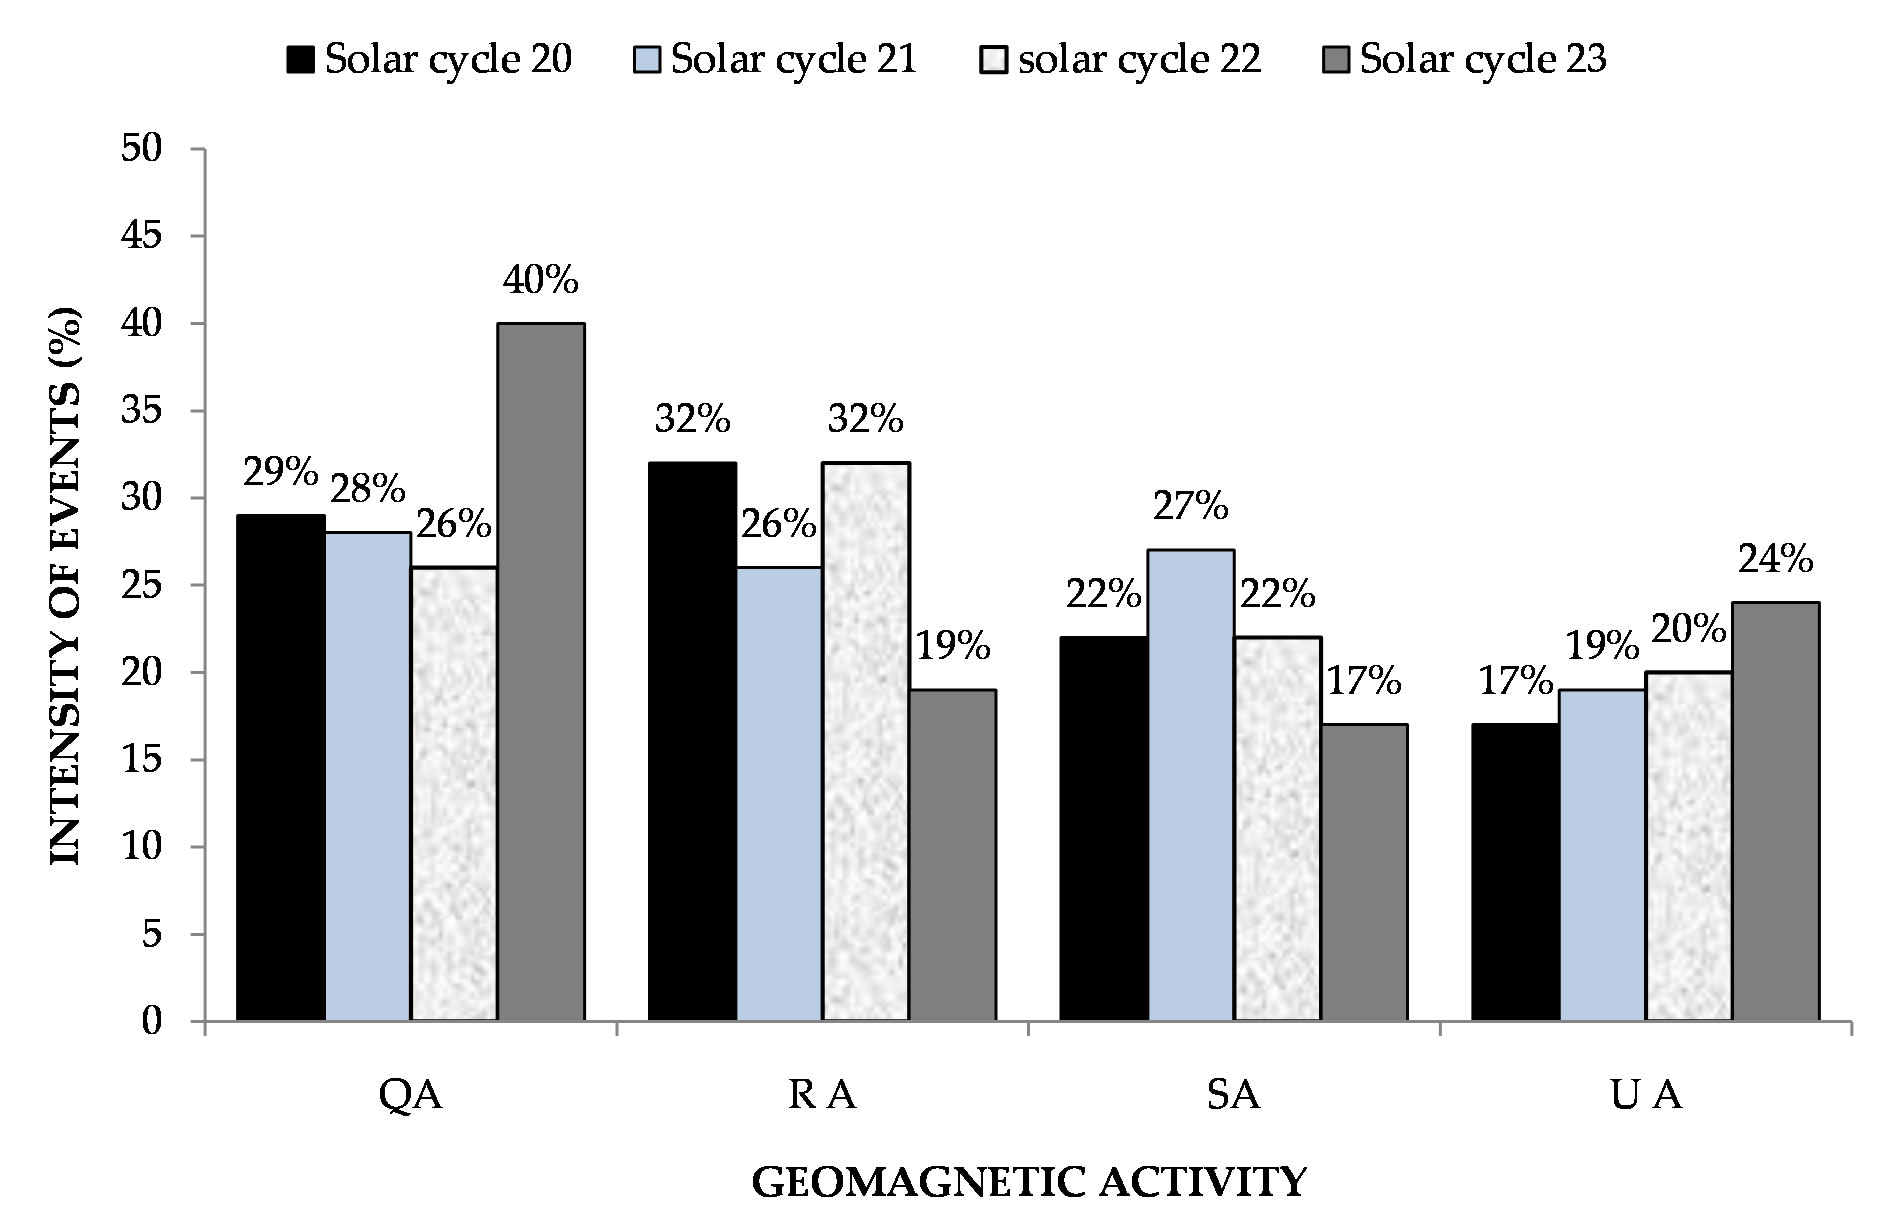
Figure 8. Global contribution of the four classes of geomagnetic activity during solar cycles 20, 21, 22, and 23.
are useful and prove the fact that RA is the effect of high solar wind stream; the QA is the effect of slow solar wind, and moderate and variable solar wind speeds are recorded during shock events. It means that SA doesn’t reflect the solar winds’ effects but the contribution of shock wave to geomagnetic activity. In addition, except for UA, the solar wind speed distributions are remarkably similar for the four solar cycles in each class of geomagnetic activity. Thus, the character of QA, RA, and SA does not change significantly from cycle to cycle.
Our study shows how similar slow solar wind distributions are for the four cycles. This result points out clearly that the process accelerating the slow wind does not change even though the solar wind flux is decreasing. Another interesting result is the drop in solar wind speed during RA in cycle 23 compare to the other cycles. The decrease in the RA speeds, with the most probably speeds down to 450 - 500 km/s from 550 - 600 km/s, shows the particularity of cycle 23.
Other major conclusions are that approximately 80% of solar wind V < 450 km/s for QA and about 80% of solar wind V > 450 km/s for RA, SA and UA present similar proportion with 60% of the solar wind V > 450 km/s.
These new results open the way to a more physical interpretation of the Sun-Earth relationship needed to understand geomagnetic activity and space dependences on solar activity. The study of the statistics of each geomagnetic class shows the need to refine the geomagnetic classification scheme to account for solar wind conditions.
This work shows that the magnetic signatures given by the aa index correspond to large scale physical process in the sun earth system: high speed solar wind related to coronal hole, CME, slow solar wind. With the use of this aa magnetic index, built since 1868, we can see the strong dependence on solar wind parameters and the effects of toroidal field in interplanetary medium [5,15-17]. Our present study could contribute to reconstructing the main features of solar events until 1868.
5. Acknowledgements
The authors thank all the members of LPP/CNRS/UPMC for their welcome. They thank Paul and Gérard VILA for their advice and collaboration.
The authors thank the NGDC data centre for providing the aa indices and the ACE data center for providing the solar wind velocity and IMF components. We express many thanks to Coopération Française and Burkina Faso for their financial help. JDR was supported by NASA’s Wind mission. We are obliged to the anonymous referees with help us to improve science. Special thanks to ACS editors.
REFERENCES
- J. P. Legrand and P. A. Simon, “Solar Cycle and Geomagnetic Activity: A Review for Geophysicists. Part I. The Contributions to Geomagnetic Activity of Shock Waves and of the Solar Wind,” Annales Geophysicae, Vol. 7, No. 6, 1989, pp. 565-578.
- P. A. Simon and J. P. Legrand, “Solar Cycle and Geomagnetic Activity: A Review for Geophysicists Part II. The Solar Sources of Geomagnetic Activity and Their Links with Sunspot Cycle Activity,” Annales Geophysicae, Vol. 7, No. 6, 1989, pp. 579-594.
- I. G. Richardson, H. V. Cane and E. W. Cliver, “Sources of Geomagnetic Activity during Nearly Three Solar Cycles (1972-2000),” Journal of Geophysical Research, Vol. 107, No. A8, 2002, pp. 107-118. http://dx.doi.org/10.1029/2001JA000504
- I. G. Richardson, E. W. Cliver and H. V. Cane, “Sources of Geomagnetic Activity over the Solar Cycle: Relative Importance of Coronal Mass Ejections, High-Speed Streams, and Slow Solar Wind,” Journal of Geophysical Research, Vol. 105, No. A8, 2000, pp. 200-213. http://dx.doi.org/10.1029/1999JA000400
- F. Ouattara, C. Amory-Mazaudier, M. Menvielle, P. Simon and J.-P. Legrand, “On the Long Term Change in the Geomagnetic Activity during the XXth Century,” Annales Geophysicae, Vol. 27, No. 5, 2009, pp. 2045-2051. http://dx.doi.org/10.5194/angeo-27-2045-2009
- F. Ouattara and C. Amory-Mazaudier, “Solar-Geomagnetic Activity and Aa Indices toward a Standard,” Journal of Atmospheric and Solar-Terrestrial Physics, Vol. 71, No. 17-18, 2009, pp. 1736-1748. http://dx.doi.org/10.1016/j.jastp.2008.05.001
- J. L. Zerbo, C. Amory-Mazaudier, F. Ouattara and J. Richardson, “Solar Wind and Geomagnetism, toward a Standard Classification 1868-2009,” Annales Geophysicae, Vol. 30, 2012, pp. 421-426. http://dx.doi.org/10.5194/angeo-30-421-2012
- P. N. Mayaud, “Une Mesure Planétaire d’Activité Magnétique Basée sur deux Observatoires Antipodaux,” Annales Geophysicae, Vol. 27, 1971, p. 71.
- P. N. Mayaud, “A Hundred Series of Geomagnetic Data, 1868-1967,” IAGA Bulletin, Vol. 33, Zurich, 1973, p. 251.
- P. N. Mayaud, “Deviation, Meaning, and Use of Geomagnetic Indices,” Geophysical Monograph Series, Vol. 22, Washington DC, 1980, p. 154.
- L. Svalgaard, “Geomagnetic Activity: Dependence on Solar Wind Parameters,” In: J. B. Zirker, Ed., Coronal Holes and High Speed Wind Streams, Colorado Association University Press, Boulder, 1977, pp. 371-432.
- P. A. Simon and J. P. Legrand, “A Two Component Solar Cycle,” Solar Physics, Vol. 131, 1992, pp. 187-209.
- J. P. Legrand and P. A. Simon, “Toward a Model of TwoComponent Solar Cycle,” Solar Physics, Vol. 141, 1991, pp. 391-410.
- J. Feynman and N. U. Crooker, “The Solar Wind at the Turn of the Century,” Nature, Vol. 275, No. 5681, 1978, pp. 626-627. http://dx.doi.org/10.1038/275626a0
- L. Svalgaard and E. W. Cliver, “Interhourly Variability Index of Geomagnetic Activity and Its Use in Deriving Long-Term Variation of Solar Wind Speed,” Journal of Geophysical Research, Vol. 112, No. A10, 2007, Article ID: A10111. http://dx.doi.org/10.1029/2007JA012437
- J. P. Legrand and P. A. Simon, “Some Solar Cycle Phenomena Related to the Geomagnetic Activity from 1868 to 1980, I. The Shock Events, or the Interplanetary Expansion of the Toroidal Field,” Astronomy and Astrophysics, Vol. 152, No. 2, 1985, pp. 199-204.
- P. N. Mayaud, “The aa Indices: A 100-Year Series Characterizing the Magnetic Activity,” Journal of Geophysical Research, Vol. 77, No. 34, 1972, pp. 6870-6874. http://dx.doi.org/10.1029/JA077i034p06870
NOTES
*Corresponding author.