International Journal of Geosciences
Vol.4 No.10(2013), Article ID:41579,8 pages DOI:10.4236/ijg.2013.410147
Landslide Hazard Zonation in NH-1A in Kashmir Himalaya, India
Department of Earth Sciences, Manipur University, Imphal, India
Email: chingkhei@gmail.com, arun634@gmail.com
Copyright © 2013 R. K. Chingkhei et al. This is an open access article distributed under the Creative Commons Attribution License, which permits unrestricted use, distribution, and reproduction in any medium, provided the original work is properly cited. In accordance of the Creative Commons Attribution License all Copyrights © 2013 are reserved for SCIRP and the owner of the intellectual property R. K. Chingkhei et al. All Copyright © 2013 are guarded by law and by SCIRP as a guardian.
Received October 3, 2013; revised November 27, 2013; accepted December 13, 2013
Keywords: Landslide Hazard Zonation; Landslide Hazard Management; GIS
ABSTRACT
The paper presents a methodology for landslide hazard zonation mapping using GIS and remote sensing data. The study has been carried out along NH-1A-Udhampur to Banihal in Kashmir Himalaya as this terrain is prone to the landslide hazards. The present study has been made to derive and identify the important terrain factors contributing to landslide occurrences in the region and corresponding thematic data layers are generated in GIS domain. These terrain data are collected from the topographic maps, satellite imageries, field visits and available published maps. A GIS database is prepared by digitizing these maps along with tabular data and their corresponding weightage is assigned using Analytic Hierarchy Process (AHP) based criteria ranking method for determining the standardized scores of criteria expressing their factor of importance for a given decision problem in terms of thematic parameters, categories and their normalized weights. Statistically integrating weightages from these thematic maps, a specific landslide hazard map was developed on a GIS platform. The resulting landslide hazard zonation map delineates the area into different zones of six classes of landslide hazard zones i.e., severe, very high, high, moderate, low and very low.
1. Introduction
Landslides are among the most common natural hazards and are the most damaging, leading to a variety of human and environmental impacts. Though there are various steps involved in minimization of landslide hazard, there efforts are made to emphasize only landslide hazard zonation mapping. A Landslide Hazard Zonation (LHZ) map depicts division of land surface into zones of varying degree of stability based on the estimated significance of the causative factors in inducing instability. The LHZ maps have an important role in planning and implementation of development schemes in mountainous areas [1]. Landslide is the result of a wide variety of processes which include geological, geomorphologic and meteorological factors. The main factors which influence land sliding are discussed by Varnes [2] and Hutchinson [3]. Normally, the most important factors are bedrock geology (lithology, structure and degree of weathering), geomorphology (slope gradient, aspect, and relative relief), soil (depth, structure, permeability, and porosity), land use and land cover, and hydrologic conditions. Landslides are triggered by many causative factors. Most landslide-triggering factors can be divided into four main categories including geological, hydrological, topographical factors and loading conditions. Landslide hazard is a particular case of natural hazard defined as “the probability of occurrence within a specified period of time and within a given area of a potentially damaging phenomenon” [2]. From the experience of the USGS, the definition of a “landslide hazard map” includes “zonation showing annual probability (likelihood) of landslide occurring throughout an area”. Over the past few years, Geographic Information System (GIS) has gained significant importance for spatial data analysis. It has been proved to a very powerful tool for landslide study. In recent years, GIS has been employed globally for spatial data analysis for landslide hazard zonation mapping [4-11]. Many parts of Jammu and Kashmir are vulnerable to landslide. The JammuSrinagar National Highway gets blocked at a number of places during the monsoons, due to landslides. It is worth mentioning that the Ramban-Banihal stretch of the highway has become one of the most affected portions.
The present paper deals with thematic data layer generation and their spatial analysis in GIS environment for landslide hazard zonation mapping along NH-1A-Udhampur to Banihal. This zone is known among the most landslides sensitive zones in the world. The major objectives of the study are 1) to prepare various thematic layers including lithology, geomorphology, lineament, fault, percent slope, slope morphology, slope aspect, drainage, landslide incidence, soil texture, soil depth, rock weathering, slope-dip relation, landuse/landcover from various sources in GIS domain; 2) to collect detailed field information about major landslides and soils of the area in order to generate a soil & terrain information system. GIS layer generation of all the thematic maps and their integration using ArcGIS software and 3) to prepare landslide hazard zonation maps through the integration of various thematic maps using Landslide Information System (LIS) software based GIS environment and to prepare landslide hazard management maps.
2. Study Area
The study area is located along the National Highway NH-1A from Udhampur to Banihal. The extent of this study area lies between 32˚53' to 33˚28'N Latitude and 75˚5' to 75˚22'E Longitude (Figure 1). The study area falls under the Survey of India (SOI) toposheets No: 43P1, 43O4, 43O8, 43O3and 43O7. In the present study various zones have been marked as most hazardous that may cause severe disasters in future and may affect the local inhabitants in and around the area extending from Udhampur to Banihal on one hand and may cause serious disruption of traffic on strategic Jammu Srinagar Highway on the other. This zone is known among the most landslides sensitive zones in the world. The area shows a hilly topography with an average altitude of 2740 meters above MSL.
The area experiences hot summers and severe winters. Temperature is lowest between November & February when the minimum night temperature touches zero degree in the hill area and 3˚C - 4˚C in the outer plain area. Temperature rises from March onward. It becomes unbearable during May-June. Maximum day temperature in June touches sometime 47˚C in the outer plain and about 30˚C - 35˚C in the hills. Most of the rainfall is received through the southwest monsoon which lasts from the last week of June to end of September. During the remaining period, rainfall is sporadic and scanty. Average annual rainfall is about 1052 mm.
3. Methodology
Different thematic layers corresponding to the causative factors that are responsible for the occurrence of landslides in a region were prepared from the Remote Sensing data and the Survey of India (SOI) topographic maps along with field data in GIS domain using ArcGIS and ERDAS. The integration of these thematic layers with weights assigned according to their relative importance in a GIS environment leads to the generation of a Zonal hazard map [11-14]. The detailed methodology adopted in the present study is represented in the form of a flow chart as below (Figure 2).
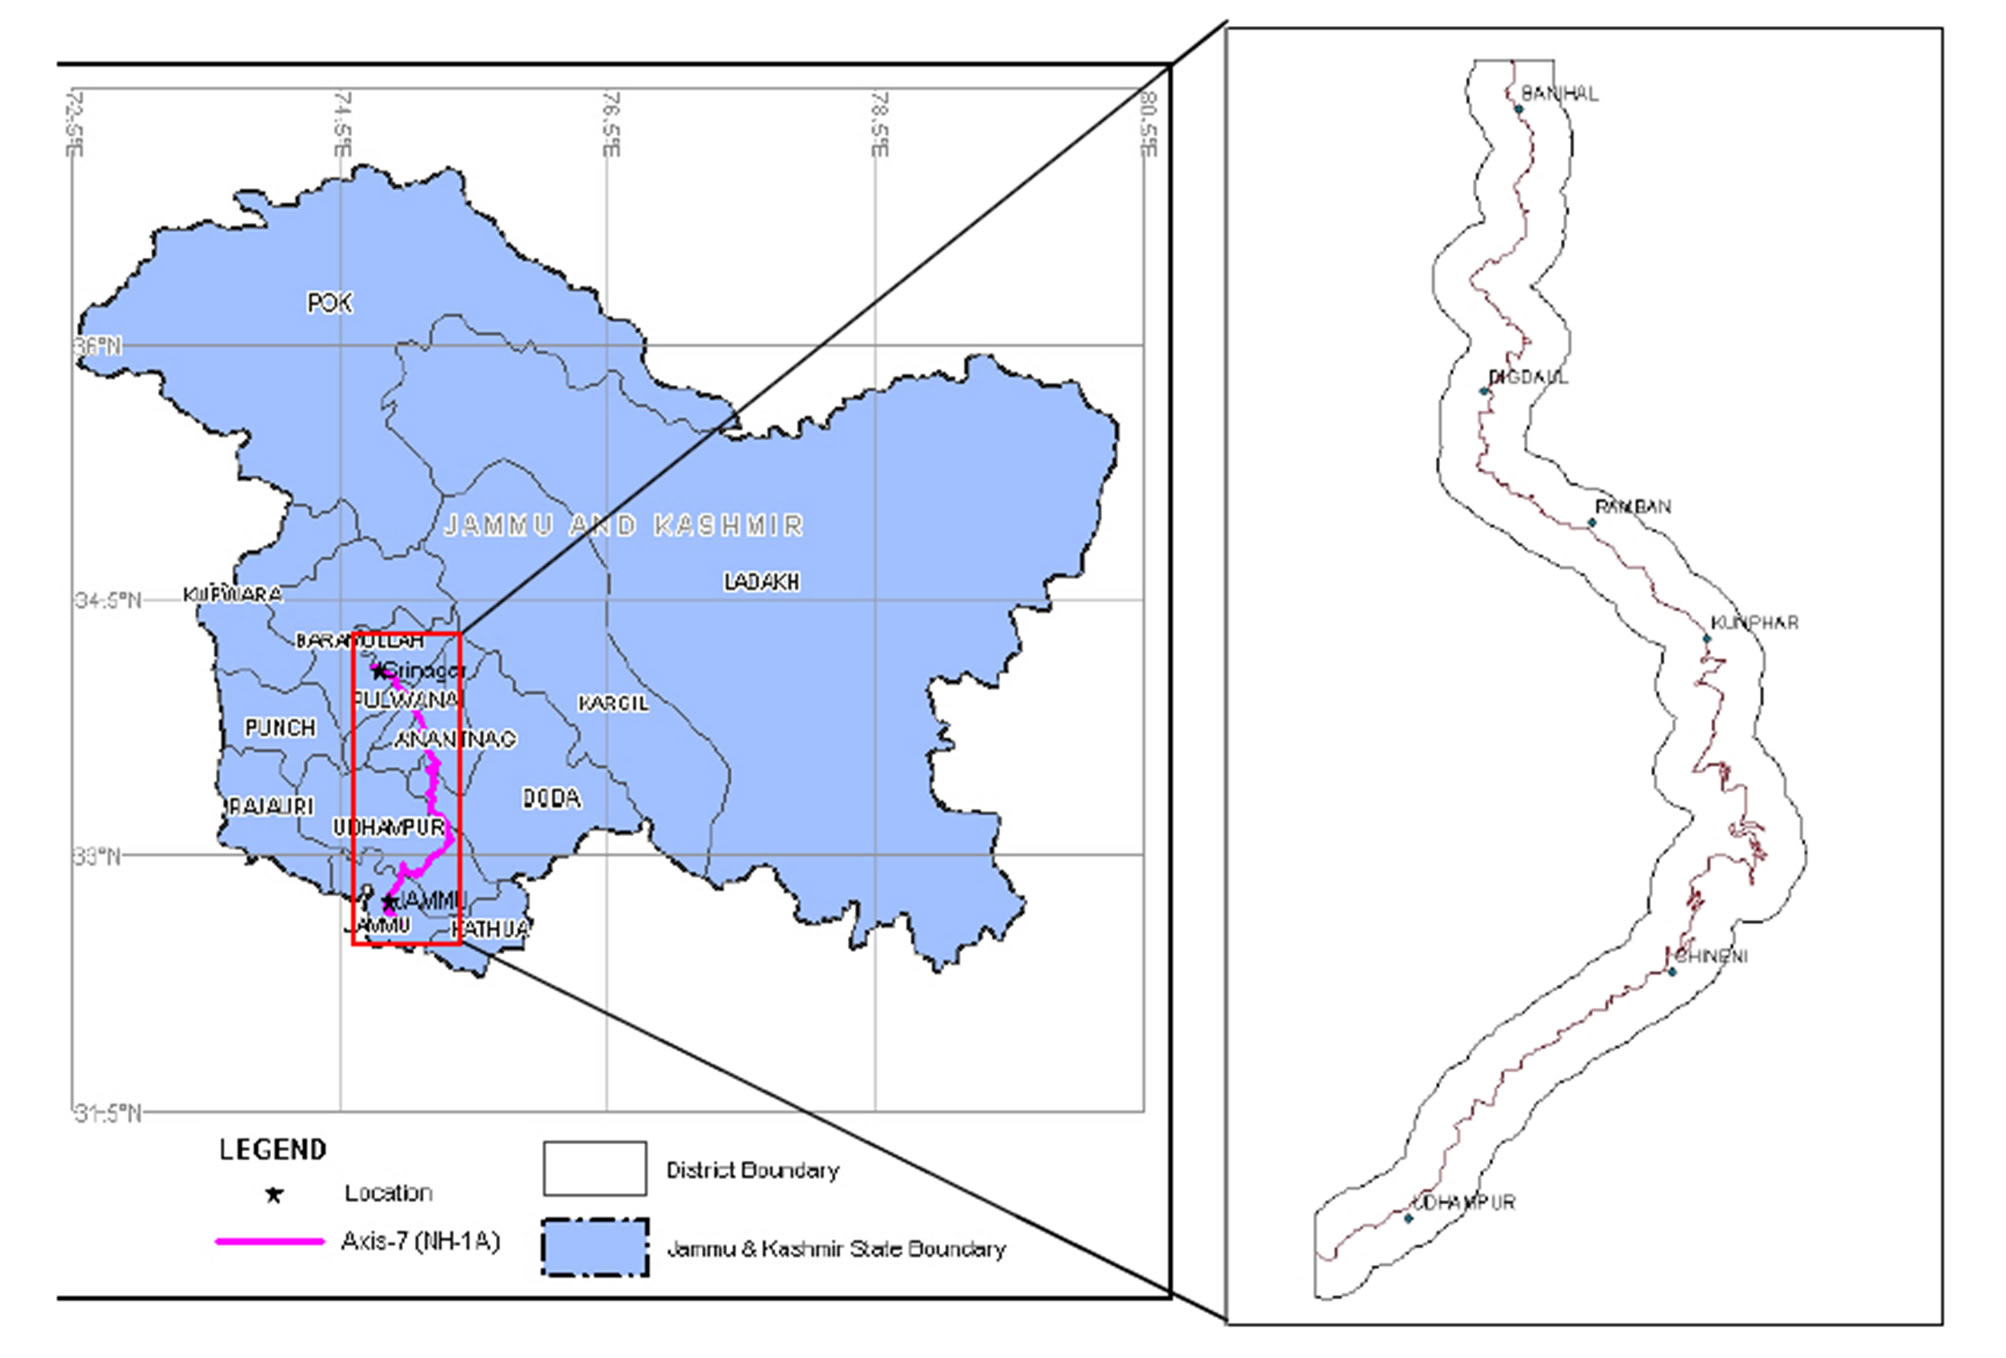
Figure 1. Location Map of the Study Area.

Figure 2. Flow chart of the steps involved in the present study.
3.1. Preparation of Input Layers
Input Thematic layers were prepared in GIS domain using ARCGIS and ERDAS. These thematic layers are prepared from various sources like the SOI topographic maps (1:50,000 scale), Remote Sensing data (IRS P6L-3 satellite data, Google earth images etc.), Geological maps supplied by Geological Survey of India, soil maps supplied by National Bureau of Soil Survey and Landuse Planning, climate and earthquake data supplied by India Meteorological Department (IMD) and other related data, published literatures and field investigation data have been used during the course of this study. Altogether 20 thematic inputs have been prepared for the present study.
3.2. Digitization and GIS Layer Generation
The digitization/scanning and GIS layer generation work was carried out using ARCGIS. The codes or IDs of different thematic maps were assigned as per the standard code scheme worked out by Department of Space, Government of India in consultation with other leading Organizations, Institutions and Universities working in the field of terrain studies and landslide modeling in Himalayas. Trunk stream (main river) were depicted as single digitization. The base details pertaining to each individual map sheet were generated on 1:50,000 scale in three different layer viz. Base-poly, Baseline and Base-point. Roads were shown in Baseline layer, settlement was shown in Base-point layer and major rivers were shown in base poly layer in polygon feature type. The lineaments and faults were classified as per length. All the sheets were edge matched and in some of the themes the maps of entire area was generated and thereafter they have been clipped sheet wise in order to integrate maps of each individual map sheet.
4. Results and Discussion
4.1. Thematic Data Layers
Selection of factors and preparation of corresponding thematic data layers are crucial components of any model for landslide hazard zonation and management mapping. The factors governing instability in a terrain are primarily geology, slope morphology, drainage, land use, anthropogenic activity, and climatic condition. These factors can be broadly grouped into two categories—the preparatory factors which make the slope susceptible to movement and the triggering factors which set off the movement [15]. The triggering factors such as rainfall and earthquakes, whose magnitude and temporal behavior are difficult to gauge, could not be considered here due to non-availability of past records regarding landslide occurrence. The factors considered in our study are essentially the preparatory factors for which pertinent data can be collected from available resources as well as from the field. These include slope, aspect, lithology, soil data, drainage density, lineament density, presence of faults, land use and landcover. The selection of these factors and their classes is primarily based on the field observations of existing landslides and their associated terrain factors. Based on the information collected from available maps, satellite data, and field investigations the thematic data layers are generated. The mapping was done at a scale of 1:125,000. The details of these layers are described in the following paragraphs.
4.2. DEM and Its Derivatives
In the present study the 30 m AsterDEM (Figure 3) has been used to generate the slope and aspect map of the

Figure 3. DEM showing the elevation classes in the study area. Black stars indicate the landslide sites in the study area.
region. The slope map is classified into 7 classes (0 - 15, 15 - 25, 25 - 30, 30 - 35, 35 - 40, 40 - 45, 45 - 60 and above 60 m) following the classification of earlier workers [9,11]. A slope aspect map, which shows direction of slope, was also derived from the DEM.
4.3. Lithology
The lithology map was derived from the geological map (scale 1:250,000) of the western Himalaya region compiled by V.C. Thakur and B.S. Rawat of Wadia institute of Himalayan Geology which was scaled to 1:25,000 for field investigation [16]. There are seven rock types present in the area. These are Boulder conglomerate, limestone, phyllite, granites, shale, volcanics and meta volcanics, and sandstone with shale and siltstone.
4.4. Faults and Lineaments
Faults and lineaments present in the study area are extracted from the geological maps and the DEM. In order to identify linear topographic features from the DEM, eight shaded relief images were generated and the lineaments were generated from these shaded relief images using the line feature of ArcGIS. The lineaments are classified into minor lineament (length between 0 - 500 m), major lineament (length between 500 - 1500 m), and mega lineament (length greater than 1500 m). Further, faults, which are mega lineaments, showing offsets of ridges and drainage lines, were also identified.
4.5. Soil
The topsoil cover on a slope has an influence on landslide occurrence. For our study, the soil map was derived from a regional soil map at a 1:250,000 scale prepared by National Bureau of Soil Survey and Land Use Planning. The soils present in the area are loamy skeletal soil and loamy soil.
4.6. Landuse and Landcover
The landuse and landcover is one of the important parameters governing slope stability. The landuse map of the area was prepared from the remote sensing data. In the present study IRS P6 L3 and google images are used to extract various land use and land cover in terms of vegetation cover. The landuse map, thus prepared, classifies the area into dense vegetation, medium vegetation, degraded vegetation, agricultural land, scrub land/grass land, river sand and builtup area. The area is mostly covered by dense vegetation and agricultural land.
5. Landslide Hazard Zonation and Management Mapping
Various thematic maps have been prepared for generation of Landslide Hazard Zonation and the corresponding Management maps. Thematic maps/layers generated are lithology, geological structure/lineaments, geomorphology, drainage, slope angle, slope aspect, slope morphology, slope dip (bedding, joint) relation, landuse/landcover, rock weathering, soil texture, soil depth, landslide occurrence and anthropogenic factor. These thematic map layers are integrated using the LIS for generation of Landslide Hazard Zonation maps. The LIS software is capable of categorizing six hazard classes viz severe, very high, high, moderate, low and very low assigning higher wavelength colours to the high hazard classes and lower wavelength colours to the low hazard classes in the maps.
The criteria adopted for classification of six categories of landslide hazard zonation is based on ranking and weightage assigned to each categories in different thematic layers prepared for generation of landslide hazard zonation maps. Low and very low hazard zones indicating relative instability for each hazard zones. The tail ends of values obtained are classified into low and very low category of hazard zonation representing relative stability of these regions. The higher end of values obtained are classified into three different categories viz. severe, very high and high hazard zones indicating relative instability of these regions, whereas middle values which are distributed uniformly over area is classified as moderate hazard zone indicating moderate instability of the area. In the present study it is found that the area is dominantly occupied by very high, high, moderate and low hazard zones (Figure 4).
Very high hazard zone areas are prone to landslide activity which depicts steep slopes, scarp slopes higher weathering, higher dissection and denudation processes, torrential nature of streams and high velocity of runoff carrying huge debris materials, accelerated anthropogenic activities destabilizing the slopes. The rock formations in the area is folded, faulted, fractured & displayed at many places. The area need urgent attention in the form of mitigation measures like slope stabilization, bio engineering measures including regeneration of natural vegetation, reforestation, drainage correction etc. unless immediate action plans are implemented this zone will soon deteriorate further to the severe category. The settlement is to be avoided and permitted only in localized safe area.
High hazard zone area is also prone to landslide activity. The drainage follows structural features, the rocks are dissected, fractured and displaced, and denudation and weathering processes are active. The springs found along linear features are also responsible for natural hazards in the area. Hydrological and slope stabilization measures are required to be taken for mitigation.
Moderate hazard zone in which landsliding activity destabilize the area, are to be planned systematically so as to maintain its present status however, as natural drainage is disrupted and slope modified, landslide could be triggered. Mainly sheared zones of schist, genesis reveals the moderate slopes zone. The overall analysis reveals that moderate slopes have contributed more landslides in the past rather than very steep slopes.
Low hazard zone is occupied by an area of lower valley bottoms. The gentle middle spurs also come in the low hazard zone. However, many slopes falling within this zone could be destabilized by uncontrolled erosion, improper landuse practices and other developmental activities. Low hazard zone areas are relatively stable and safe from mass movements by virtue of its present environmental set up.
Map sheet wise area extent of each hazard zone, given in the map, is also generated taking into consideration the different hazard classes. As the landslides affect mainly the land use/land cover, making a great loss to life and property stress has been given to formulate the management rules taking into consideration mainly the landuse the management maps are generated. The management maps show 15 suggested management practice, having various combinations of management (Figure 5). After generating the landslide zonation map, it is validated by comparing with the field data and show a good correlation (Figures 4 and 6).
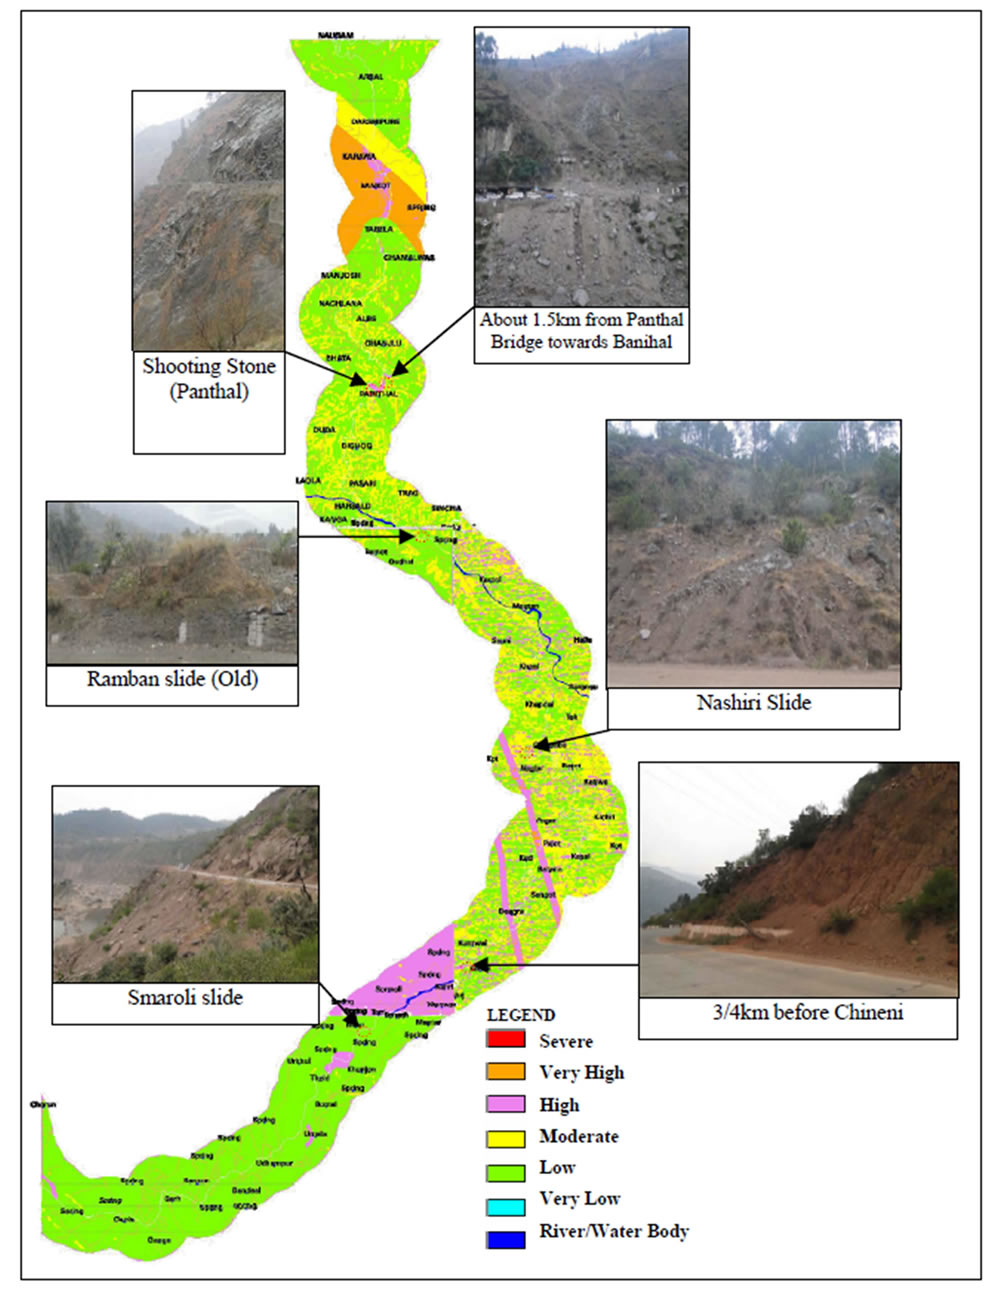
Figure 4. Landslide Hazard Zonation Map of the study area along with the field verification photographs.

Figure 5. Landslide Management Map of the Study Area Showing the Suggested Management Practices.
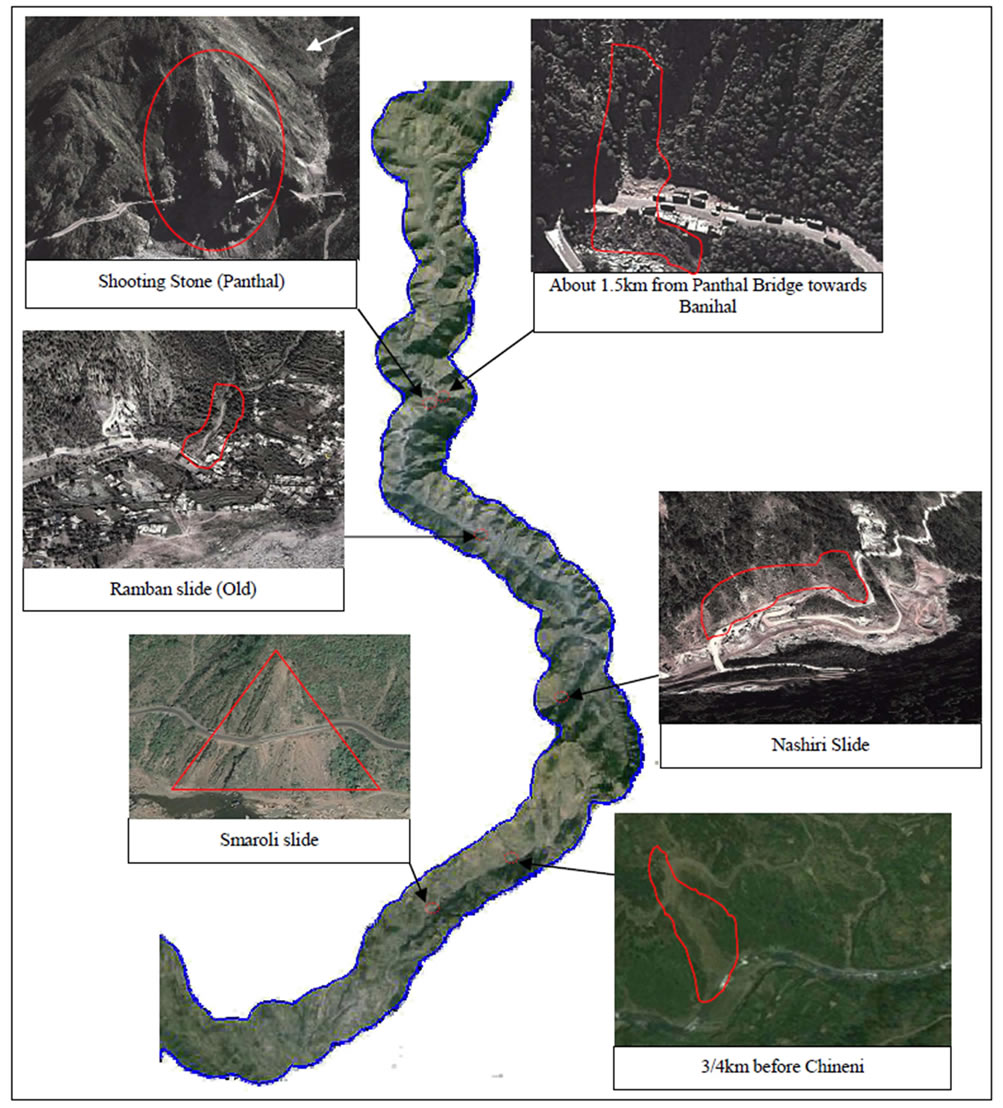
Figure 6.Google Earth image of the study area showing the landslide sites.
6. Conclusion
A methodology for landslide hazard zonation using remote sensing data and GIS has been successfully implemented in the present study area which can be further applied to other regions as well. The use of 30 m AsterDEM in generating various terrain units has also reduced the time quite efficiently. Landslide hazard zonation maps along with the corresponding management maps are of immense importance in hilly areas, like the present study area, to assess the potentiality of landslide occurrence and their management practices. In the present study, with the help of available information about the geology, topography of the area and using remote sensing data, considerable estimation of landslide hazards could be obtained to identify the broad trends of landslide hazard zonation. Last but not the least, since the entire database is created in digital format, the monitoring and assessment of landslides in the region can also be done at ease with necessary updates from time to time.
7. Acknowledgements
The authors thankfully acknowledge the financial assistance given by the DTRL, New Delhi, Government of India.
REFERENCES
- R. Anabalagan, “Landslide Hazard Evaluation and Zonation Mapping in Mountainous Terrain,” Engineering Geology, Vol. 32, No. 4, 1992, pp. 269-277. http://dx.doi.org/10.1016/0013-7952(92)90053-2
- D. J. Varnes, “Landslide Hazard Zonation: A Review of Principles and Practice,” Natural Hazards 3, Commission on Landslides of the IAEG, UNESCO, Paris, 1984, 63p.
- J. N. Hutchinson, “Keynote Paper: Landslide Hazard Assessment,” In: Bell, Ed., Landslides, Balkema, Rotterdam, 1995, pp. 1805-1841.
- R. P. Gupta and B. C. Joshi, “Landslide Hazard Zoning Using the GIS Approach—A Case Study from Ramganga Catchment Himalayan,” Engineering Geology, Vol. 28, No. 1-2, 1990, pp. 119-131. http://dx.doi.org/10.1016/0013-7952(90)90037-2
- A. Carrara, M. Cardinali, F. Detti, F. Guzzetti, V. Pasqui and P. Reichenbach, “GIS Techniques and Statistical Models in Evaluating Landslide Hazard,” Earth Surface Processes and Landforms, Vol. 16, No. 5, 1991, pp. 427-445. http://dx.doi.org/10.1002/esp.3290160505
- C. J. van Westen, “GIS in Landslide Hazard Zonation: A Review, with Examples from the Andes of Colombia,” In: M. F. Price and D. I. Heywood, Eds., Mountain Environments and Geographical Information Systems, Taylor & Francis Publishers, London, 1994. pp. 135-165.
- C. F. Chung, A. G. Fabbri and C. J. van Westen, “Multivariate Regression Analysis for Landslide Hazard Zonation,” In: A. Carrara, and F. Guzzetti, Eds., Geographical Information Systems in Assessing Natural Hazards, Kluwer Academic Publishers, Dordrecht, 1995, pp. 107-134. http://dx.doi.org/10.1007/978-94-015-8404-3_7
- R. Nagarajan, A. Mukherjee, A. Roy and M. V. Khire, “Temporal Remote Sensing Data and GIS Application in Landslide Hazard Zonation of Part of Western Ghat, India,” International Journal of Remote Sensing, Vol. 19, No. 4, 1998, pp. 573-585. http://dx.doi.org/10.1080/014311698215865
- A. S. Dhakal, T. Amada and M. Aniya, “Landslide Hazard Mapping and Its Evaluation Using GIS: An Investigation of Sampling Schemes for a Grid-Cell Based Quantitative Method,” Photogrammetric Engineering & Remote Sensing, Vol. 66, No. 8, 2000, pp. 981-989.
- A. K. Saha, R. P. Gupta and M. K. Arora, “GIS-Based Landslide Hazard Zonation in the Bhagirathi (Ganga) Valley, Himalayas,” International Journal of Remote Sensing, Vol. 23, No. 2, 2002, pp. 357-369. http://dx.doi.org/10.1080/01431160010014260
- S. Sarkar and D.P. Kanungo, “An Integrated Approach for Landslide Susceptibility Mapping Using Remote Sensing and GIS,” Photogrammetric Engineering & Remote Sensing, Vol. 70, No. 5, 2004, pp. 617-625. http://dx.doi.org/10.14358/PERS.70.5.617
- D. P. Kanungo, M. K. Arora, S. Sarkar and R. P. Gupta, “Comparative Study of Conventional, ANN Black Box, Fuzzy and Combined Neural and Fuzzy Weighting Procedures for Landslide Susceptibility Zonation in Darjeeling Himalayas,” Engineering Geology, Vol. 85, 2006, pp. 347-366.
- J. Mathew, V. K. Jha and G. S. Rawat, “Weights of Evidence Modelling for Landslide Hazard Zonation Mapping in Part of Bhagirathi Valley,” Uttarakhand Current Science, Vol. 92, No. 5, 2007, pp. 628-638.
- R. P. Gupta, A. K. Saha, M. K. Arora and A. Kumar, “Landslide Hazard Zonation in a Part of Bhagirathi Valley, Garhwal Himalayas, Using Integrated Remote Sensing—GIS,” Journal of Himalayan Geology, Vol. 20, No. 2, 1999, pp. 71-85.
- M. J. Crozier, “Landslides: Causes, Consequences and Environment,” Croom Helm Australia Pty. Ltd., London, 1986, 252 p.
- V. C. Thakur and B. S. Rawat, “Geological Map of the Western Himalaya,” Wadia Institute of Himalayan Geology, Dehradun, 1992.