American Journal of Plant Sciences
Vol.5 No.1(2014), Article ID:42218,10 pages DOI:10.4236/ajps.2014.51021
Identification of Quantitative Trait Loci (QTL) Underlying Protein, Oil, and Five Major Fatty Acids’ Contents in Soybean*
1Plant Genomics and Biotechnology Lab, Department of Biological Sciences, Fayetteville State University, Fayetteville, USA; 2Department of Plant, Soil and Agricultural Systems, Southern Illinois University, Carbondale, USA; 3United States Department of Agriculture-Agricultural Research Service, Crop Genetics Research Unit, Stoneville, USA.
Email: #mkassem@uncfsu.edu
Copyright © 2014 Masum Akond et al. This is an open access article distributed under the Creative Commons Attribution License, which permits unrestricted use, distribution, and reproduction in any medium, provided the original work is properly cited. In accordance of the Creative Commons Attribution License all Copyrights © 2014 are reserved for SCIRP and the owner of the intellectual property Masum Akond et al. All Copyright © 2014 are guarded by law and by SCIRP as a guardian.
Received October 23rd, 2013; revised December 19th, 2013; accepted January 8th, 2014
KEYWORDS
Soybean; SNP Linkage Map; QTL; RIL; Oil; Major Fatty Acids; MD96-5722; Spencer
ABSTRACT
Improved seed composition in soybean [Glycine max (L.) Merr.] for protein and oil quality is one of the major goals of soybean breeders. A group of genes that act as quantitative traits with their effects can alter protein, oil, palmitic, stearic, oleic, linoleic, and linolenic acids percentage in soybean seeds. The objective of this study was to identify Quantitative Trait Loci (QTL) controlling protein, oil, and fatty acids content in a set of F5:8 RILs derived from a cross between lines, ‘MD 96-5722’ and ‘Spencer’ using 5376 Single Nucleotide Polymorphism (SNP) markers from the Illumina Infinium SoySNP6K BeadChip array. QTL analysis used WinQTL Cart 2.5 software for composite interval mapping (CIM). Identified, were; one protein content QTL on linkage group (LG-) B2 or chromosome (Chr_) 14; 11 QTL associated with oil content on six linkage groups LG-N (Chr_3), LG-A1 (Chr_5), LG-K (Chr_9), LG-F (Chr_13), LG-B2 (Chr_14), and LG-J (Chr_16); and sixteen QTL for five major fatty acids (palmitic, stearic, oleic, linoleic, and linolenic acids) on LG-N (Chr_3), LG-F (Chr_13), LG-B2 (Chr_14), LG-E (Chr_15), LG-J (Chr_16), and LG-G (Chr_18). The SNP markers closely linked to the QTL reported here will be useful for development of cultivars with altered oil and fatty acid compositions in soybean breeding programs.
1. Introduction
Soybean (Glycine max L. Merr.) is one of the major economic crops in the world for the source of edible oil and feeds. Traditionally, protein and oil are the primary seed quality traits of interest for soybean but recently there is increased demand for altered oil components i.e., fatty acids for biofuel and human consumption. The range of protein and oil content in modern elite soybean cultivars are 34.9% - 39.6% and 19.0% - 23.5% respectively [1,2]. The oil quality depends on its fatty acid composition that affects nutritional value, flavor and stability of the soybean oil. The term “total fatty acid content” refers to the sum of the five major fatty acid components found in soybeans, namely palmitic (C16:0), stearic (C18:0), oleic (C18:1), linoleic (C18:2) and linolenic acids (C18:3) [3]. The human body can synthesize palmitic, stearic and oleic acids through metabolism. Low percentage of palmitic acid in soybean oil is desirable for edible oils which may be able to reduce the risk of coronary disease [4,5]. A diet with high oleic acid, like olive oil, has reduced cholesterol that can affect positively arteriosclerosis and heart disease [6]. Another use for modified soybean oils is the production of biodiesel fuel which has emerged as a potential renewable energy source to help alleviate environmental concerns. A high percentage of oleic acid is desirable for biodiesel to enhance biodiesel’s oxidative stability [7]. However, a high percentage of linolenic and linoleic acids are desirable to increase the energy content of biodiesel and decrease the gelling temperature. Human can’t synthesize linoleic and linolenic acids and these two essential fatty acids that humans have to obtain from food. Linolenic acid is also essential in photosynthesis and pollen development in plants, thus it cannot be eliminated from the seed oil [3]. Rancidity and short shelf life in soybean oil are due to linolenic acid because it can easily be oxidized at the three double bonds [3]. Separate breeding efforts have been initiated to alter the fatty acid profile of soybean oil for human consumption with high oleic acid and low palmitic and linolenic acids and for biodiesel with the reverse profile [5].
Protein and oil contents are polygenic quantitative traits resulted from interactions between multiple genes and the environment [8]. Gelderman (1975) [9] first referred such polygenes by an acronym Quantitative Trait Loci (QTL), a region of genome that associated with an effect on a quantitative trait. Abundance molecular markers are necessary to cover the whole genome of soybean which could identify significant QTL and candidate genes for quality traits of soybean seeds. Currently, Soy Base (2013) [10] contains more than 250 QTL for each of seed protein and oil, all of which have been mapped in many different populations and environments. Recently, we identified two QTL for protein and six QTL for oil in the recombinant inbred lines (RIL) of PI 438489B and “Hamilton” [11]. SoyBase (2013) [10]also contains more than 245 QTL for fatty acid components viz. palmitic, stearic, oleic, linoleic, and linolenic acids mapped in many different populations and environments.
Different types of molecular markers have been used to construct linkage maps and identify QTL in soybean such as single nucleotide polymorphism (SNP), restriction fragment length polymorphisms (RFLP), simple sequence repeat (SSR), amplified fragment length polymorphism (AFLP), and random amplified polymorphic DNA (RAPD) [11-19]. Here the Genetic Linkage Map of Soybean from SNP markers genotyped through Illumina Infinium BeadChip Array was used. The objective of this study was to identify QTL associated with protein, oil and five major fatty acids in theMD96-5722 by ‘Spencer’ recombinant inbred lines (RILs) population.
2. Materials and Methods
2.1. Plant Material and Seed Analysis for Protein, Oil, and Fatty Acids
Ninety-two F5:7 RILs developed by crossing breeding line, MD96-5722, with cultivar ‘Spencer’, was used to generate phenotypic and genotypic data. The population was grown in a field at Fayetteville State University(FSU) campus, Fayetteville, NC in 2012 with row spaces of 25 cm generating a plant density of 160,000 plants/ha. No additional fertilizers or insecticides were used. The experiment was conducted from May 1st to October 4th, 2012. Seeds at harvest maturity stage were analyzed for protein, oil, and fatty acids. About 25 g of seed from each line was ground using a Laboratory Mill 3600 (Perten, Springfield, IL), the ground samples were analyzed by near infrared reflectance using a diode array feed analyzer AD 7200 (Perten, Springfield, IL) [20-22]. Perten’s Thermo Galactic Grams PLS IQ software, initially developed by the University of Minnesota was used for calibrations. Protein and oil analyses were based on a seed dry matter basis, and fatty acids were analyzed based on total oil [21,23].
2.2. Genetic Map and QTL Identification
The ‘MD 96-5722’ by ‘Spencer’ population was genotyped using 5,376 SNPs through SoySNP6K Illumina Infinium BeadChip array. A genetic linkage map [24] was constructed through Join Map 4 (Kyazma BV, Wageningen, Netherlands) [25]. Composite interval mapping (CIM) was used to detect QTL from genotypic and phenotypic data using WinQTLCart2.5 software (http://statgen.ncsu.edu/qtlcart/WQTLCart.htm) [26]. The Model 6 with four parameters for forward and backward stepwise regression, 10 cM window size, 1 cM step size and five (5) control markers were chosen for running WinQTLCart [26]. The threshold was determined by permutations tests with 1000 iterations.
3. Results
Table 1 shows approximately normal distribution of protein, oil and the 5 major fatty acid compositions in the F5:7 seeds. Both the skewness and kurtosis values for these traits were <1.00. Variations among RIL lines were narrow for protein (CV = 3.57%) and oil (4.74%) but was wider for fatty acids components. For example, variation for oleic acid was 12.77% and for linolenic acid was 15.88%.
Composite Interval Mapping (CIM) was used to identify candidate QTL. Names of QTL against each trait, linkage group (LG)/chromosome (Chr_), positions of the QTL with markers (SNP) interval, LOD score, percentage of r2 and additive values presented in Table 2. Figure 1 also presented positions of QTL on each linkage group. Eight linkage groups namely, LG-N (Chr_3), LG-A1 (Chr_5), LG-K (Chr_9), LG-F (Chr_13), LG-B2 (Chr_14), LG-E (Chr_15), LG-J (Chr_16), and LG-G (Chr_18) contained 28 QTL for protein, oil and the five
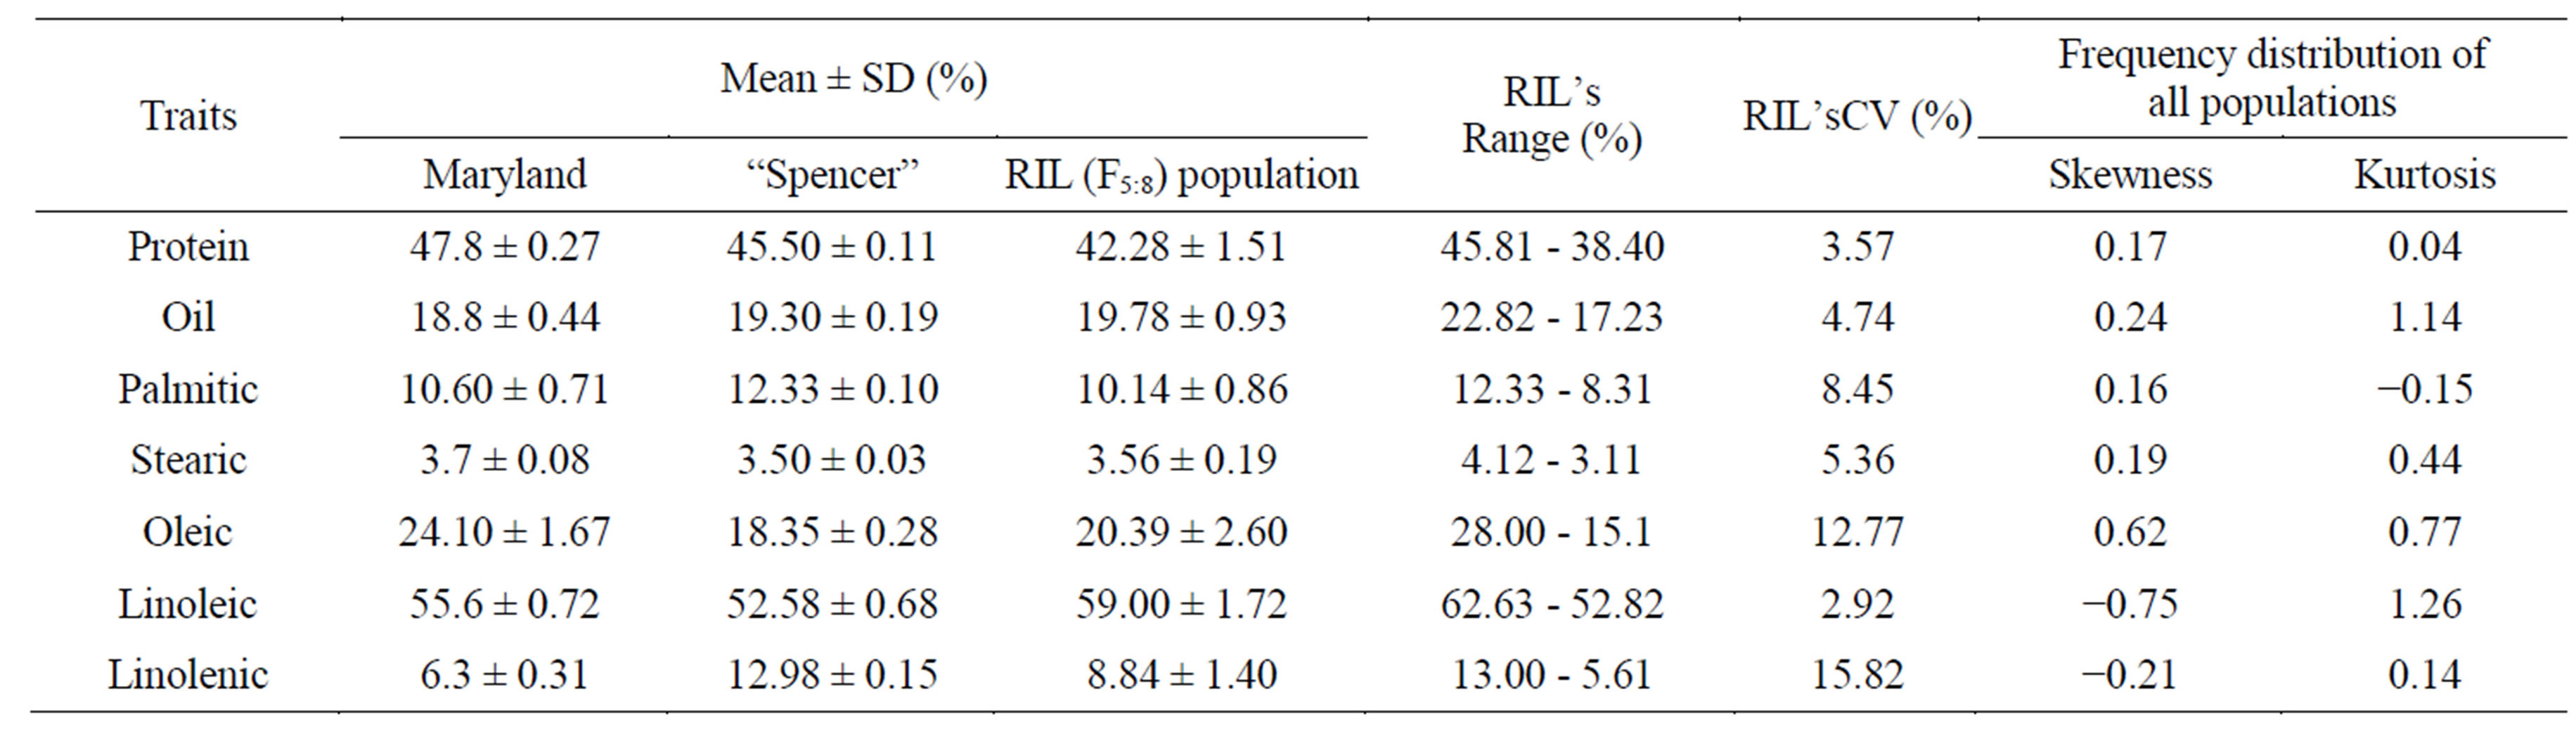
Table 1. Means and ranges of protein, oil, palmitic, stearic, oleic, linoleic and linolenic acid contents (% on dry based) of soybean cultivar, MD96-5722, ‘Spencer’ and their F5:7 RIL population.
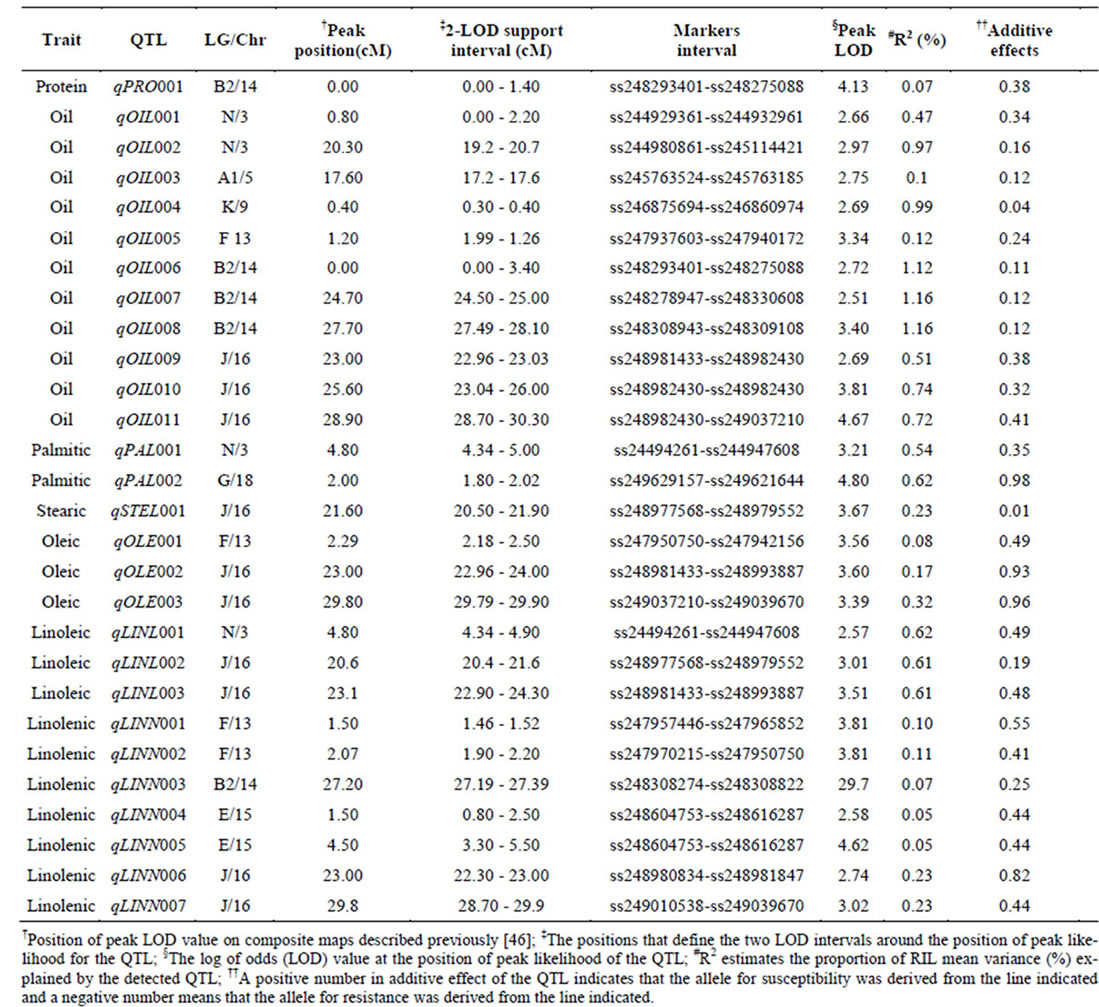
Table 2. Chromosomal locations and parameters associated with the quantitative trait loci (QTL) of protein, oil and major fatty acid components in MD 96-5722 and ‘Spencer’ Recombinant Inbred Line populations of soybean.
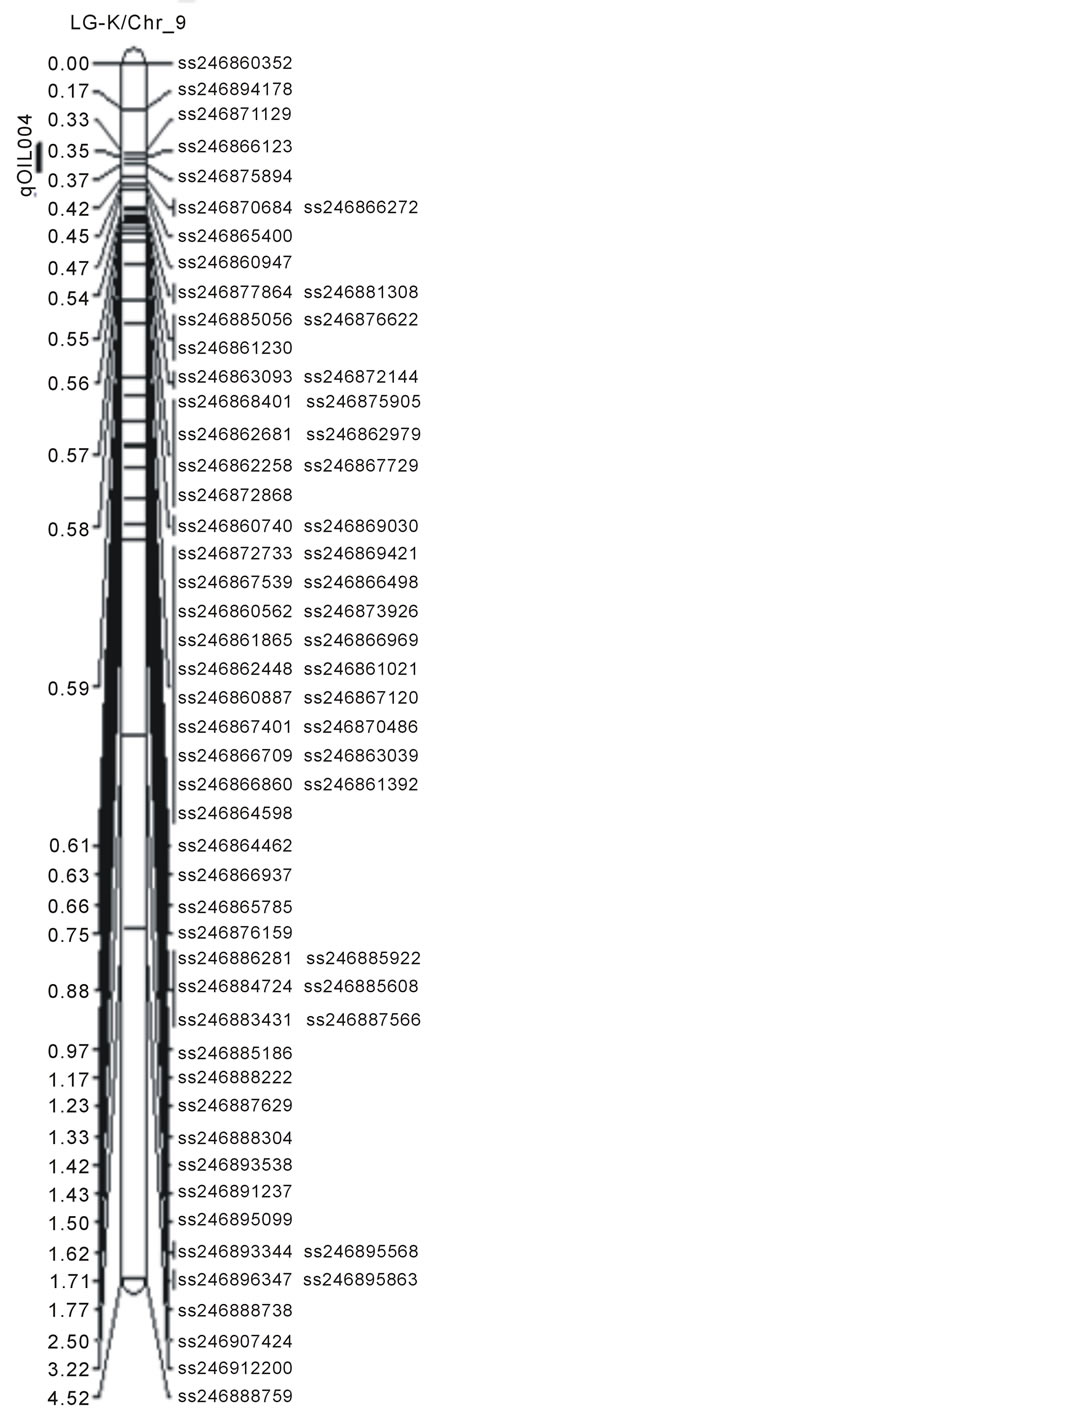
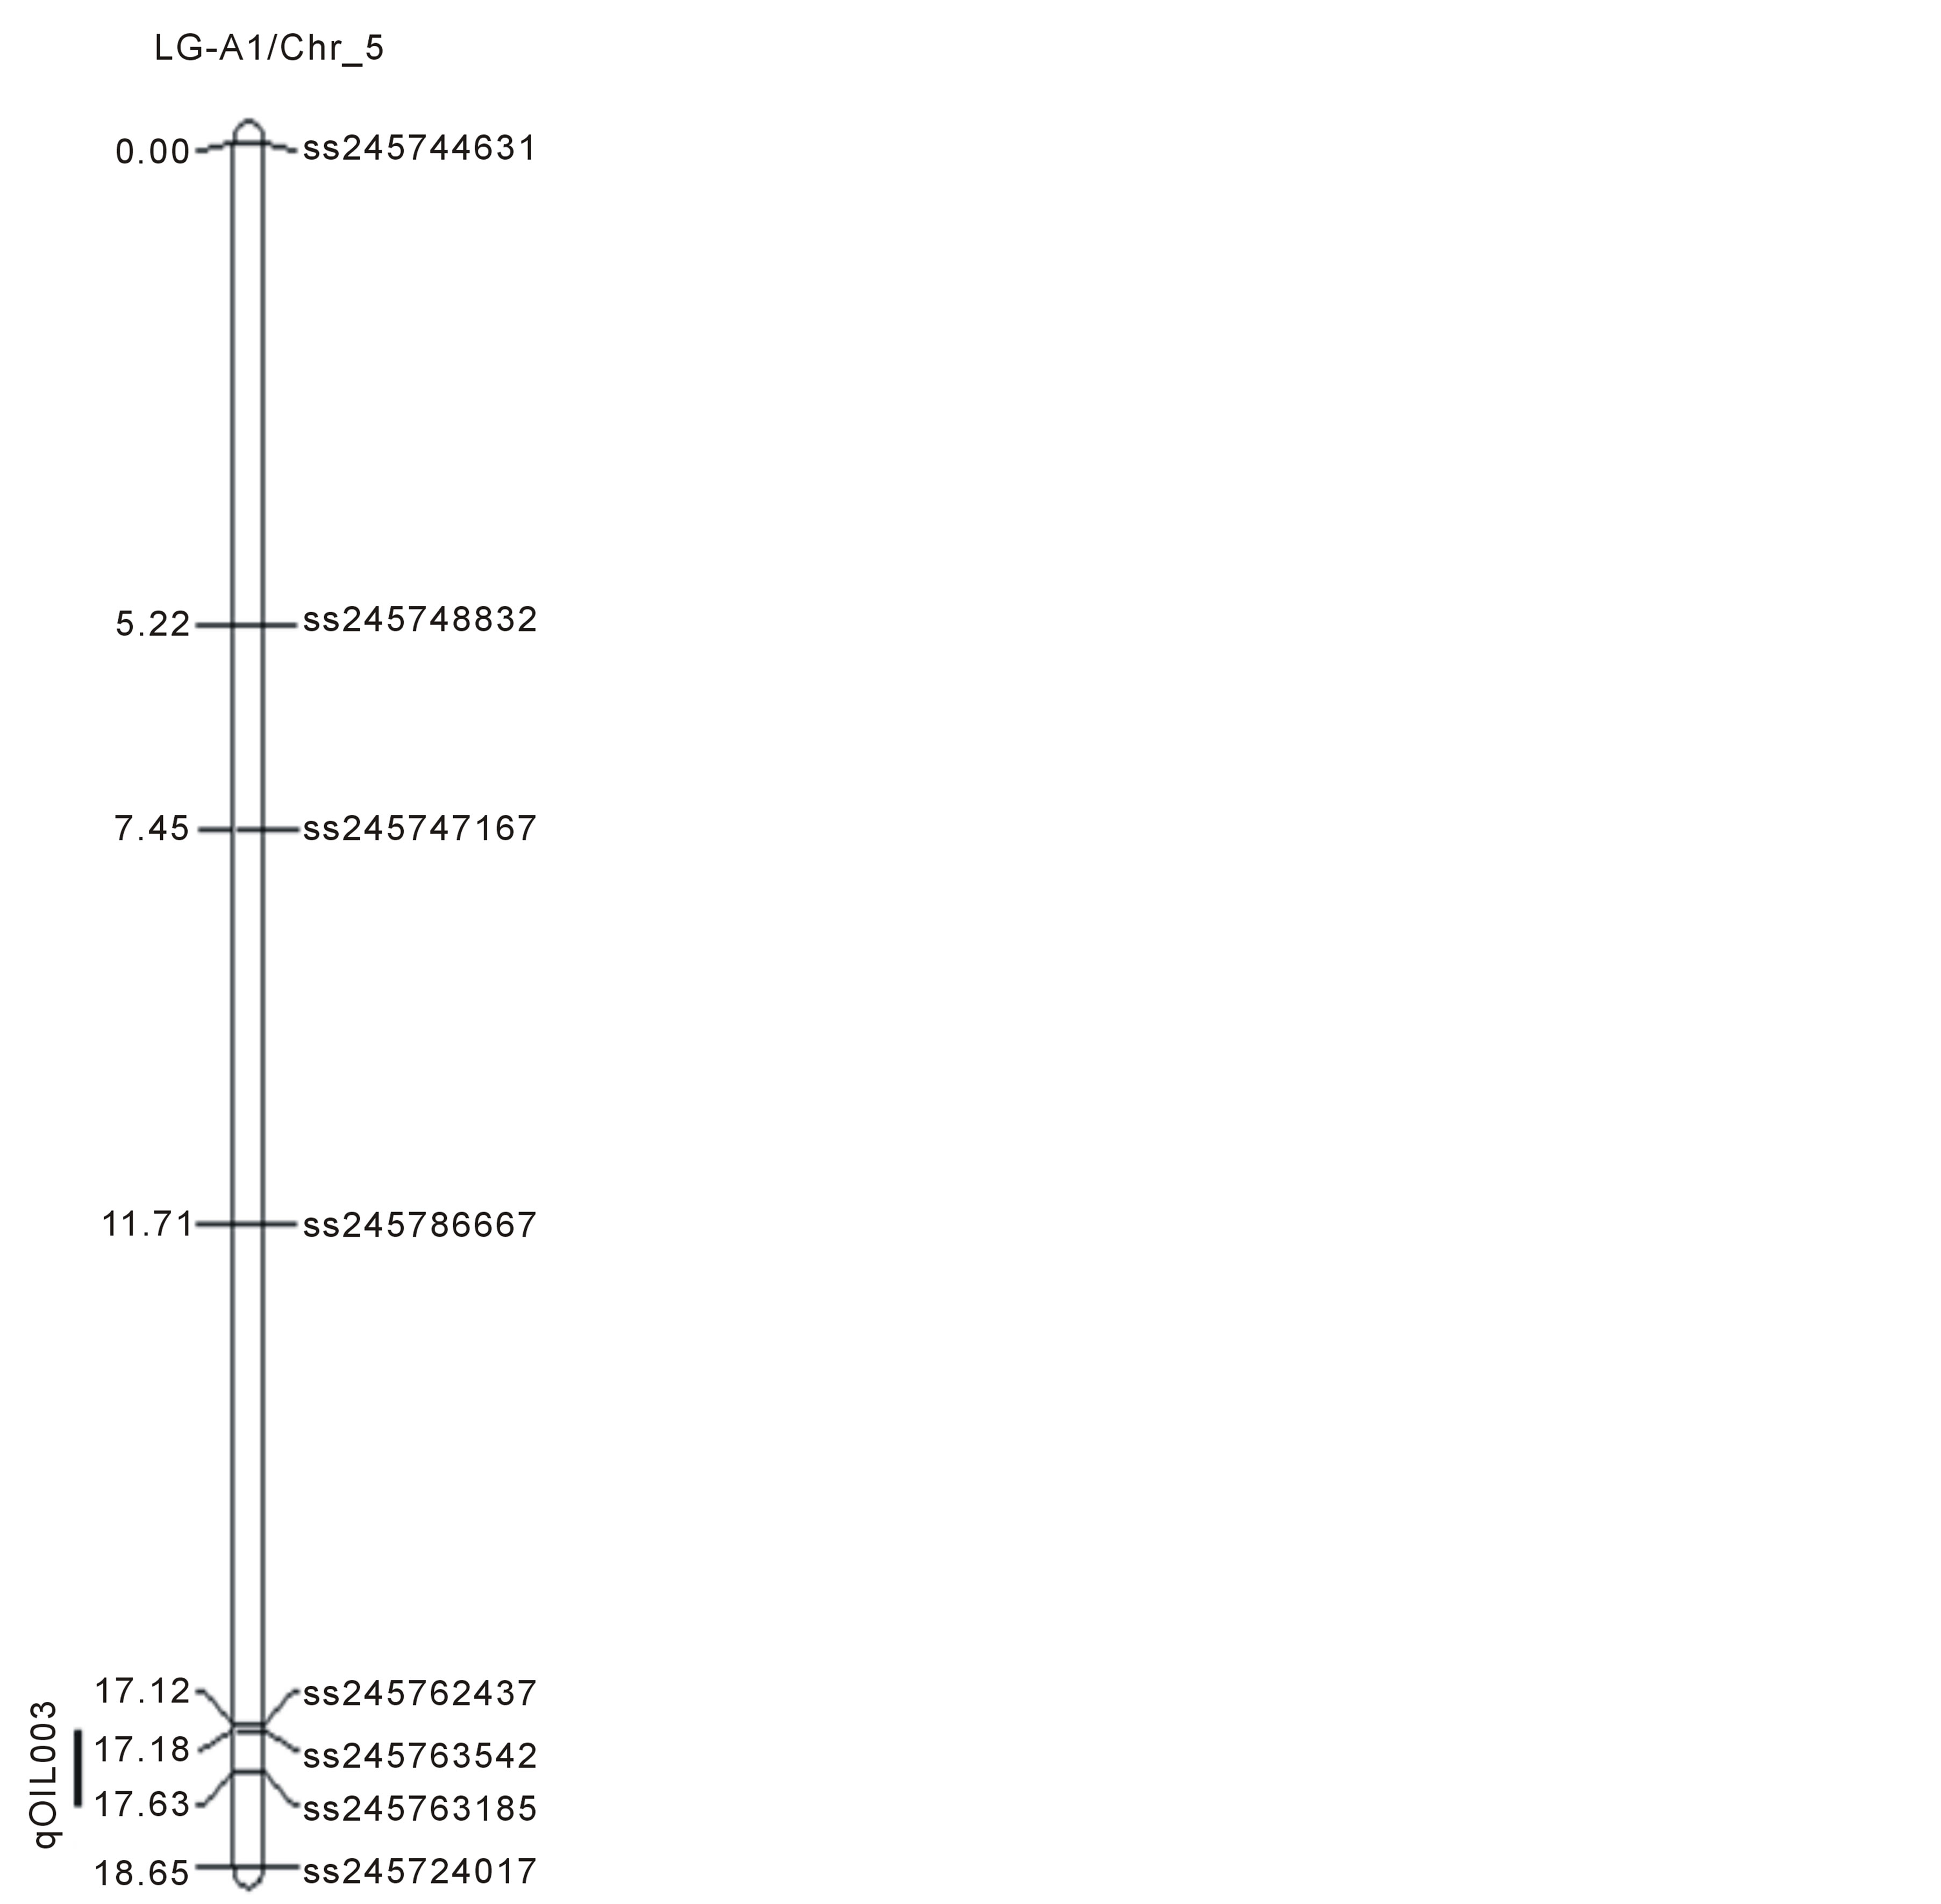
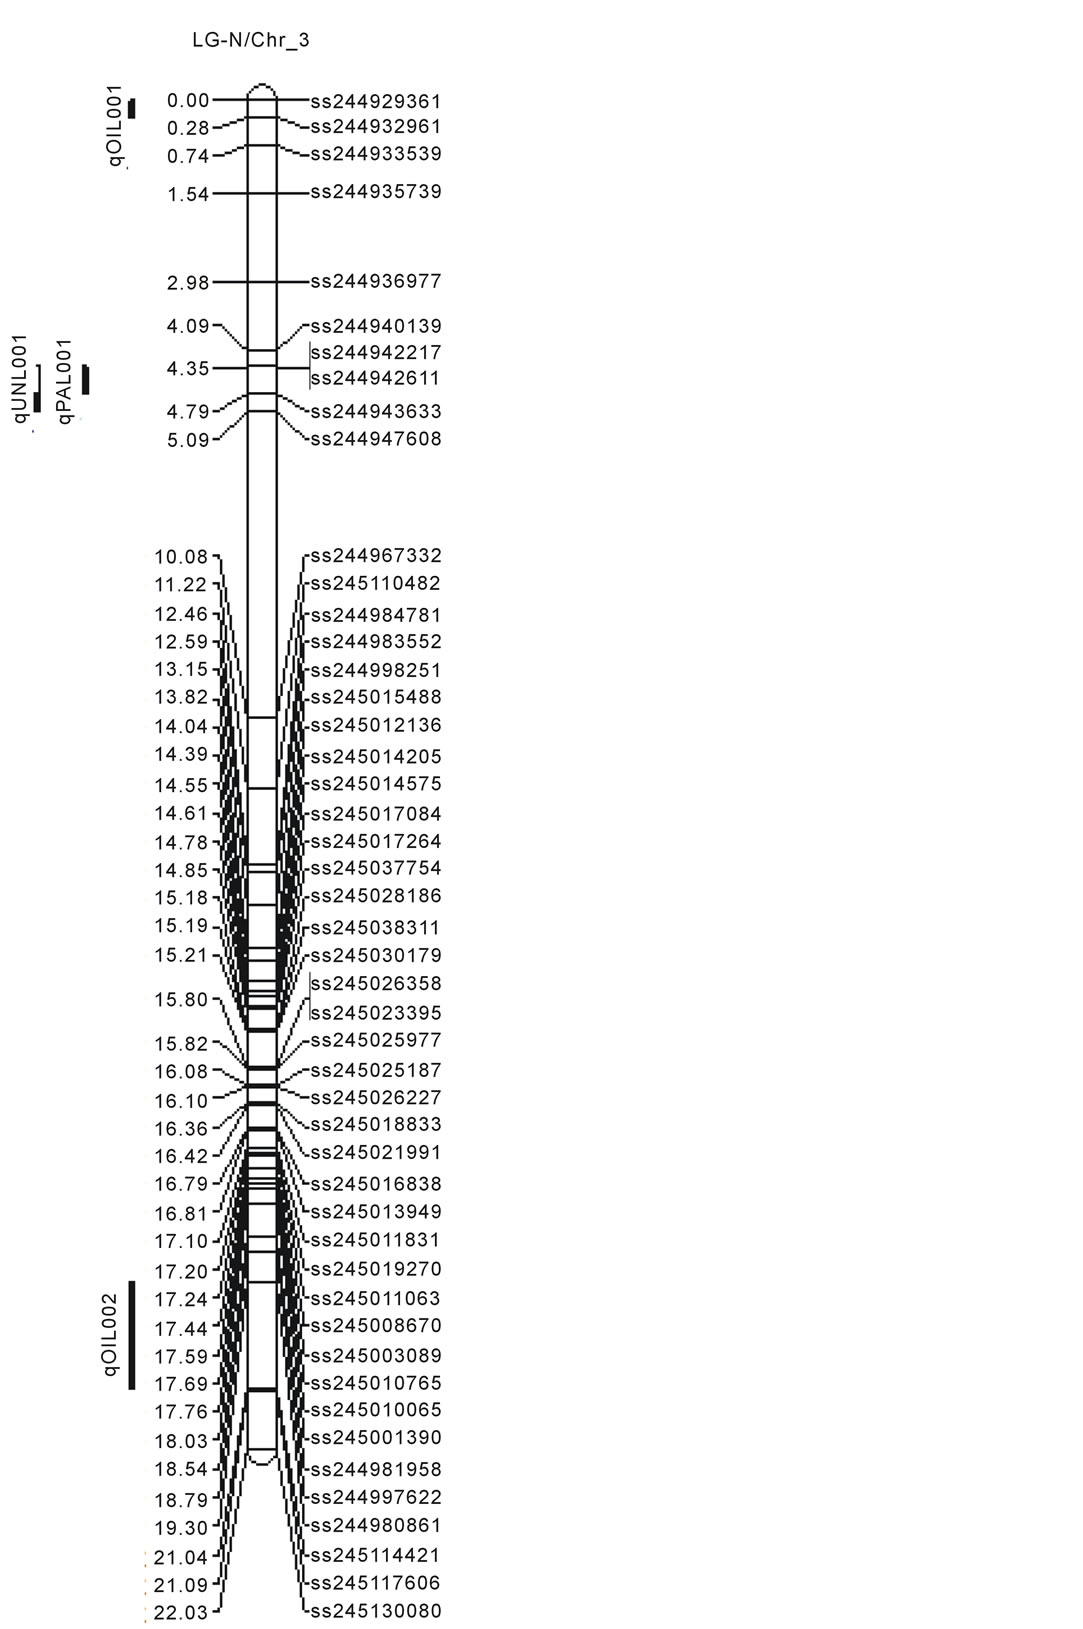
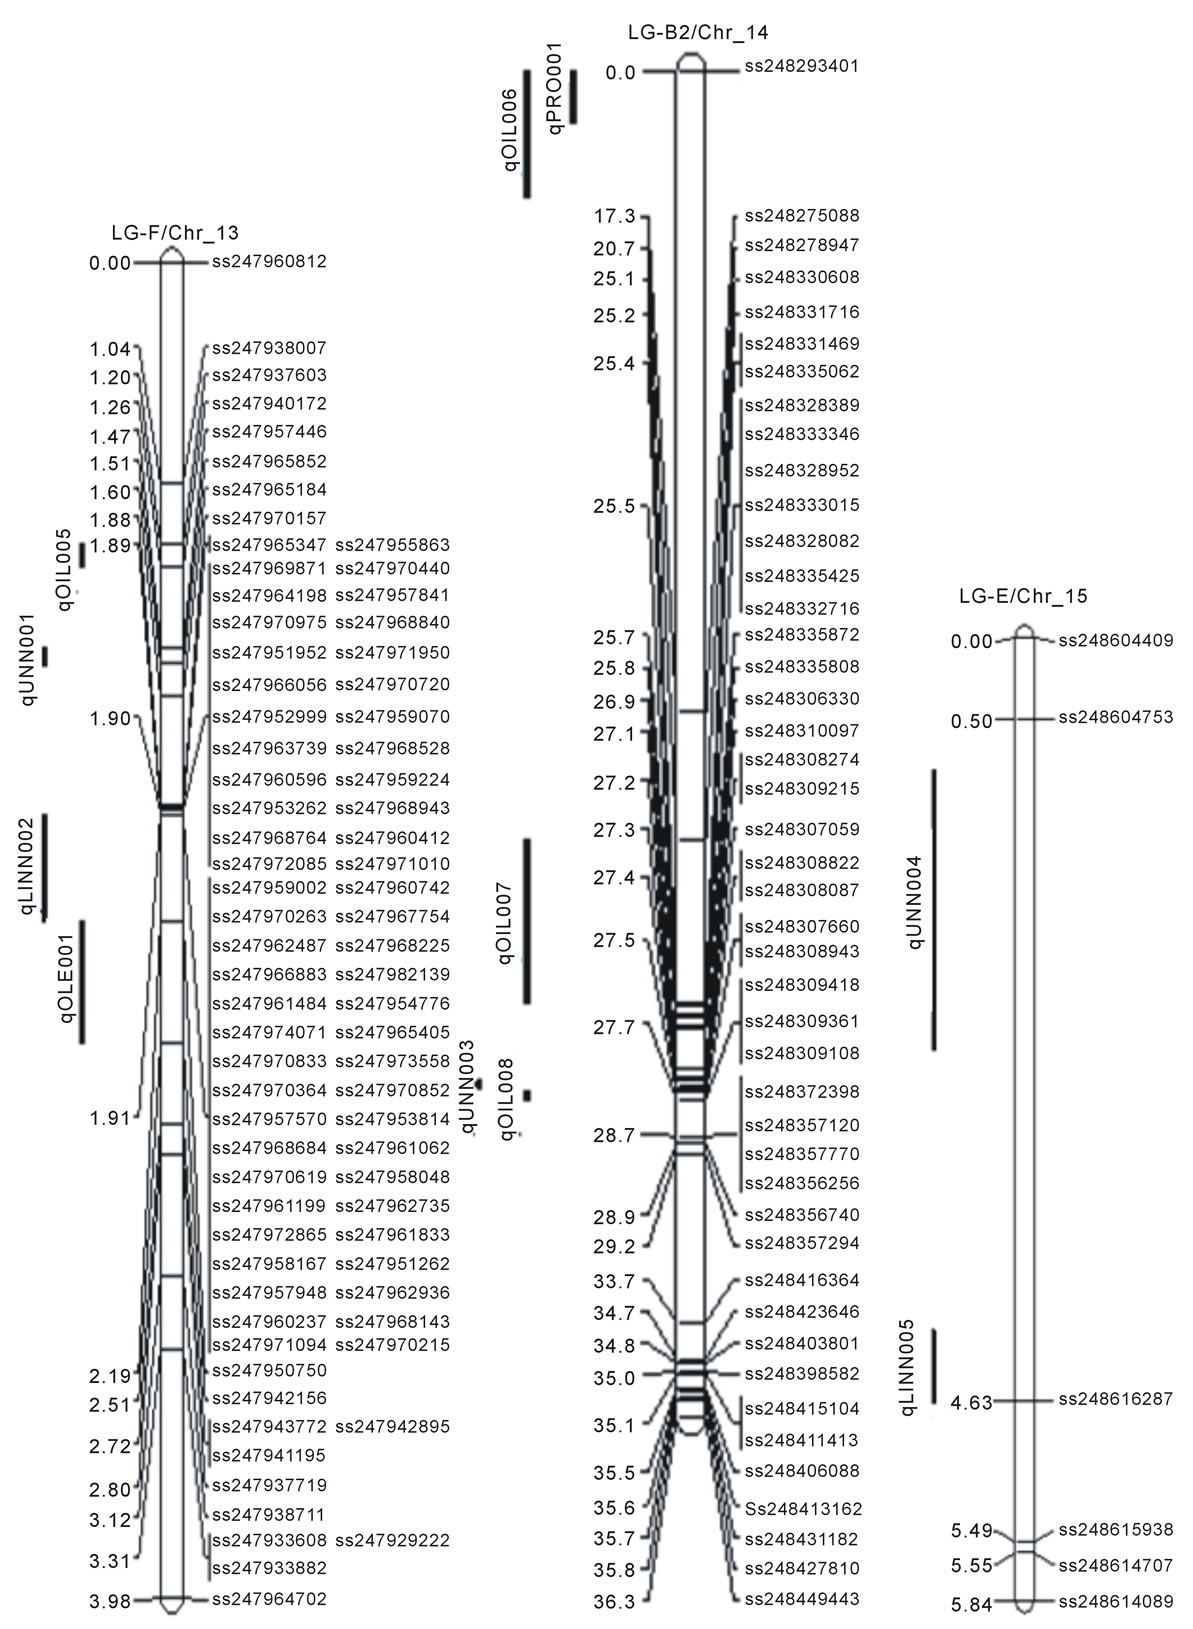
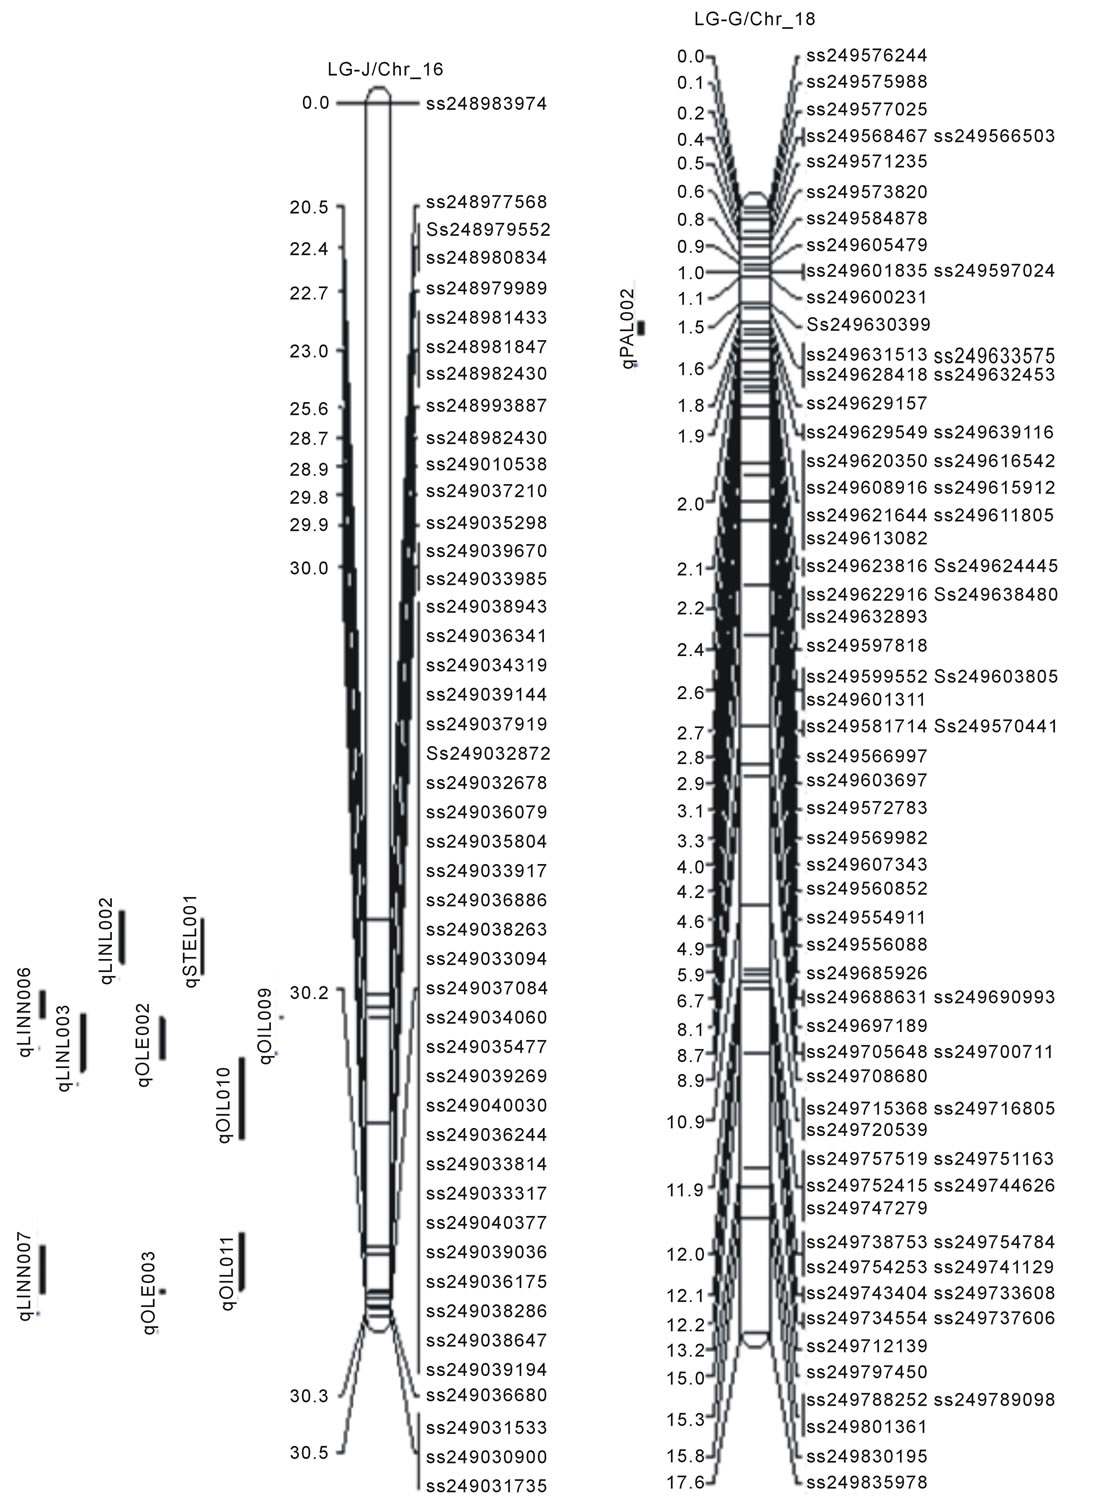
Figure 1. Locations of SNP markers and the QTL that underlie soybean seed protein (qPRO---), oil (qOIL---), palmitic (qPAL---), stearic (qSTEL---), Oleic (qOLE---), Linoleic (qLINL---) and Linolenic(qLINN---) acid contents (% on dry based) in the MD 96-5277 by ‘Spencer’ RIL populations. Chr./LGs were drawn using MapChart according to the MD 96-5277 by ‘Spencer’ genetic linkage map [24,47].
major fatty acids component. No QTL was found on the other 12 linkage groups of soybean.
One significant QTL for protein (qPro001) was identified on LG-B2 (Chr_14) with LOD scores 4.13. Eleven QTL (qOil001 to qOil011) for oil contents were identified. Within these QTL, two were on LG-N (Chr_3); one of each was on LG-A1 (Chr_5), LG-K (Chr_9), and LG F (Chr_13). Among the rest six, three QTL was identified on each LG-B2 (Chr_14) and LG-J (Chr_16). The LOD scores for QTL of oil ranged between 2.51to 4.67.
There were total of 16 QTL for fatty acids identified; two for palmitic acid (qPal001 on LG-N/Chr_3 and qPal002 on LG-G/Chr_18), one for stearic (qSte001 on LG-J/Chr_16), three for oleic (qOle001 on LG-F /Chr_13; qOle002 and qOle003 on LG-J/Chr_16), three for linoleic (qLinl001 on LG-N/Chr_3; qLinl002 and qLinl003 on LG-J/Chr_16), and seven for linolenic acid (qLinn001 and qLinn002 on LG-F/Chr_13; qLinn003 on LG-B2/ Chr_14; qLinn004 and qLinn005 on LG-E/Chr_15; qLinn006 and qLinn007 on LG-J/Chr_16). The result of QTL analysis provides clue that, parental lines MD 96- 5722 and “Spencer” each have beneficial alleles at different loci controlling protein, oil and fatty acids concentrations.
4. Discussion
Linkage mapping has been assisting soybean breeding programs extensively, by identifying QTL for protein and oil contents with a range of genetic backgrounds and in different environments [20,27-29]. Various soybean lines such as wild and cultivated soybeans and genotypes from different countries have also been used to explore seed protein QTL [26,27,29]. Here a QTL for protein on LG B2 (Chr_14) was identified, which was overlapped with one of oil QTL (qOil006) on the same linkage group or chromosome (Table 2, Figure 1). This overlapping or pleiotropic effect of protein and oil QTL within homeologous regions inferred a rearrangement of the QTL in homeologous pairs that may occurred due to duplicationevent [30,31]. Previously six QTL were identified with SNPs for oil contents (qOil001 - qOil006) in the PI 438489B by Hamilton population [11]; among these six, two QTL (qOil007 and qOil008) were identified on LG-B2 (Chr_14). However, their positions were different from the QTL identified in this study. Another recent study identified 11 QTL for oil concentration in a RIL population of “OAC Wallace” and “OAC Glencoe” with SSR markers on nine different chromosomes; specifically1 (LG-D1a), 7 (LG-M), 9 (LG-K), 12 (LG-H), 13 (LGF), 14 (LG-B2), 16 (LG-J), and 17 (LG-D2) [32]. Many linkage groups mentioned above are common with our findings regarding oil QTL but the cM positions are different.
The results of QTL analysis showed a total of 16 QTL for fatty acids (Table 2, Figure 1). Among these fatty acids QTL, two QTL associating with palmitic acid identified on LG-N (Chr_3) and LG-G (Chr_18) with LOD scores of 3.21 and 4.80 respectively. Reinprecht et al. also reported a QTL for palmitic acid on LG-N but in different position [33]. However, not identified here but were reported earlier palmitic acid QTL on LG-D2,LG-K, and LG-L by Moongkanna et al., on LG-A1, B2 by Hyten et al., on J and M by Diers and Shoemaker, on LG-A1 and LG-M by Li et al., and on LG-D1b and LG-A2 by Panthee et al. [3,34-37]. A QTL and SNP markers associated with stearic acid content were found on LG-J (Chr_16) (Table 2, Figure 1). Previously, Diers and Shoemaker [34] and Panthee et al. [37] also reported QTL for stearic acid composition on LG-J (Chr_16). Other groups identified such QTL on different linkage groups such as, Panthee et al., Brummer et al., and Spencer et al. on LG-B2 [37-39]. Moongkanna et al. located QTL on LG-A1, C2, E, and O [3]. More stearic acid QTL were also mapped on LG-C2, L by Hyten et al., on LG-F, G, M by Reinprecht et al., and on LG-B2 by Spencer et al. [33,34,39].
Three QTL for oleic acid were identified on LG-F (Chr-13) and LG-J (Chr-16) with LOD scores ranged from 3.39 to 3.60 (Table 2, Figure 1). The findings here on oleic acid QTL are different from many other reports. For example, Moongkanna et al. located 8QTL linked to high oleic acid percentage on LG-A1, G and H [3]; Panthee et al. reported a QTL on LG-E [37]; Monteros et al. reported 2 QTL on LG-A1, D2 and G [40]; Hyten et al. (2004) reported 2 QTL on LG-D1b and L [34]; and Bachlava et al. were on LG-I, L and O [41]. Three QTL underlying linoleic acid content were identified on two different LG-F (Chr_13) and LG-J (Chr_16) (Table 2, Figure 1). One QTL was identified by Hyten et al. at different position but on the same LG-F, they also detected another QTL on LG-L [34]. No similar positions or linkage groups were so far found for linoleic acid contents from the past studies. For example, Moongkanna et al. identified seven SSR markers associated with linoleic acid on LG-A1, G, H, and Panthee et al. found a QTL on LG-E [3,37].Based on our CIM analysis, there were 7 linolenic acid QTL identified and these are located on LG-F (Chr_13), LG_B2 (Chr_14), LG-E (Chr_15), and LG-J (Chr_16) (Table 2, Figure 1). QTL for linolenic acid was earlier reported on LG-E, G, H by Moongkanna et al., [3] on LG-B2 by Spencer et al., and Byrum et al. [39,42], on LG-C2, E, H, O by Shibata et al. [43], LG-E, K by Diers and Shoemaker [35], on LG-E, G by Panthee et al. [37], on LG-F, L by Hyten et al. [34] and on LG-E, K by Reinprecht et al. [33]. The finding here of linolenic acid QTL on LG-E and LG-F are in agreement with some earlier reports cited above.
Some of the QTL among 28 identified here on specific linkage groups or chromosomes were common to the past studies but the positions of the QTL were different. This may be because many of the previous QTL were discovered through simple linear regression methods (SIM) not by composite interval mapping (CIM), also they used different types of markers, different populations and plant populations also grow in different environments. In past studies, there was also few identical QTL identified in same experimental population grown in different environments by different researchers or in different years [44,45]. Although the development of a more saturated genetic linkage map would enhance the chance of identification of more QTL of protein, oil and fatty acids, especially within the gaps in our current genetic map, multiple location experiments are needed to determine the QTL environmental stability.
Acknowledgements
The authors would like to thank the Department of Defense (DoD) for funding this work through the grant# W911NF-11-1-0178 to M.A.K and S.K. We thank Ms. Pam Ratcliff and the rest of the undergrad students crew at FSU for taking care of the plants in the greenhouse and field, and Sandra Mosley at USDA-ARS, Stoneville, MS, for lab assistance on protein, oil and fatty acids analysis. This research was partially funded by United States Department of Agriculture, Agricultural Research Service project number 6402-21220-012-00D. The US Department of Agriculture (USDA) prohibits discrimination in all its programs and activities on the basis of race, color, national origin, age, disability, and where applicable, sex, marital status, familial status, parental status, religion, sexual orientation, genetic information, political beliefs, reprisal, or because all or part of an individual’s income is derived from any public assistance program. (Not all prohibited bases apply to all programs.) Persons with disabilities who require alternative means for communication of program information (Braille, large print, audiotape, etc.) should contact USDA’s TARGET Center at (202) 720-2600 (voice and TDD). To file a complaint of discrimination, write to USDA, Director, Office of Civil Rights, 1400 Independence Avenue, S.W., Washington, D.C. 20250-9410, or call (800) 795-3272 (voice) or (202) 720-6382 (TDD). USDA is an equal opportunity provider and employer.
REFERENCES
- K. Liu, “Chemistry and Nutritional Value of Soybean Components,” Soybean: Chemistry, Technology and Utilization, Aspen Publishers, Gaithersburg, 1997, pp. 25-35.
- D. F. Hildebrand, R. Li and T. Hatanaka, “Genomics of Soybean Oil Traits,” Genomics and Genetics of Soybean, Springer, New York, 2008, pp.185-209. http://dx.doi.org/10.1007/978-0-387-72299-3_12
- J. Moongkanna, S. Nakasathien, W. P. Novitzky, P. Kwanyuen, P. Sinchaisri and P. Srinives, “SSR Markers Linking to Seed Traits and Total Oil Content in Soybean,” Thai Journal of Agricultural Science, Vol. 44, No. 4, 2011, pp. 233-241.
- F. B. Hu, M. J. Stampfer, J. E. Manson, E. Rimm, G. A. Colditz, B. A. Rosner, C. H. Hennekens and W. C. Willett, “Dietary Fat Intake and the Risk of Coronary Heart Disease in Women,” The New England Journal of Medicine, Vol. 337, 1997, pp. 1491-1499. http://dx.doi.org/10.1056/NEJM199711203372102
- W. R. Fehr, “Breeding for Modified Fatty Acid Composition in Soybean,” Crop Science, Vol. 47 No. S3, 2007, pp. S72-S87.
- G. Shannon, “High Oleic Acid Soybeans for Wider Use of Oil in Food, Fuel and Other Products,” Fifteenth Annual National Conservation Systems Cotton & Rice Conference, 2012, p. 43.
- B. D. Fallen, V. R. Pantalone, C. E. Sams, D. A. Kopsell, S. F. Vaughn and B. R. Moser, “Effects of Soybean Oil Fatty Acid Composition and Selenium Application on Biodiesel Properties,” Journal of the American Oil Chemists’ Society, Vol. 88, No. 7, 2011, pp. 1019-1028. http://dx.doi.org/10.1007/s11746-010-1746-z
- H. Guohua, Q. Chen, C. Liu, H. Jiang, J. Wang and Z. Qi, “Integration of Major QTL of Important Agronomic Traits in Soybean,” In: A. Sudaric, Ed., Soybean—Molecular Aspects of Breeding, 2011, pp. 81-118. http://www.intechopen.com/books/soybean-molecular-aspects-of-breeding/integration-of-major-QTL-of-important-agronomic-traits-in-soybean
- H. Gelderman, “Investigations on Inheritance of Quantitative Characters in Animals by Gene Markers I. Methods,” Theoretical and Applied Genetics, Vol. 46, No. 7, 1975, pp. 319-330. http://dx.doi.org/10.1007/BF00281673
- SoyBase, “SoyBase—A Genome Database for Glycine,” USDA-ARS and Iowa State University, 2013. http://soybeanbreederstoolbox.org
- M. Akond, B. Ragin, R. Bazzelle, S. K. Kantartzi, K. Meksem and M. A. Kassem, “Quantitative Trait Loci Associated with Moisture, Protein, and Oil Content in Soybean [Glycine max (L.) Merr.],” Journal of Agricultural Science, Vol. 4, 2012, pp. 16-25.
- K. G. Lark, K. Chase, F. R. Adler, L. M. Mansur and J. J. Orf, “Interactions between Quantitative Trait Loci in Soybean in Which Trait Variation at One Locus Is Conditional upon a Specific Allele at Another,” Proceedings of the National Academy of Sciences, Vol. 92, No. 10, 1995, pp. 4656-4660. http://dx.doi.org/10.1073/pnas.92.10.4656
- Q. J. Song, L. F. Marek, R. C. Shoemaker, K. G. Lark, V. C. Concibido, X. Delannay, J. E. Specht and P. B. Cregan, “A New Integrated Genetic Linkage Map of the Soybean,” Theoretical and Applied Genetics, Vol. 109, No. 1, 2004, pp. 122-128.
- P. B. Cregan, T. Jarvik, A. L. Bush, R. C. Shoemaker, K. G. Lark, A. L. Kahler, N. Kaya, T. T. Van Toai, D. G. Lohnes, J. Chung and A. L. Specht, “An Integrated Genetic Map of Soybean Genome,” Crop Science, Vol. 39, 1999, pp. 1464-1490. http://dx.doi.org/10.2135/cropsci1999.3951464x
- M. A. Kassem, J. Shultz, K. Meksem, Y. Cho, A. J. Wood, M. J. Iqbal and D. A. Lightfoot, “An Updated ‘Essex’ by ‘Forrest’ Linkage Map and First Composite Map of QTL Underlying Six Soybean Traits,” Theoretical and Applied Genetics, Vol. 113, 2006, pp. 1015-1026. http://dx.doi.org/10.1007/s00122-006-0361-8
- M. A. Kassem, L. Ramos, L. Leandro, G. Mbofung, D. A. Hyten, S. K. Kantartzi, R. Grier, L.Cianzio and K. Meksem, “The First ‘PI438489B’ by ‘Hamilton’ SNP-Based Genetic Linkage Map of Soybean [Glycine max (L.) Merr.] and Quantitative Trait Loci (QTL) that Underlie SDS Resistance,” Plant Genetics, Genomics, and Biotechnology, Vol. 1, No. 1, 2012, pp. 18-30. http://dx.doi.org/10.5147/jpgs.2012.0053
- I. Y. Choi, D. L. Hyten, L. K. Matukumalli, Q. Song, J. M. Chaky, C. V. Quigley, K. Chase, K. G. Lark, R. S. Reiter, M. S. Yoon, E. Y. Hwang, S. I. Yi, N. D. Young, R. C. Shoemaker, C. P. Van Tassel, J. E. Specht and P. B. Cregan, “A Soybean Transcript Map: Gene Distribution, Haplotype and Single Nucleotide Polymorphism Analysis,” Genetics, Vol. 176, No. 1, 2007, pp. 685-696. http://dx.doi.org/10.1534/genetics.107.070821
- D. L. Hyten, S. B. Cannon, Q. Song, N. Weeks, E. W. Fickus, R. C. Shoemaker, J. E. Specht, A. D. Farmer, G. D. May and P. B. Cregan, “Highthroughput SNP Discovery through Deep Resequencing of a Reduced Representation Library to Anchor and Orient Scaffolds in the Soybean Whole Genome Sequence,” BMC Genomics, Vol. 11, 2010, p. 38. http://dx.doi.org/10.1186/1471-2164-11-38
- Q. Song, D. L. Hyten, G. Jia, C. V. Quigley, E. W. Fickus, R. L. Nelson and P. B. Cregan, “Development and Evaluation of SoySNP50K, a High-Density Genotyping Array for Soybean,” PLoS One, Vol. 8, No. 1, 2013, Article ID: e54985. http://dx.doi.org/10.1371/journal.pone.0054985
- B. W. Diers, P. Keim, W. R. Fehr and R. C. Shoemaker, “RFLP Analysis of Soybean Seed Protein and Oil Content,” Theoretical and Applied Genetics, Vol. 83, 1992, pp. 608-612. http://dx.doi.org/10.1007/BF00226905
- J. Morrison, E. R. Cober, M. F. Saleem, N. B. McLaughLin, J. Fregeau-Reid, B. L. Ma, W. Yan and L. Woodrow, “Changes in Isoflavone Concentration with 58 Years of Genetic Improvement of Short-Season Soybean Cultivars in Canada,” Crop Science, Vol. 48, No. 6, 2008, pp. 2201-2208. http://dx.doi.org/10.2135/cropsci2008.01.0023
- N. Bellaloui, J. R. Smith, J. D. Ray and A. M. Gillen, “Effect of Maturity on Seed Composition in the Early Soybean Production System as Measured on Near-Isogenic Soybean Lines,” Crop Science, Vol. 49, No. 2, 2009, pp. 608-620. http://dx.doi.org/10.2135/cropsci2008.04.0192
- E. Boydak, M. Alpaslan, M. Hayta, S. Gercek and M. Simsek, “Seed Composition of Soybeans Grown in the Harran Region of Turkey as Affected by Row Spacing and Irrigation,” Journal of Agricultural and Food Chemistry, Vol. 50, No. 16, 2002, pp. 4718-4720. http://dx.doi.org/10.1021/jf0255331
- M. Akond, S. K. Kantartzi, K. Meksem, Q. Song, D. Wang, Z. Wen, D. A. Lightfoot and M. A. Kassem, “A SNP-Based Genetic Linkage Map of Soybean Using the SoySNP6K Illumina Infinium BeadChip Genotyping Array,” Plant Genetics, Genomics, and Biotechnology, Vol. 1, No. 3, 2013, pp. 80-89.
- J. W. Van Ooijen, “Join Map 4: Software for the Calculation of Genetic Linkage Maps in Experimental Populations,” Kyazma BV, Wageningen, 2006.
- S. Wang, C. Basten and Z. Zeng, “Windows QTL Cartographer 2.5.,” Department of Statistics, North Carolina State University, Raleigh, 2007. http://statgen.ncsu.edu/qtlcart/WQTLCart.htm
- G. Csanadi, J. Vollmann, G. Stift and T. Lelley, “Seed Quality QTL Identified in a Molecular Map of Early Maturing Soybean,” Theoretical and Applied Genetics, Vol. 103, No. 6-7, 2001, pp. 912-919. http://dx.doi.org/10.1007/s001220100621
- T. H. Jun, K. Van, M. Y. Kim, S. H. Lee, and D. R. Walker, “Association Analysis Using SSR Markers to Find QTL for Seed Protein Content in Soybean,” Euphytica, Vol. 162, 2008, pp.179-191. http://dx.doi.org/10.1007/s10681-007-9491-6
- W. Li and D. A. Lightfoot, “Recent Advances in Molecular Marker Systems for Soybean Breeding,” Scientific Press, Beijing, 2012, p. 255.
- P. Lestari, K. Van, J. Lee, Y. J. Kang and S. H. Lee, “Gene Divergence of Homeologous Regions Associated with a Major Seed Protein Content QTL in Soybean,” Front Plant Science, Vol. 4, 2013, p. 176.
- R. C. Shoemaker, K. Polzin, J. Labate, J. Specht, E. C. Brummer, T. Olson, N. Young, V. Concibido, J. Wilcox, J. P. Tamulonis, G. Kochert and H. R. Boerma, “Genome Duplication in Soybean (Glycine Subgenus soja),” Genetics, Vol. 144, No. 1, 1996, pp. 329-338.
- M. Eskandari, E. R. Cober and I. Rajcan, “Genetic Control of Soybean Seed Oil: I. QTL and Genes Associated with Seed Oil Concentration in RIL Populations Derived from Crossing Moderately High Oil Parents,” Theoretical and Applied Genetics, Vol. 126, No. 2, 2013, pp. 483-495. http://dx.doi.org/10.1007/s00122-012-1995-3
- Y. Reinprecht, V. W. Poysa, K. Yu, I. Rajcan, G. R. Ablett and K. P. Pauls, “Seed and Agronomic QTL in Low Linolenic Acid, Lipoxygenase-Free Soybean (Glycine max (L.) Merrill) Germplasm,” Genome, Vol. 49, No. 12, 2006, pp. 1510-1527. http://dx.doi.org/10.1139/g06-112
- D. L. Hyten, V. R. Pantalone, A. M. Saxto, M. E. Schmidt and C. E. Sams, “Molecular Mapping and Identification of Soybean Fatty Acid Modifier Quantitative Trait Loci,” Journal of the American Oil Chemists’ Society, Vol. 81, No. 12, 2004, pp. 1115-1118.
- B. W. Diers and R. C. Shoemaker, “Restriction Fragment Length Polymorphism Analysis of Soybean Fatty Acid Content,” Journal of the American Oil Chemists’ Society, Vol. 69, No. 12, 1992, pp. 1242-1247.
- Z. Li, R. F. Wilson, W. E. Rayford and H. R. Boerma, “Molecular Mapping Genes Conditioning Reduced Palmitic Acid content in N87-2122-4 soy bean,” Crop Science, Vol. 42, No. 2, 2002, pp. 373-378. http://dx.doi.org/10.2135/cropsci2002.0373
- D. R. Panthee, V. R. Pantalone and A. M. Saxton, “Modifier QTL for Fatty Acid Composition in Soybean Oil,” Euphytica, Vol. 152, 2006, pp. 67-73. http://dx.doi.org/10.1007/s10681-006-9179-3
- E. C. Brummer, A. D. Nickell, J. R. Wilcox and R. C. Shoemaker, “Mapping the Fan Locus Controlling Linolenic Acid Content in Soybean Oil,” Journal of Heredity, Vol. 86,1995, pp. 245-247.
- M. M. Spencer, V. R. Pantalone, E. J. Meyer, D. Landau-Ellis and D. L. Hyten, “Mapping the Fas Locus Controlling Stearic Acid Content in Soybean,” Theoretical and Applied Genetics, Vol. 106, No. 4, 2003, pp. 615- 619.
- M. J. Monteros, J. W. Burton and H. R. Boerma, “Molecular Mapping and Confirmation of QTL Associated with Oleic Acid Content in N00-3350,”Crop Science, Vol. 48, No. 6, 2008, pp. 2223-2234. http://dx.doi.org/10.2135/cropsci2008.05.0287
- E. Bachlava, R. E. Dewey, J. Auclair, S. Wang, J. W. Burton and A. J. Cardinal, “Mapping Gene Encoding Microsomal ω-6 Desaturase Enzymes and Their Cosegregation with QTL Affecting Oleate Content in Soybean,” Crop Science, Vol. 48, No. 2, 2008, pp. 640-650. http://dx.doi.org/10.2135/cropsci2007.07.0381
- J. R. Byrum, A. J. Kinney, R. C. Shoemaker and B. W. Diers, “Mapping of the Microsomal and Plastid Omega-3 Fatty Acid Desaturases in Soybean. Soybean Genet,” Newsletter, Vol. 22, 1995, pp. 181-184.
- M. Shibata, K. Takayama, A. Ujiie, T. Yamada, J. Abe and K. Kitamura, “Genetic Relationship between lipid Content and Linolenic Acid Concentration in Soybean Seeds,” Breeding Science, Vol. 58, No. 4, 2008, pp. 361- 366. http://dx.doi.org/10.1270/jsbbs.58.361
- J. H. Orf, K. Chase, T. Jarvik, L. M. Mansur, P. B. Cregan, F. R. Adler and K. G. Lark, “Genetics of Soybean Agronomic Traits: II. Comparison of Three Related Recombination Inbred Populations,” Crop Science, Vol. 39, No. 6, 1999, pp. 1652-1657. http://dx.doi.org/10.2135/cropsci1999.3961652x
- L. M. Mansur, J. H. Orf, K. Chase, T. Jarvik, P. B. Cregan and K. G. Lark, “Genetic Mapping of Agronomic Traits Using Recombinant Inbred Lines of Soybean,” Crop Science, Vol. 36, No. 5, 1996, pp. 1327-1336. http://dx.doi.org/10.2135/cropsci1996.0011183X003600050042x
- N. D. Coles, M. D. McMullen, P. J. Balint-Kurti, R. C. Pratt and J. B. Holland, “Genetic Control of Photoperiod Sensitivity in Maize Revealed by Joint Multiple Population Analysis,” Genetics, Vol. 184, No. 3, 2010, pp. 799- 812. http://dx.doi.org/10.1534/genetics.109.110304
- R. E. Voorrips, “MapChart: Software for the Graphical Presentation of Linkage Maps and QTLs,” The Journal of Heredity, Vol. 93, No. 1, 2002, pp. 77-78.
NOTES
*Mention of trade names or commercial products in this publication is solely for the purpose of providing specific information and does not imply recommendation or endorsement by the US Department of Agriculture.
#Corresponding author.