Paper Menu >>
Journal Menu >>
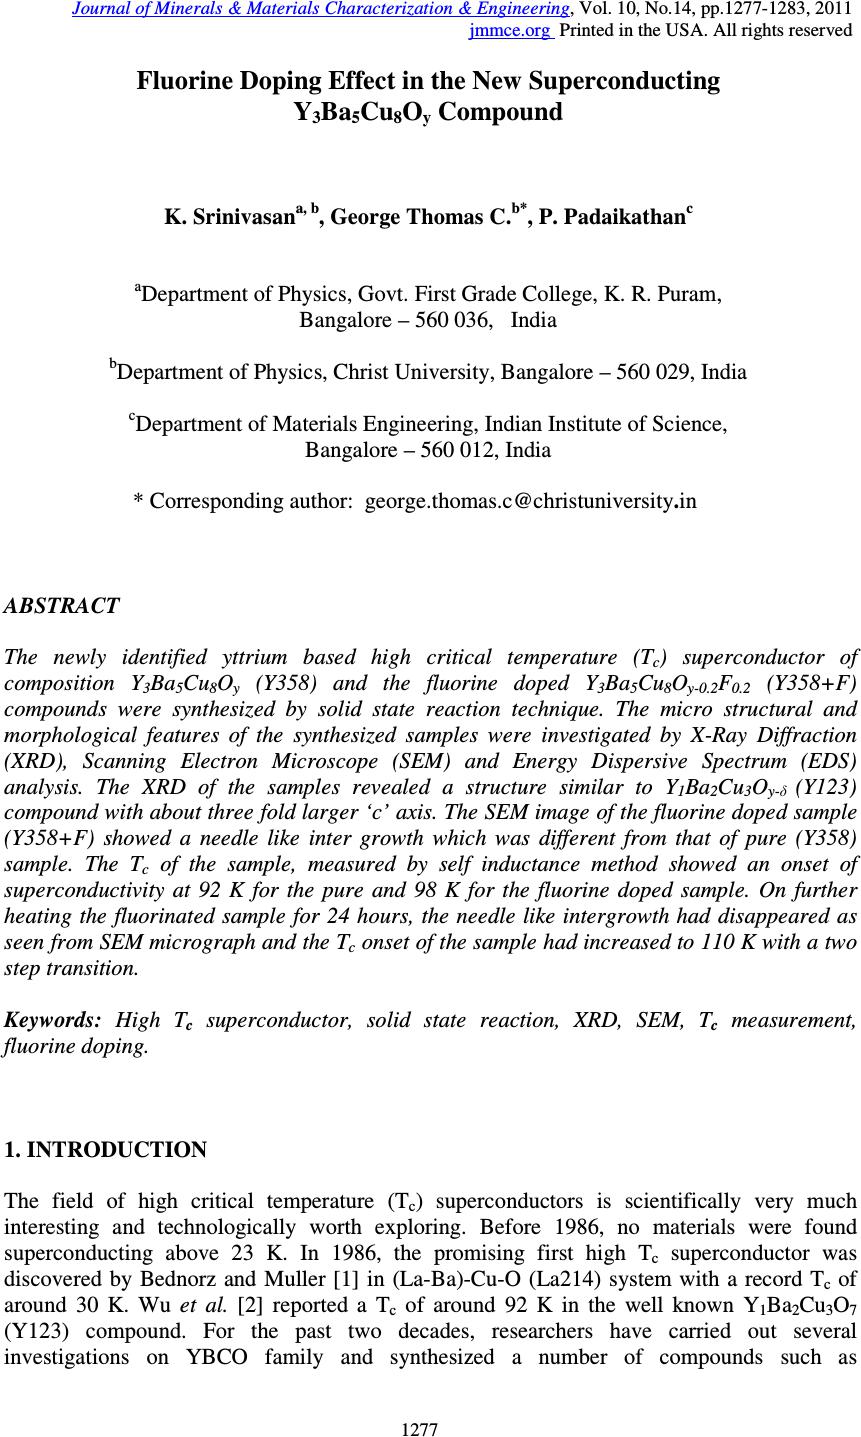 Journal of Minerals & Materials Characterization & Engineering, Vol. 10, No.14, pp.1277-1283, 2011 jmmce.org Printed in the USA. All rights reserved 1277 Fluorine Doping Effect in the New Superconducting Y 3 Ba 5 Cu 8 O y Compound K. Srinivasan a, b , George Thomas C. b* , P. Padaikathan c a Department of Physics, Govt. First Grade College, K. R. Puram, Bangalore – 560 036, India b Department of Physics, Christ University, Bangalore – 560 029, India c Department of Materials Engineering, Indian Institute of Science, Bangalore – 560 012, India * Corresponding author: george.thomas.c@christuniversity.in ABSTRACT The newly identified yttrium based high critical temperature (T c ) superconductor of composition Y 3 Ba 5 Cu 8 O y (Y358) and the fluorine doped Y 3 Ba 5 Cu 8 O y-0.2 F 0.2 (Y358+F) compounds were synthesized by solid state reaction technique. The micro structural and morphological features of the synthesized samples were investigated by X-Ray Diffraction (XRD), Scanning Electron Microscope (SEM) and Energy Dispersive Spectrum (EDS) analysis. The XRD of the samples revealed a structure similar to Y 1 Ba 2 Cu 3 O y-δ (Y123) compound with about three fold larger ‘c’ axis. The SEM image of the fluorine doped sample (Y358+F) showed a needle like inter growth which was different from that of pure (Y358) sample. The T c of the sample, measured by self inductance method showed an onset of superconductivity at 92 K for the pure and 98 K for the fluorine doped sample. On further heating the fluorinated sample for 24 hours, the needle like intergrowth had disappeared as seen from SEM micrograph and the T c onset of the sample had increased to 110 K with a two step transition. Keywords: High T c superconductor, solid state reaction, XRD, SEM, T c measurement, fluorine doping. 1. INTRODUCTION The field of high critical temperature (T c ) superconductors is scientifically very much interesting and technologically worth exploring. Before 1986, no materials were found superconducting above 23 K. In 1986, the promising first high T c superconductor was discovered by Bednorz and Muller [1] in (La-Ba)-Cu-O (La214) system with a record T c of around 30 K. Wu et al. [2] reported a T c of around 92 K in the well known Y 1 Ba 2 Cu 3 O 7 (Y123) compound. For the past two decades, researchers have carried out several investigations on YBCO family and synthesized a number of compounds such as 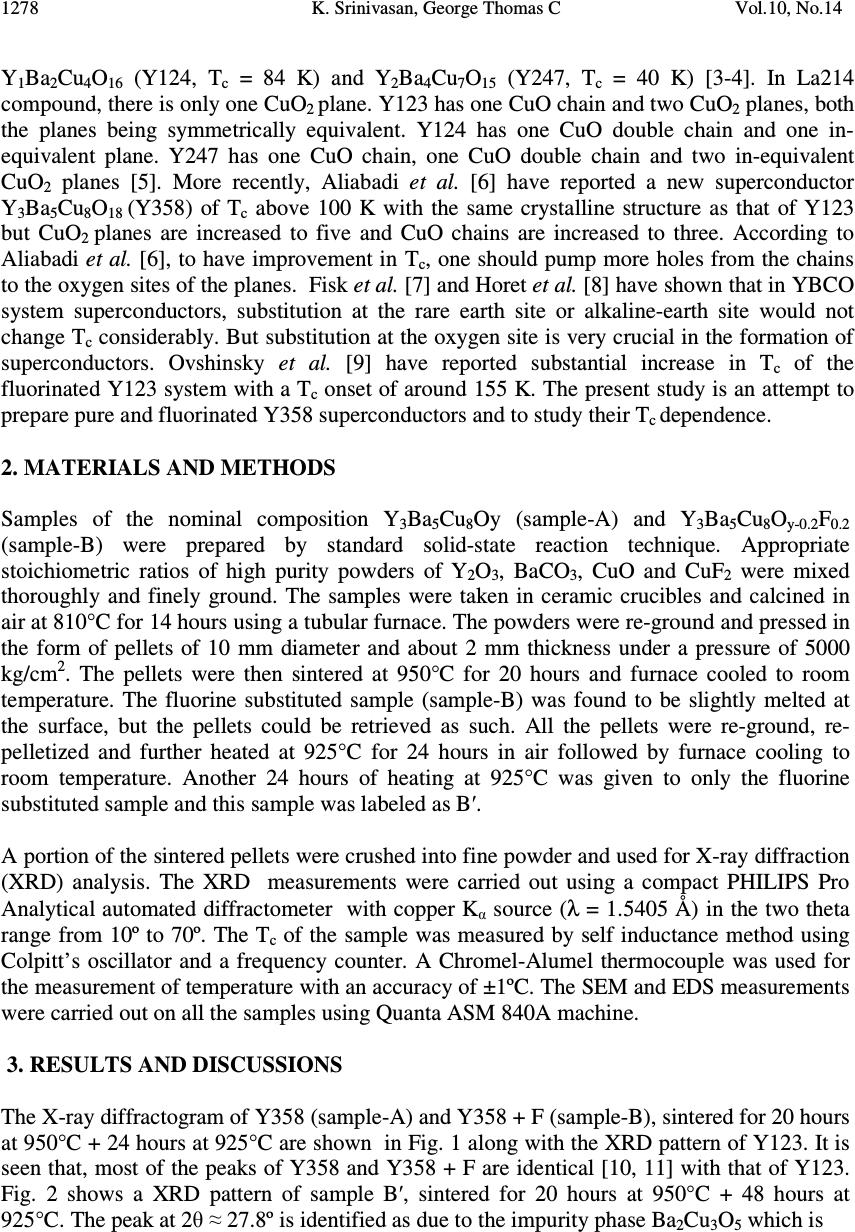 1278 K. Srinivasan, George Thomas C Vol.10, No.14 Y 1 Ba 2 Cu 4 O 16 (Y124, T c = 84 K) and Y 2 Ba 4 Cu 7 O 15 (Y247, T c = 40 K) [3-4]. In La214 compound, there is only one CuO 2 plane. Y123 has one CuO chain and two CuO 2 planes, both the planes being symmetrically equivalent. Y124 has one CuO double chain and one in- equivalent plane. Y247 has one CuO chain, one CuO double chain and two in-equivalent CuO 2 planes [5]. More recently, Aliabadi et al. [6] have reported a new superconductor Y 3 Ba 5 Cu 8 O 18 (Y358) of T c above 100 K with the same crystalline structure as that of Y123 but CuO 2 planes are increased to five and CuO chains are increased to three. According to Aliabadi et al. [6], to have improvement in T c , one should pump more holes from the chains to the oxygen sites of the planes. Fisk et al. [7] and Horet et al. [8] have shown that in YBCO system superconductors, substitution at the rare earth site or alkaline-earth site would not change T c considerably. But substitution at the oxygen site is very crucial in the formation of superconductors. Ovshinsky et al. [9] have reported substantial increase in T c of the fluorinated Y123 system with a T c onset of around 155 K. The present study is an attempt to prepare pure and fluorinated Y358 superconductors and to study their T c dependence. 2. MATERIALS AND METHODS Samples of the nominal composition Y 3 Ba 5 Cu 8 Oy (sample-A) and Y 3 Ba 5 Cu 8 O y-0.2 F 0.2 (sample-B) were prepared by standard solid-state reaction technique. Appropriate stoichiometric ratios of high purity powders of Y 2 O 3 , BaCO 3 , CuO and CuF 2 were mixed thoroughly and finely ground. The samples were taken in ceramic crucibles and calcined in air at 810°C for 14 hours using a tubular furnace. The powders were re-ground and pressed in the form of pellets of 10 mm diameter and about 2 mm thickness under a pressure of 5000 kg/cm 2 . The pellets were then sintered at 950°C for 20 hours and furnace cooled to room temperature. The fluorine substituted sample (sample-B) was found to be slightly melted at the surface, but the pellets could be retrieved as such. All the pellets were re-ground, re- pelletized and further heated at 925°C for 24 hours in air followed by furnace cooling to room temperature. Another 24 hours of heating at 925°C was given to only the fluorine substituted sample and this sample was labeled as B′. A portion of the sintered pellets were crushed into fine powder and used for X-ray diffraction (XRD) analysis. The XRD measurements were carried out using a compact PHILIPS Pro Analytical automated diffractometer with copper K α source (λ = 1.5405 Å) in the two theta range from 10º to 70º. The T c of the sample was measured by self inductance method using Colpitt’s oscillator and a frequency counter. A Chromel-Alumel thermocouple was used for the measurement of temperature with an accuracy of ±1ºC. The SEM and EDS measurements were carried out on all the samples using Quanta ASM 840A machine. 3. RESULTS AND DISCUSSIONS The X-ray diffractogram of Y358 (sample-A) and Y358 + F (sample-B), sintered for 20 hours at 950°C + 24 hours at 925°C are shown in Fig. 1 along with the XRD pattern of Y123. It is seen that, most of the peaks of Y358 and Y358 + F are identical [10, 11] with that of Y123. Fig. 2 shows a XRD pattern of sample B′, sintered for 20 hours at 950°C + 48 hours at 925°C. The peak at 2θ ≈ 27.8º is identified as due to the impurity phase Ba 2 Cu 3 O 5 which is  Vol.10, No.14 Fluorine Doping Effect 1279 Fig. 1. XRD pattern of Y123, Y358+F and Y358 Fig. 2. XRD Pattern of sample- B′ marked by symbol ‘+’ in the pattern. The small impurity peaks at 2θ ≈ 30º, 35.5º, 36.2º, 47.5º, 48.5º, 62º and 65.4 º, are marked by the symbol ‘*’ which could not be identified as that belonging to neither Y358 system nor that of the starting materials. This observation was similar to that reported by Udomsamuthirun et al. [12]. The remaining peaks of the sample B′ were indexed in an orthorhombic cell with lattice parameters a = 3.902 Å, b = 3.824 Å and c = 30.690 Å and unit cell volume of 457.931 Å 3 . The c value of the sample B′ is almost 3 times the c value of Y123 sample. Similar results were reported by Aliabadi et al. [6] but a prominent (002) peak at about 2θ ≈ 15º was not reported by them.  1280 K. Srinivasan, George Thomas C Vol.10, No.14 The sintered pellets of Y358 + F are found to be very hard compared to that of un-doped Y358 pellets. To compare the microstructure pattern of the prepared samples, SEM micrographs were recorded on polished surfaces. The SEM micrograph of pure Y358 (sample-A) is shown in Fig. 3. A few black spots in the micrograph represent pores. Fig. 4 shows the SEM image and EDS spectra of the sample doped with fluorine Y358 + F (sample- B). The fiber like inter growth may be attributed due to the partial melting of the sample during the first sintering at 950°C for 20 hours. The EDS spectra clearly indicate the presence of fluorine in the sample. Fig. 5 shows the SEM and EDS spectra of the fluorinated sample sintered for another 24 hours (total 48 hrs) at 925°C (sample-B′). Comparing Fig. 3, 4 and 5, it is evident that the grain size of the fluorine substituted sample has decreased. All the samples were porous and also the fluorine addition has increased the hardness of the pellets. Fig. 3. SEM Micrograph of sample-A The frequency versus temperature plot of sample-A is shown in Fig. 6 and that of sample B and B′ in Fig. 7. As seen from the Fig. 6, the T c onset is at 92 K for a pure sample with a frequency change of about 2 kHz showing a strong superconducting transition. Addition of fluorine had increased the onset T c to a value 98 K with a frequency change of 0.5 kHz. (Fig. 7) This lowering of the frequency change indicates that the amount of fluorine substitution (x = 0.2) may not be the optimal value required to fluorinate the entire sample. This sample when further heated at 925°C for a period of 24 hours, improved the T c onset to 110 K with a two step transition as seen from the T c curve of sample-B′ in Fig. 7. This means that the phase formation is incomplete in sample-B and on further heating, more single phase compound is formed which is inferred from the XRD of the sample-B′. Also there is a two step transition, one at 110 K and the other around 98 K indicating the presence of the sample- B phase still. 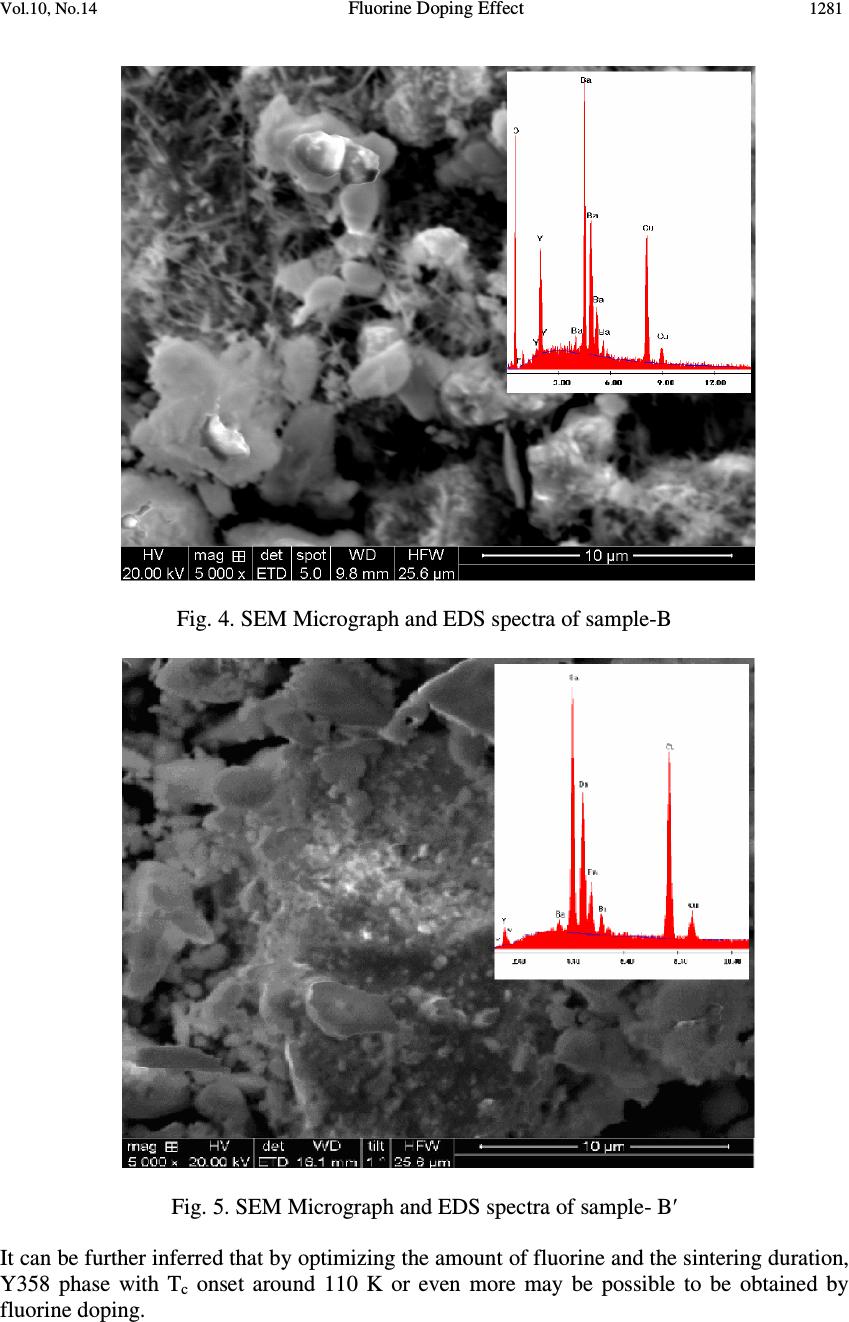 Vol.10, No.14 Fluorine Doping Effect 1281 Fig. 4. SEM Micrograph and EDS spectra of sample-B Fig. 5. SEM Micrograph and EDS spectra of sample- B′ It can be further inferred that by optimizing the amount of fluorine and the sintering duration, Y358 phase with T c onset around 110 K or even more may be possible to be obtained by fluorine doping. 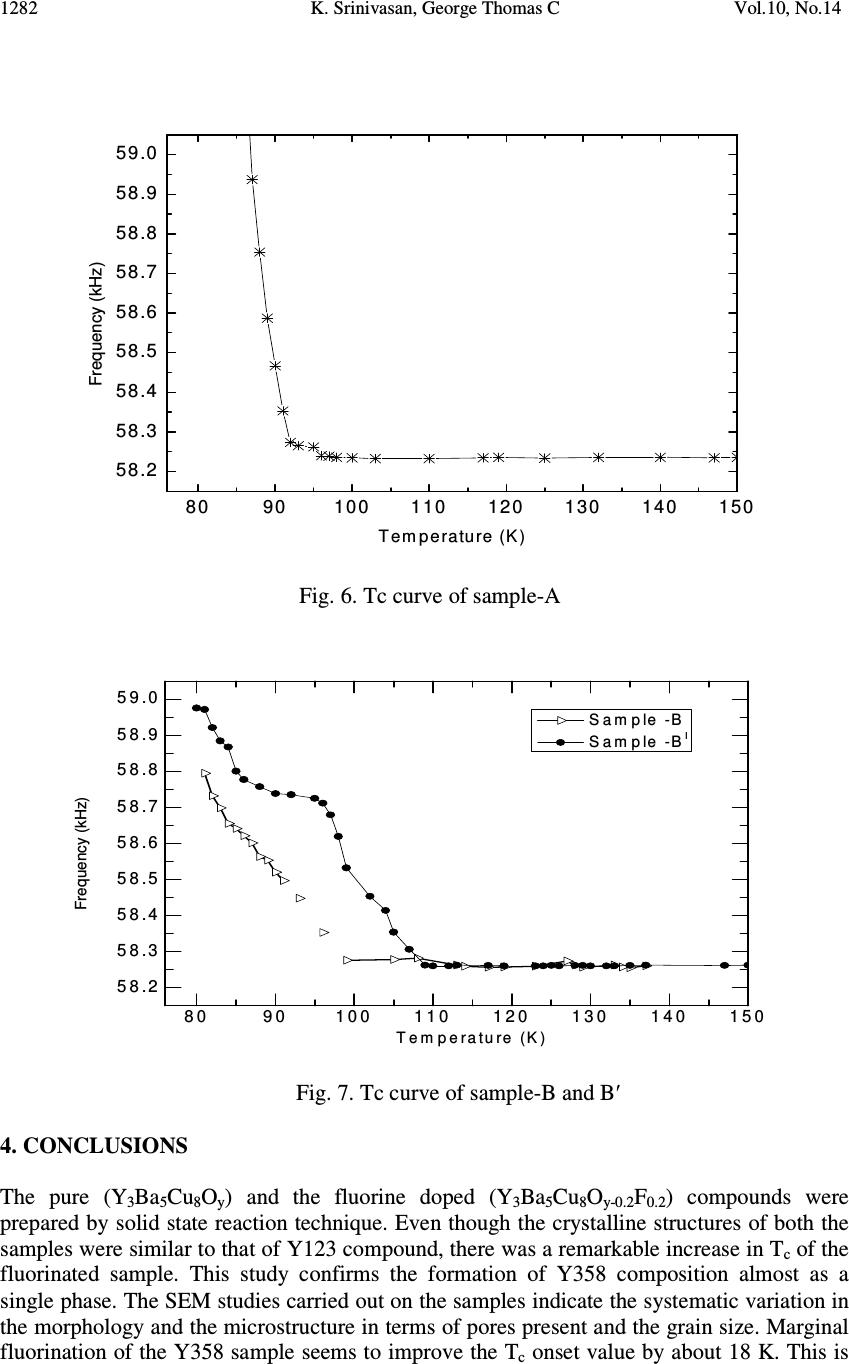 1282 K. Srinivasan, George Thomas C Vol.10, No.14 8090100 110120 130140 150 58.2 58.3 58.4 58.5 58.6 58.7 58.8 58.9 59.0 Frequency (kHz) Temperature (K) Fig. 6. Tc curve of sample-A 8 09 01 0 01 1 01 2 01 3 01 4 01 5 0 5 8 .2 5 8 .3 5 8 .4 5 8 .5 5 8 .6 5 8 .7 5 8 .8 5 8 .9 5 9 .0 Frequency (kHz) Tem perature (K) Sample -B Sample -B I Fig. 7. Tc curve of sample-B and B′ 4. CONCLUSIONS The pure (Y 3 Ba 5 Cu 8 O y ) and the fluorine doped (Y 3 Ba 5 Cu 8 O y-0.2 F 0.2 ) compounds were prepared by solid state reaction technique. Even though the crystalline structures of both the samples were similar to that of Y123 compound, there was a remarkable increase in T c of the fluorinated sample. This study confirms the formation of Y358 composition almost as a single phase. The SEM studies carried out on the samples indicate the systematic variation in the morphology and the microstructure in terms of pores present and the grain size. Marginal fluorination of the Y358 sample seems to improve the T c onset value by about 18 K. This is 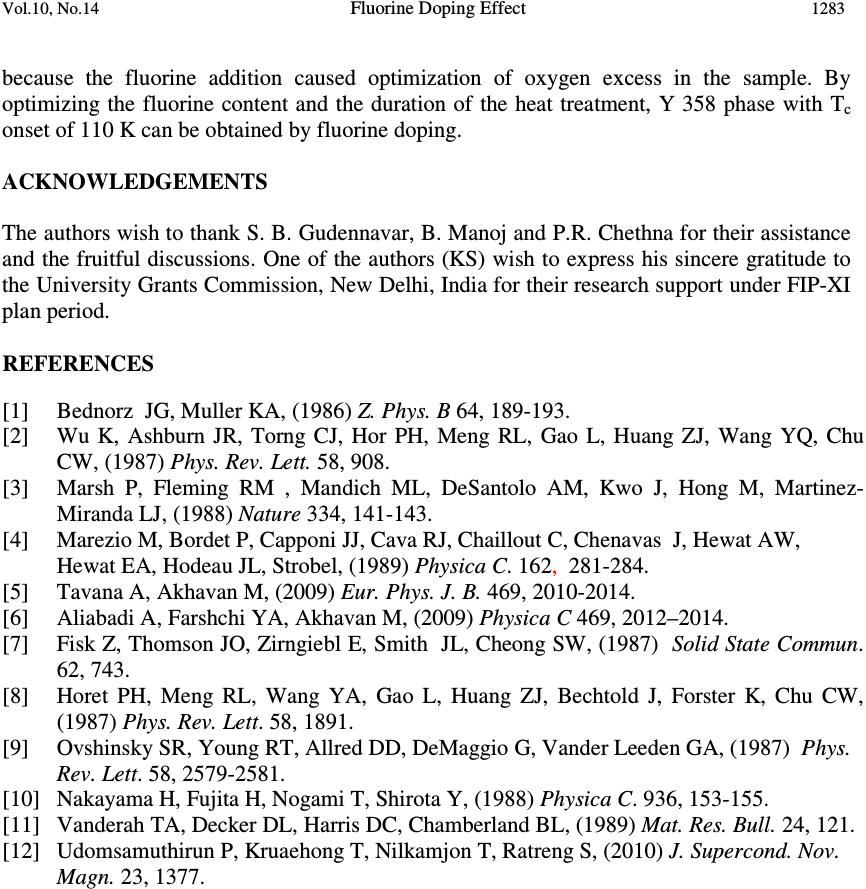 Vol.10, No.14 Fluorine Doping Effect 1283 because the fluorine addition caused optimization of oxygen excess in the sample. By optimizing the fluorine content and the duration of the heat treatment, Y 358 phase with T c onset of 110 K can be obtained by fluorine doping. ACKNOWLEDGEMENTS The authors wish to thank S. B. Gudennavar, B. Manoj and P.R. Chethna for their assistance and the fruitful discussions. One of the authors (KS) wish to express his sincere gratitude to the University Grants Commission, New Delhi, India for their research support under FIP-XI plan period. REFERENCES [1] Bednorz JG, Muller KA, (1986) Z. Phys. B 64, 189-193. [2] Wu K, Ashburn JR, Torng CJ, Hor PH, Meng RL, Gao L, Huang ZJ, Wang YQ, Chu CW, (1987) Phys. Rev. Lett. 58, 908. [3] Marsh P, Fleming RM , Mandich ML, DeSantolo AM, Kwo J, Hong M, Martinez- Miranda LJ, (1988) Nature 334, 141-143. [4] Marezio M, Bordet P, Capponi JJ, Cava RJ, Chaillout C, Chenavas J, Hewat AW, Hewat EA, Hodeau JL, Strobel, (1989) Physica C. 162, 281-284. [5] Tavana A, Akhavan M, (2009) Eur. Phys. J. B. 469, 2010-2014. [6] Aliabadi A, Farshchi YA, Akhavan M, (2009) Physica C 469, 2012–2014. [7] Fisk Z, Thomson JO, Zirngiebl E, Smith JL, Cheong SW, (1987) Solid State Commun. 62, 743. [8] Horet PH, Meng RL, Wang YA, Gao L, Huang ZJ, Bechtold J, Forster K, Chu CW, (1987) Phys. Rev. Lett. 58, 1891. [9] Ovshinsky SR, Young RT, Allred DD, DeMaggio G, Vander Leeden GA, (1987) Phys. Rev. Lett. 58, 2579-2581. [10] Nakayama H, Fujita H, Nogami T, Shirota Y, (1988) Physica C. 936, 153-155. [11] Vanderah TA, Decker DL, Harris DC, Chamberland BL, (1989) Mat. Res. Bull. 24, 121. [12] Udomsamuthirun P, Kruaehong T, Nilkamjon T, Ratreng S, (2010) J. Supercond. Nov. Magn. 23, 1377. |