Paper Menu >>
Journal Menu >>
 Journal of Minerals & Materials Characterization & Engineering, Vol. 10, No.11, pp.1061-1075, 2011 jmmce.org Printed in the USA. All rights reserved 1061 High Temperature Oxidation and Hot Corrosion Behaviour of 9Cr 1Mo Ferritic Cold Rolled Steel in Air at 900°C under Cyclic Condition Amarish K. Shukla a* , Dinesh Gond b , M. Bharadwaj a , D. Puri a a Metallurgical & Materials Engineering Department, Indian Institute of Technology Roorkee, India b HEEP, Bharat Heavy Electricals Limited, Haridwar.(Government Of India Undertaking), India * Corresponding Author: amarishshukla1@gmail.com ABSTRACT The oxidation behaviour of 10%, 30%, and 50% cold rolled and unprocessed 9Cr 1Mo ferritic steels in air have been studied under isothermal conditions at a temperature of 900°C in a cyclic manner. Oxidation kinetics was established for all samples on which experiment was conducted in air at 900°C under cyclic conditions for 50 cycles by thermogravimetric technique. Each cycle consisted of 1 hour heating at 900°C followed by 20 min of cooling in air. 10% cold rolled sample followed parabolic rate of oxidation while 30% cold rolled sample showed accelerated rate of weight gain. X-ray diffraction (XRD) and scanning electron microscopy/energy dispersive X-ray (SEM/EDAX) techniques were used to characterise the oxidized sample and their scales. 10% cold rolled steel was found to be more corrosion resistance than other in air oxidation for 50 cycles. Keywords: Hot corrosion; cold rolling; cyclic oxidation. 1. INTRODUCTION Mechanical properties and especially deep-drawing properties of ultra low carbon steels strongly depend on their crystallographic texture that develops during final treatment of recrystallization. The recrystallization features depend on the deformation sub-structure formed during cold rolling [1]. Ferritic steels, containing chromium and molybdenum are well known for their excellent mechanical properties combining high temperature strength and creep resistance with high thermal fatigue life, as well as with good thermal conductivity, weldability, and resistance to corrosion and graphitisation. Because of these characteristics, this type of steels have attracted special interest for application in industrial processes related to carbochemistry, oil refining, carbon gasification and energy generation in thermal power plants, where components like heat 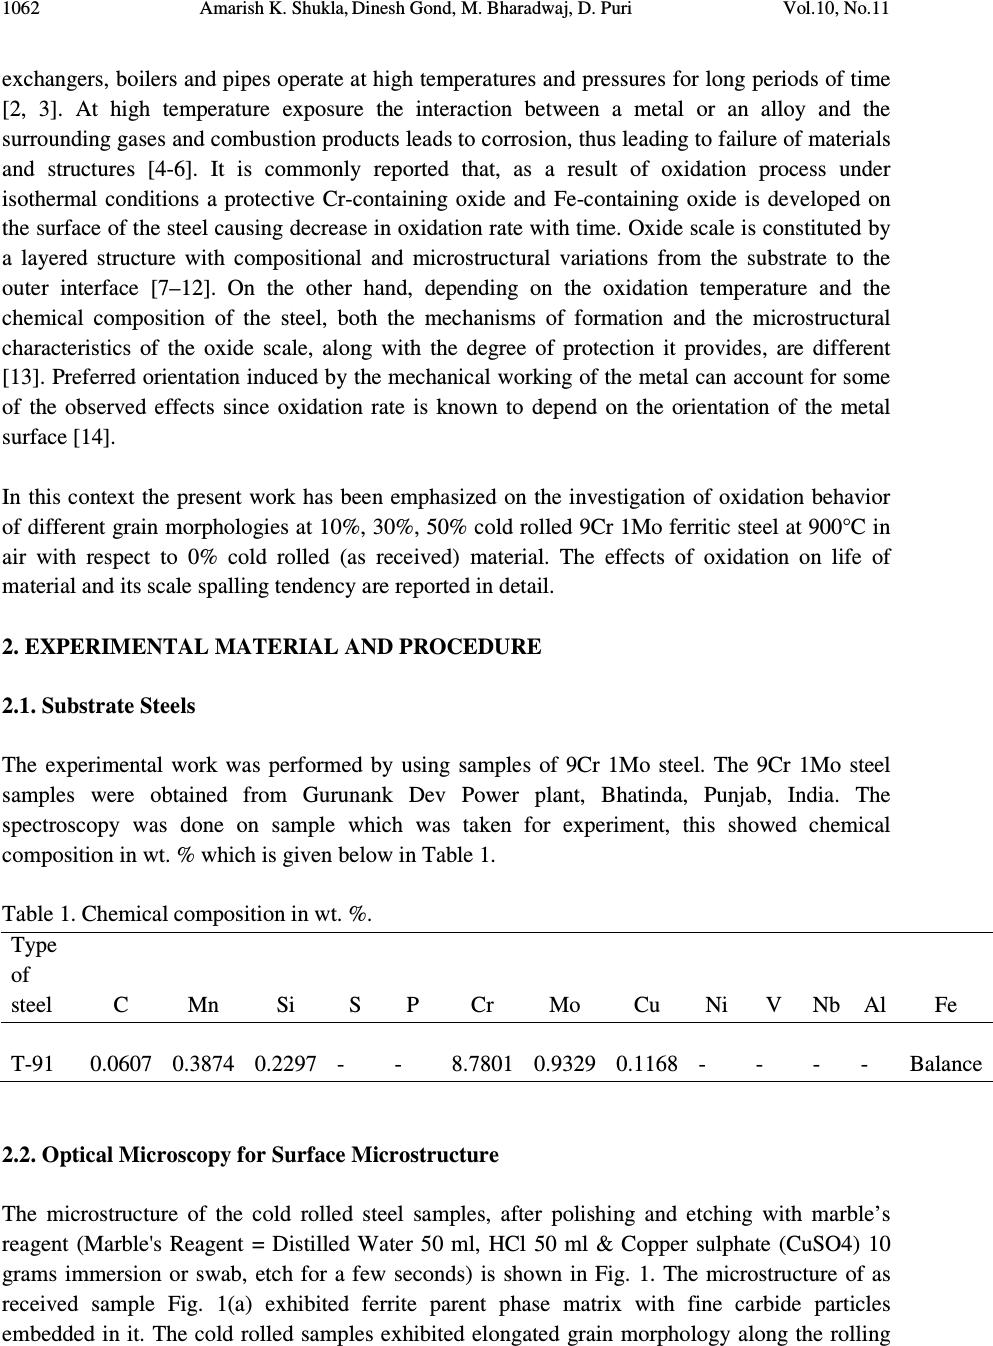 1062 Amarish K. Shukla, Dinesh Gond, M. Bharadwaj, D. Puri Vol.10, No.11 exchangers, boilers and pipes operate at high temperatures and pressures for long periods of time [2, 3]. At high temperature exposure the interaction between a metal or an alloy and the surrounding gases and combustion products leads to corrosion, thus leading to failure of materials and structures [4-6]. It is commonly reported that, as a result of oxidation process under isothermal conditions a protective Cr-containing oxide and Fe-containing oxide is developed on the surface of the steel causing decrease in oxidation rate with time. Oxide scale is constituted by a layered structure with compositional and microstructural variations from the substrate to the outer interface [7–12]. On the other hand, depending on the oxidation temperature and the chemical composition of the steel, both the mechanisms of formation and the microstructural characteristics of the oxide scale, along with the degree of protection it provides, are different [13]. Preferred orientation induced by the mechanical working of the metal can account for some of the observed effects since oxidation rate is known to depend on the orientation of the metal surface [14]. In this context the present work has been emphasized on the investigation of oxidation behavior of different grain morphologies at 10%, 30%, 50% cold rolled 9Cr 1Mo ferritic steel at 900°C in air with respect to 0% cold rolled (as received) material. The effects of oxidation on life of material and its scale spalling tendency are reported in detail. 2. EXPERIMENTAL MATERIAL AND PROCEDURE 2.1. Substrate Steels The experimental work was performed by using samples of 9Cr 1Mo steel. The 9Cr 1Mo steel samples were obtained from Gurunank Dev Power plant, Bhatinda, Punjab, India. The spectroscopy was done on sample which was taken for experiment, this showed chemical composition in wt. % which is given below in Table 1. Table 1. Chemical composition in wt. %. Type of steel C Mn Si S P Cr Mo Cu Ni V Nb Al Fe T-91 0.0607 0.3874 0.2297 - - 8.7801 0.9329 0.1168 - - - - Balance 2.2. Optical Microscopy for Surface Microstructure The microstructure of the cold rolled steel samples, after polishing and etching with marble’s reagent (Marble's Reagent = Distilled Water 50 ml, HCl 50 ml & Copper sulphate (CuSO4) 10 grams immersion or swab, etch for a few seconds) is shown in Fig. 1. The microstructure of as received sample Fig. 1(a) exhibited ferrite parent phase matrix with fine carbide particles embedded in it. The cold rolled samples exhibited elongated grain morphology along the rolling 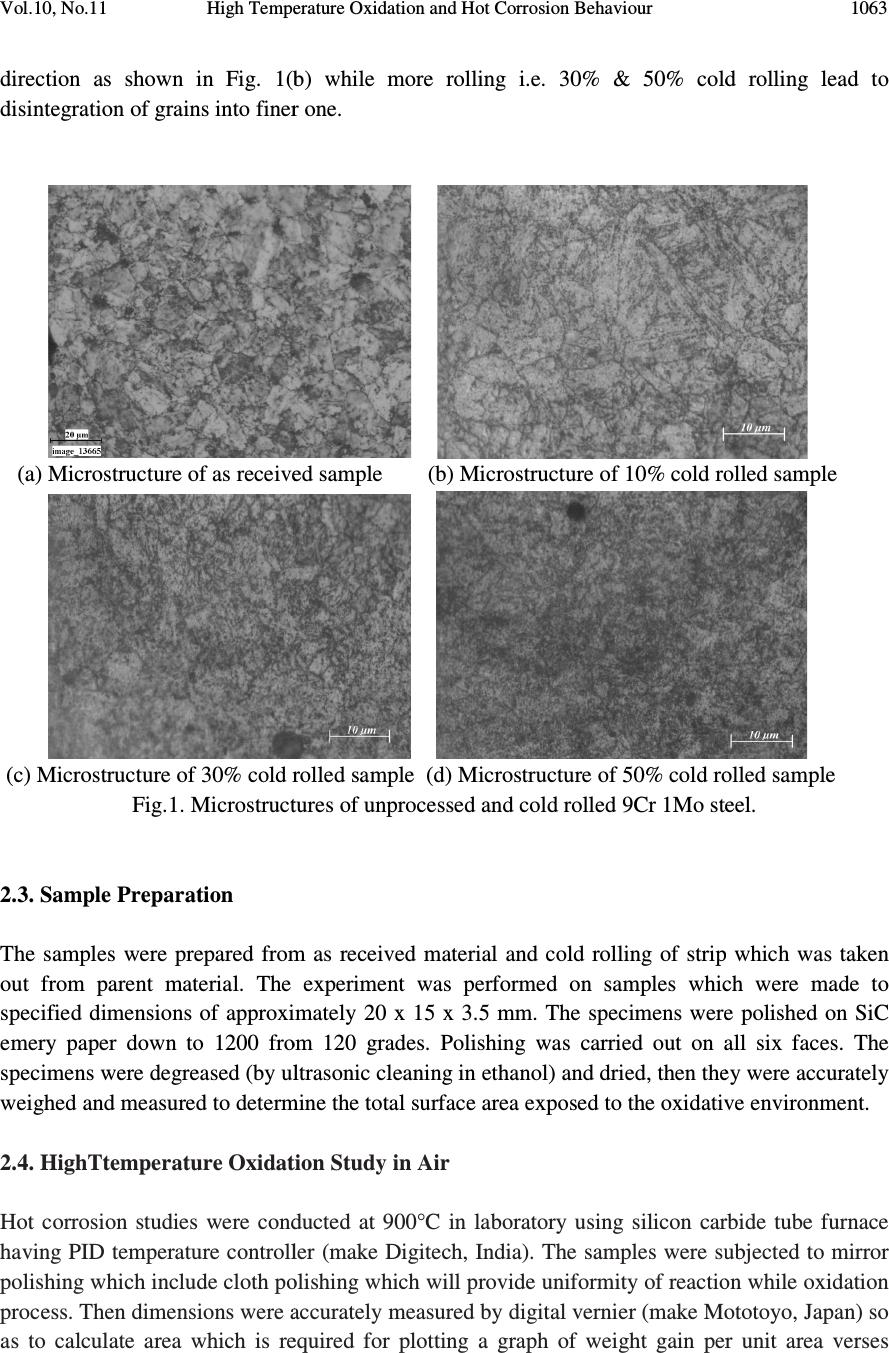 Vol.10, No.11 High Temperature Oxidation and Hot Corrosion Behaviour direction as shown in Fig. 1(b) while more rolling i.e. 30% & 50% cold rolling lead to disintegration of grains into finer one. (a) Microstructure of as received (c) Microstructure of 30% cold rolled sample Fig.1. Microstructures of unprocessed and cold rolled 9Cr 1Mo steel 2.3. Sample Preparation The samples were prepared from as received material and cold rolling of strip which was taken out from parent material. The experiment was performed on samples which were made to specified dimensions of approximately 20 x 15 x 3.5 mm. T emery paper down to 1200 from 120 grades. Polishing was carried out on all six faces. The specimens were degreased (by ultrasonic cleaning in ethanol) and dried, then they were accurately weighed and measured to determine 2.4. HighTtemperature O xidation Hot corrosion studies were conducted at 900°C in laboratory using silicon carbide tube furnace having PID temperature controller (make Digitech polishing which include cloth polishing which will provide uniformity of reaction while oxidation process. Then dimensions were accurately measured by digital ve as to calculate area which is required for plotting High Temperature Oxidation and Hot Corrosion Behaviour direction as shown in Fig. 1(b) while more rolling i.e. 30% & 50% cold rolling lead to disintegration of grains into finer one. received sample (b) Microstructure of 10% cold rolled sample Microstructure of 30% cold rolled sample (d) Microstructure of 5 0% cold rolled sample Fig.1. Microstructures of unprocessed and cold rolled 9Cr 1Mo steel The samples were prepared from as received material and cold rolling of strip which was taken The experiment was performed on samples which were made to specified dimensions of approximately 20 x 15 x 3.5 mm. T he specimens were polished on SiC emery paper down to 1200 from 120 grades. Polishing was carried out on all six faces. The specimens were degreased (by ultrasonic cleaning in ethanol) and dried, then they were accurately weighed and measured to determine the total surface area exposed to the oxidative environment. xidation Study in Air Hot corrosion studies were conducted at 900°C in laboratory using silicon carbide tube furnace having PID temperature controller (make Digitech , India). The samples were subjected to mirror polishing which include cloth polishing which will provide uniformity of reaction while oxidation process. Then dimensions were accurately measured by digital ve rnier (make Mototoyo, Japan) so required for plotting a graph of weight gain per unit area verses 1063 direction as shown in Fig. 1(b) while more rolling i.e. 30% & 50% cold rolling lead to 10% cold rolled sample 0% cold rolled sample Fig.1. Microstructures of unprocessed and cold rolled 9Cr 1Mo steel . The samples were prepared from as received material and cold rolling of strip which was taken The experiment was performed on samples which were made to he specimens were polished on SiC emery paper down to 1200 from 120 grades. Polishing was carried out on all six faces. The specimens were degreased (by ultrasonic cleaning in ethanol) and dried, then they were accurately the total surface area exposed to the oxidative environment. Hot corrosion studies were conducted at 900°C in laboratory using silicon carbide tube furnace , India). The samples were subjected to mirror polishing which include cloth polishing which will provide uniformity of reaction while oxidation (make Mototoyo, Japan) so graph of weight gain per unit area verses  1064 Amarish K. Shukla, Dinesh Gond, M. Bharadwaj, D. Puri Vol.10, No.11 number of cycle. Finally specimens were cleaned i.e. degreased by ethanol and kept in alumina boat. This alumina boat prior to performing of experiment was kept in oven for 5hr at 250°C in oven and then kept in furnace at 900°C for 2hr so that moisture is totally removed from boat. After this the sample was kept in boat and weight was taken initially and then slowly inserted in tubular furnace. These samples were kept in furnace for 1 hr at a temperature of 900°C and then they were removed and cooled further for 20 minutes at room temperature and their weight were taken by electronic balance (make Contech, India) having sensitivity of 0.001 gms. Spalled scale was also taken into consideration which used to fall into the boat i.e. the weight was taken along with the boat. This cycle was repeated for 50 times i.e. 50 cycles were made for each sample. Corroded samples from air oxidation were analysed by XRD (BRUKER-binary V3) and SEM/EDAX and the oxide scale which fell into the boat were also analysed by XRD. Cu radiation was used in XRD at a step of 2°/min and the range of angle was 5-100°. 3. EXPERIMENTAL RESULTS 3.1. Behaviour in Air at Elevated Temperature The oxidation of sample which occurred in air at a temperature of 900°C is shown by plotting a graph in Fig. 2. On x-axis “number of cycles” and on y-axis “weight gain/area (mg/cm 2 )” was taken. The hot corrosion behaviour of as 0% cold rolled sample in air was somewhat linear and 30% cold rolled sample showed more accelerated rate of weight gain because the oxide layer formed on substrate got peeled off very easily. On the other hand 10% & 50% cold rolled steel’s weight gain behaviour was parabolic. From the weight gain calculation 10% & 50% cold rolled steel showed 49.73% & 27.67% more protection respectively as compared to as 0% cold rolled steel while 30% cold rolled steel showed 55% more degradation with respect to 0% cold rolled steel. The graph Fig. 2(a) reveals that 10% cold rolled steel is better than other processed and unprocessed steel in an environment of air oxidation (for 50 cycles) Every line or curve in graph is having its approximate equation which is given below. For unprocessed steel (0% cold rolled) the approximated curve equation is Y = 242.15808 -124.7786*X + 14.77026*X^2 - 0.22976*X^3 + 3.57076E-4*X^4 + 2.16457E- 5*X^5 For 10% cold rolled steel the approximated curve equation is Y = 1.73448 + 48.78231*X - 5.80827*X^2 + 0.6895*X^3 - 0.02068*X^4 + 1.87266E-4*X^5 For 30% cold rolled steel the approximated curve equation is  Vol.10, No.11 High Temperature Oxidation and Hot Corrosion Behaviour Y = - 620.92963 + 296.84668*X 4*X^5 For 50% cold rolled steel the approximated curve equation is Y = -27.72082 + 31.34906*X - 1.34052*X^2 + 0.70314*X^ (Where X is number of cycle and Y is weight gain/area & this equation is calculated by using analysis mode of Origin software) is given in Table 2 Table 2. Value of the rate constant Description 0% cold rolled steel (as received) 10% cold rolled steel 30% cold rolled steel 50% cold rolled steel Fig. 2(a). Weight gain vs. number of cycles Fig. 2(b). (Weight gain/area) Fig.2. Weight gain plots for as received, 10%, 30%, 50% cold rolled steel exposed to cyclic oxidation study in air at 900°C for 50 cycles. 3.2. X-Ray Diffraction A nalysis The samples and their scales after oxidation were removed from boat and they were analysed separately by XRD and after that only oxidised sample were analysed by SEM /EDAX. The results of XRD analysis contained graph indicating peak values (i.e. d values) identify various phases with the help of inorganic X High Temperature Oxidation and Hot Corrosion Behaviour 620.92963 + 296.84668*X - 4.00389*X^2 + 1.25443*X^3 - 0.03985*X^4 + 3.85381E For 50% cold rolled steel the approximated curve equation is 1.34052*X^2 + 0.70314*X^ 3 - 0.02478*X^4 + 2.43383E (Where X is number of cycle and Y is weight gain/area & this equation is calculated by using of Origin software) . Rate constant K p calculated for various sample from Fig 2(b) Value of the rate constant (K p ) for samples subjection to air oxidation at 900°C. K p (10 - 6 g 2 cm - 4 s - 1 ) 64 21 184 43 Fig. 2(a). Weight gain vs. number of cycles Fig. 2(b). (Weight gain/area) 2 vs. number of cycles plot Weight gain plots for as received, 10%, 30%, 50% cold rolled steel exposed to cyclic oxidation nalysis The samples and their scales after oxidation were removed from boat and they were analysed separately by XRD and after that only oxidised sample were analysed by SEM /EDAX. The results of XRD analysis contained graph indicating peak values (i.e. d values) which were used to identify various phases with the help of inorganic X - ray Diffraction data card from Powder 1065 0.03985*X^4 + 3.85381E - 0.02478*X^4 + 2.43383E -4*X^5 (Where X is number of cycle and Y is weight gain/area & this equation is calculated by using calculated for various sample from Fig 2(b) ) for samples subjection to air oxidation at 900°C. vs. number of cycles plot Weight gain plots for as received, 10%, 30%, 50% cold rolled steel exposed to cyclic oxidation The samples and their scales after oxidation were removed from boat and they were analysed separately by XRD and after that only oxidised sample were analysed by SEM /EDAX. The which were used to ray Diffraction data card from Powder  1066 Amarish K. Shukla, Dinesh Gond, M. Bharadwaj, D. Puri Vol.10, No.11 diffraction file of JCPDS. Help of Philips X’ pert High score software was also taken for finding out compounds at respective peaks. 3.2.1. XRD result for 0%, 10%, 30%, 50% cold rolled air oxidised sample From the X-Ray Diffraction analysis it is found that ferrous oxide (Fe 2 O 3 ), chromium ferrous oxide (Cr, Fe) 2 O 3 are mainly formed in all samples along with Cr 2 O 3 in 0% cold rolled air oxidised sample (0% CR and 0% CR SS) Fig.3 where CR & SS resembles cold rolled and sputtered scales respectively. Fe 2 O 3 , Cr 2 O 3 form a protective oxide layer at surface due to which further oxidation is prevented as it acts as barrier for further corroding media to interact with substrate but at initial stage as the substrate material was in direct contact of corroding media so there was accelerated corrosion at initial stage. In case of 30% CR sample it is seen that in this only Fe 2 O 3 is mainly formed and no trace of chromium oxide is present, this is also major factor which led to accelerated rate of weight gain. Fig.3. XRD patterns for 0%, 10%, 30%, and 50% cold rolled steel subjected to cyclic oxidation in air at 900°C after 50 cycles. 3.3. Energy Dispersive X-ray (EDAX) Studies 3.3.1. Surface scale 20 30 40 50 60 7080 β β β β β β β β β β β β β β β β β β β β α α α α α α α α α α α α β β β β β β β β β β β β α α α α α α α α α α α α α α α α α α α α α α α α α α α α β β β β β β β β β β β β β β β β β β β β β β β β β β β β β β β β β β β β β β β ββ β β β β β β β β β β β α α α α α α α α α α α α α α α αα α α α α α α α α α α α α α α α α α α α α α α α α α α α α α α α α α α α α α α α α α α α α α α α α α α α α α α α α α α α α α α α α α α α α α α α α α α α α αα α Fe 2 O 3 β ββ β (Cr,Fe) 2 O 3 γ γγ γ Cr 2 O 3 γ γ γ γ β β β β β β β β β β β β β β β β β β β β β β β ββ β β β β β β β β β β β β β β β β β β β β β β β α α α α α α α αα α α α α α α α α α α α α α α α α α α αα α α α α α α α α α α α α α α α α α α α γ γ γ γ β β β β α α α α 50% CR SS 50% CR Sample 30% CR SS 30% CR Sample 0% CR SS 10% CR SS 10% CR Sample 0% CR Sample Intensity (Arbitrary Constant) Diffraction Angle (2 θ θθ θ )  Vol.10, No.11 High Temperature Oxidation and Hot Corrosion Behaviour 1067 The SEM/EDAX analysis for 0% cold rolled sample after oxidation in air for 50 cycles at 900°C is shown in Fig 4(a). The oxide scale reveals the dominance of Fe 2 O 3 and along with the compounds of Mo 2 O 3 and Cr 2 O 3 . The obtained morphology indicates that the oxide formed is layer wise, i.e. one below the other and the weight wise composition is approximately same but it greatly differs in case of Cr content. The upper layer contains nearly no Cr but the lower layer is rich in Cr content. Fig. 4(a) 0% cold rolled air oxidised sample at scale of 100µm.  1068 Amarish K. Shukla, Dinesh Gond, M. Bharadwaj, D. Puri Vol.10, No.11 Fig. 4(b) 10% cold rolled air oxidised sample at scale of 50µm. Fig. 4(c) 30% cold rolled air oxidised sample at scale of 50µm.  Vol.10, No.11 High Temperature Oxidation and Hot Corrosion Behaviour 1069 Fig. 4(d) 50% cold rolled air oxidised sample at scale of 100µm. Fig 4. Surface scale morphology and EDAX analysis (wt. %) for 0%, 10%, 30%, 50% cold rolled sample subjected to the cyclic oxidation at 900°C for 50 cycles in air. EDAX analysis of 10% cold rolled air oxidized sample Fig. 4(b) reveals that the oxide layer formed mainly consists of combined compound of ferrous chromium oxide (Fe, Cr) 2 O 3 along with less amount of Mo compound. Surface analysis of oxidized 30% cold rolled sample Fig. 4(c) reveals that in this case mainly ferrous oxide (Fe 2 O 3 ) is formed which supports the XRD results. Trace amount of chromium is found in this case which indicates very less amount of chromium oxide formation independently or in combined state of ferrous i.e. Cr 2 O 3 or (Fe, Cr) 2 O 3 which is mainly responsible for prevention of corrosion, hence this is the main factors responsible for accelerated rate of weight gain in this case. EDAX analysis of 50% cold rolled air oxidized sample Fig. 4(d) shows that oxide layer formed mainly consists of Fe 2 O 3 and some amount of (Fe, Cr) 2 O 3 , due to which the degradation of material was restricted. 3.3.2. Cross-sectional scale The cross sectional analysis of 0% cold rolled air oxidised sample Fig. 5(a) shows a thin oxide layer formed on surface which shows that till point 5 all elements are constant in weight percent and after that ferrous starts to deplete and oxygen rises slightly. At point 8 all the elemental wt. % goes down. Cross sectional analysis of 10% cold rolled air oxidised sample Fig. 5(b) shows  1070 Amarish K. Shukla, Dinesh Gond, M. Bharadwaj, D. Puri Vol.10, No.11 Fig. 5(a). Elemental composition variation across the cross section of 0% cold rolled steel at 900°. Fig. 5(b). Elemental composition variation across the cross section of 10% cold rolled steel at 900°. Fig. 5(c). Elemental composition variation across the cross section of 30% cold rolled steel at 900°. Fig. 5(d). Elemental composition variation across the cross section of 50% cold rolled steel at 900°.  Vol.10, No.11 High Temperature Oxidation and Hot Corrosion Behaviour 1071 that oxide layer formed is slightly separated from parent surface. Oxide layer at interface is rich in Cr with respect to other point of analysis while the overall point of analysis graph reveals the dominance of Fe & O till outer layer. 30% cold rolled sample Fig. 5(c) reveals very unstable elemental consistency due to fragmentation of oxide layer into various sub parts. In this case, from point 2 weight percent of various elements especially Fe starts to deplete and it goes to minimum at point 4 where cavities are present. After point 4 due to somewhat stable structure of oxide layer elemental consistency goes on incremental rate. From this micrograph, it is very clear that the oxide layer at interface is non uniform which lead to prevention of parabolic nature of corrosion, hence resulting in accelerated rate of weight gain. Cross sectional analysis of 50% cold rolled air oxidised sample Fig. 5(d) shows constant wt. % of all elements throughout the graph. In this particular graph oxide layer is not visible, because while oxidation the oxide layer, which was formed got peeled of instantly, hence there was very less oxide layer formation on substrate. Fig.6. BSEI and elemental X-ray mapping of the cross-section of 0% cold rolled sample exposed to cyclic hot corrosion in air at 900°C for 50 cycles. 3.3.3 X-Ray mapping Elemental x-ray mapping analysis of 0% cold rolled air oxidised sample is shown in Fig. 6. The micrograph indicates a thin oxide scale which mainly contains chromium and oxygen with some amount of manganese. X-ray mapping analysis of 10% cold rolled air oxidised sample Fig. 7 indicates that oxide layer has got separated from substrate and the adjoining oxide layer mainly consists of Fe, Cr & O. Oxide film at surface has dense layer of ferrous while in between the substrate and outer oxide layer Cr & Fe are present with overall influence of oxygen. Mo & Mn are uniformly present all over in very less quantity. BSEI Substrate Oxide O Mo Fe Mn Cr  1072 Amarish K. Shukla, Dinesh Gond, M. Bharadwaj, D. Puri Vol.10, No.11 Fig.7. BSEI and elemental X-ray mapping of the cross-section of 10% cold rolled sample exposed to cyclic hot corrosion in air at 900°C for 50 cycles. X-ray mapping analysis of 30% cold rolled air oxidised sample Fig. 8 indicates that oxide layer got partially separated from substrate and voids in-between oxide layer consists of Si which may have occurred while polishing on grit paper. In this at interface dense layer of Cr is present and after that Fe is seen till end while O is found consistently all over the area. Small amount of Mn & Mo is also present all over the area. As in case of 50% cold rolled air oxidised sample the oxide layer which formed got peeled of very instantly hence thick protective oxide layer was unable to form and from the X-ray mapping analysis of this Fig. 9 indicates dense layer of Fe & Cr. 4. DISCUSSION The results which were seen till now resembles that corrosion resistance property of 10% cold rolled 9Cr1Mo steel is better than other mechanically processed and unprocessed steel. BSEI Substrate Oxide O Mn Fe Cr Mo  Vol.10, No.11 High Temperature Oxidation and Hot Corrosion Behaviour 1073 Fig.8. BSEI and elemental X-ray mapping of the cross-section of 30% cold rolled sample exposed to cyclic hot corrosion in air at 900°C for 50 cycles. Extrusion of materials from beneath and oxide protrusions are believed to be due to the greater specific volume of oxides similar to the findings of N.S. Bornstein [15]. U.K. Chatterjee [16] has proposed that the cracking of the scale results from the enrichment by Mo at the substrate scale interface, where MoO 2 is formed. This oxide converts into MoO 3 on further oxidation, which is in liquid form at the given temperature of exposure and penetrates along the alloy scale interface. Internal oxidation led to the cracking of the scale due to the different thermal expansion coefficients of oxides in the scale from that of coating as suggested by P. Niranatlumpong [17]. This has further been supported by the findings of R.A. Rapp and P.S. Liu [18-19], where it has been observed that development of stresses is due to difference in thermal expansion coefficients. As there are various elements and each have different thermal coefficient of expansion hence there will be more stress generated which will lead to more cracking. Through these cracks, corrosive gases can penetrate to the base material and will thus allow significant grain boundary corrosion attack [20-21]. BSEI Substrate Oxide O Mo Mn Fe Cr Si  1074 Amarish K. Shukla, Dinesh Gond, M. Bharadwaj, D. Puri Vol.10, No.11 Fig. 9. BSEI and elemental X-ray mapping of the cross-section of 30% cold rolled sample exposed to cyclic hot corrosion in air at 900°C for 50 cycles. 5. CONCLUSION The cyclic oxidation of 0% cold rolled 9Cr 1Mo steel in air follows linear rate of weight gain but due to specific orientation of grain which occurred by 30% cold rolling accelerated rate of weight gain was resulted. Due to occurrence of such specific undesirable feature, formation of Cr 2 O 3 was restricted due to which protection layer was not formed. Due to this desired protection was prevented furthermore fragmentation of oxide layer led to penetration of oxidising media to interface through cracks and pores which led to accelerated rate of weight gain. On the other hand due to appropriate cold work i.e. 10% & 50% cold rolling favourable grain orientation was achieved which supported the formation of chromium oxide in combined form leading to formation of (Fe, Cr) 2 O 3 . In 30% cold rolled steel 55% excess degradation occurred with respect to 0% cold rolled steel while in case of 50% and 10% cold rolled steel protection achieved was 26.67% & 49.73% respectively. Thus 10% cold rolling gives best mechanical processing criterion for high temperature work as compared to 0%, 30%, 50% cold rolling. REFERENCES [1] Aurelie Wauthier, Helene Regle, Jorge Formigoni, Gwenola Herman, “The effects of asymmetrical cold rolling on kinetics, grain size and texture in IF steels”, Materials Characterization 60 (2009), 90-95. BSEI Substrate Oxide Mo Mn Fe Cr O  Vol.10, No.11 High Temperature Oxidation and Hot Corrosion Behaviour 1075 [2] J.C. Van Wortel, C.F. Etienne, F. Arav, Application of modified 9chromium steels in power generation components, in: VDEh ECSC Information Day, The Manufacture and Properties of Steel91 for the Power Plant and Process Industries, Dusseldorf, 5th November, 1992, paper 4.2. [3] T. Fujita, “Current progress in advanced high Cr steel for high temperature applications” ISIJ Int. 32 (2) (1992), 175. [4] G.E. Birchenall, “A brief history of the study of oxidation of metals and alloys, in: High Temperature Corrosion”, Proceedings, NACE, San Diego, CA, 1981, 3. [5] D.A. Jones, “Principles and Prevention of Corrosion”, second ed., Prentice Hall, USA, 1996. [6] P. Kofstad, “High-temperature Corrosion”, Elsevier Applied Science, London, 1988, pp. 382–385 (Chapter 11). [7] I. Saeki, T. Saito, R. Furuichi, M. Itoh, “Growth process of protective oxides formed on type 304 and 430 stainless steels at 1273°K”, Corros. Sci. 40 (8) (1998), 1295. [8] S. Jianian, Z. Longjiang, L. Tiefan, “High temperature oxidation of Fe–Cr alloys in wet oxygen”, Oxid. Met. 48 (3, 4) (1997), 347. [9] Z. Tokei, H. Viefhaus, H.J. Grabke, “Initial stages of oxidation of a 9CrMoV steel: role of segregation and martensite laths”, Appl. Surf. Sci. 165 (1) (2000), 23. [10] A.P. Greeff, C.W. Louw, H.C. Swart, “The oxidation of industrial FeCrMo steel”, Corros. Sci. 42 (10) (2000), 1725. [11] A. Arztegui, T. Gomez-Acebo, F. Castro, “Steam oxidation of ferritic steels: kinetics and microstructure”, Bol. Soc. Esp. Ceram. Vidr. 39 (3) (2000), 305. [12] A.S. Khanna, P. Rodriguez, J.B. Gananamoorthy, “Oxidation kinetics, breakaway oxidation, and inversion phenomenon in 9Cr–1Mo steels”, Oxid. Met. 26 (3, 4) (1986), 171. [13] Dionisio Laverde, Tomas Gomez-Acebo, Francisco Castro, “Continuous and cyclic oxidation of T-91 ferritic steel under steam”, Corrosion Science 46, 2 July 2003, 613–631. [14] D. Caplan, M. Cohen, “Effect of cold work on the oxidation of iron from 400-650°C”, Pergamon Press Ltd. Great Britain, Corrosion Science. 1966, Vol. 6, 321 - 335. [15] N.S. Bornstein, M.A. Decrescente, H.A. Roth, MMIC-75-27, Columbus, Ohio, USA, (1975) 115. [16] C. Batista, A. Portinha, R.M. Ribeiro, V. Teixeira, C.R. Oliveira, Surf. Coat. Technol. 200 (2006) 6783–6791. [17] P. Niranatlumpong, C.B. Ponton, H.E. Evans, Oxid. Met. 53 (3–4) (2000) 241. [18] R.A. Rapp, J.H. Devan, D.L. Douglass, P.C. Nordine, F.S. Pettit, D.P.Whittle, Mater. Sci.Eng.50 (1981) 1. [19] P.S. Liu, K.M. Liang, H.Y. Zhou, S.R. Gu, X.F. Sun, H.R. Guan, T. Jin, K.N. Yang, Surf. Coat. Technol. 145 (2001) 75. [20] Kimura K, Kushima H, Abe F, Yagi K, Irie H. In: Strang A, Banks WM, Conroy RD, Goulette MJ, “Advances in turbine materials, design and manufacturing”. London: The Institute of Materials, (1997) 257–69. [21] J. Orr, A. Di Gianfrancesco, “The e ff ect of compositional variations on the properties of steel 91, in: VDEh ECSC Information Day, The Manufacture and Properties of Steel 91 for the Power Plant and Process Industries”, Dusseldorf, (1992) 2.4. |