Paper Menu >>
Journal Menu >>
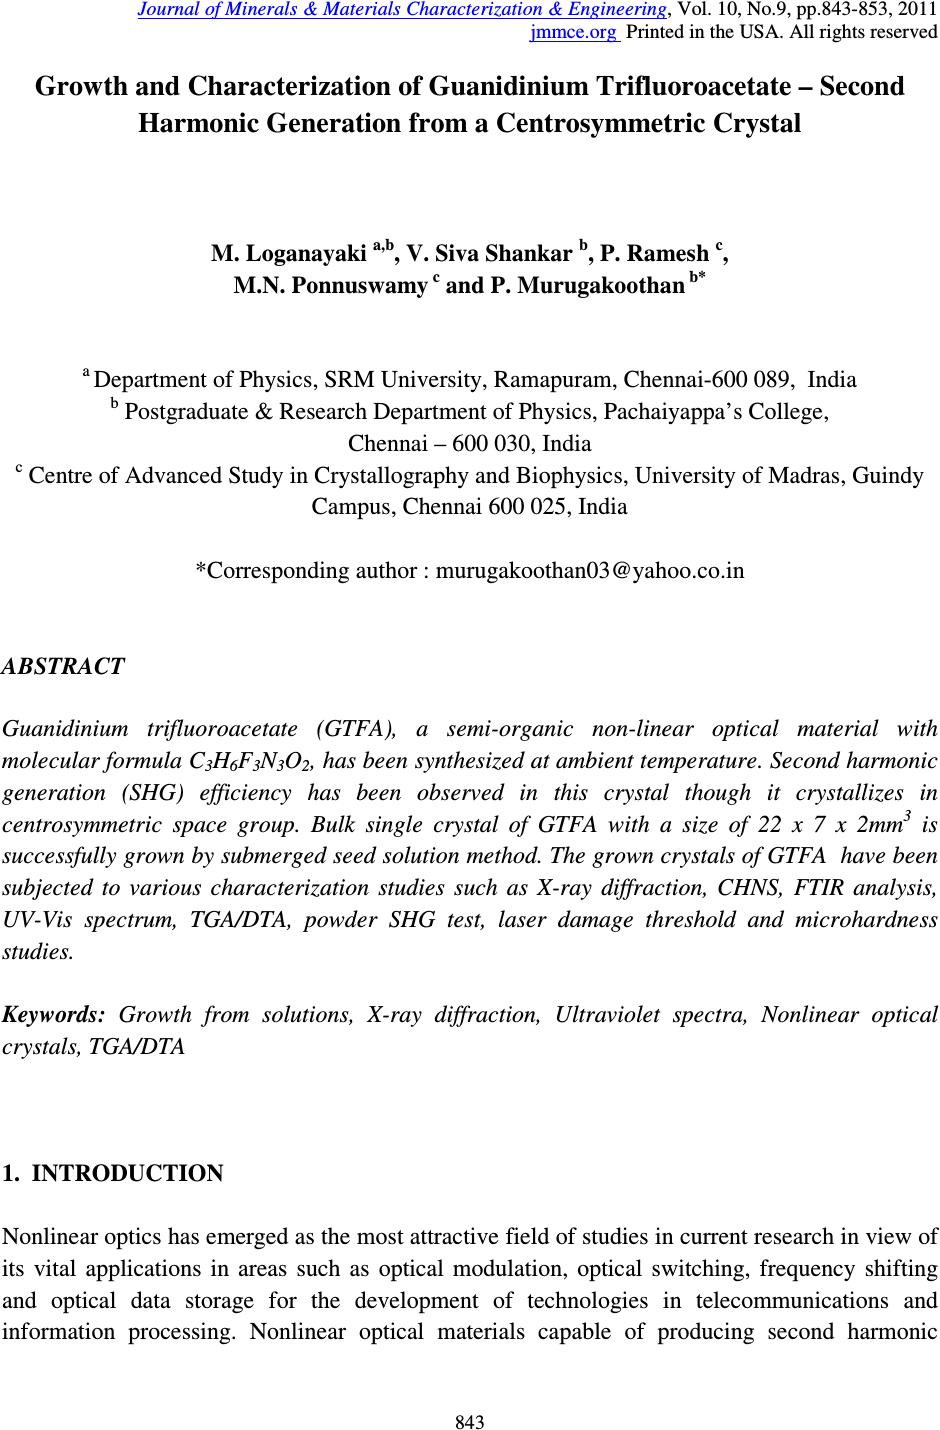 Journal of Minerals & Materials Characterization & Engineering, Vol. 10, No.9, pp.843-853, 2011 jmmce.org Printed in the USA. All rights reserved 843 Growth and Characterization of Guanidinium Trifluoroacetate – Second Harmonic Generation from a Centrosymmetric Crystal M. Loganayaki a,b , V. Siva Shankar b , P. Ramesh c , M.N. Ponnuswamy c and P. Murugakoothan b* a Department of Physics, SRM University, Ramapuram, Chennai-600 089, India b Postgraduate & Research Department of Physics, Pachaiyappa’s College, Chennai – 600 030, India c Centre of Advanced Study in Crystallography and Biophysics, University of Madras, Guindy Campus, Chennai 600 025, India *Corresponding author : murugakoothan03@yahoo.co.in ABSTRACT Guanidinium trifluoroacetate (GTFA), a semi-organic non-linear optical material with molecular formula C 3 H 6 F 3 N 3 O 2 , has been synthesized at ambient temperature. Second harmonic generation (SHG) efficiency has been observed in this crystal though it crystallizes in centrosymmetric space group. Bulk single crystal of GTFA with a size of 22 x 7 x 2mm 3 is successfully grown by submerged seed solution method. The grown crystals of GTFA have been subjected to various characterization studies such as X-ray diffraction, CHNS, FTIR analysis, UV-Vis spectrum, TGA/DTA, powder SHG test, laser damage threshold and microhardness studies. Keywords: Growth from solutions, X-ray diffraction, Ultraviolet spectra, Nonlinear optical crystals, TGA/DTA 1. INTRODUCTION Nonlinear optics has emerged as the most attractive field of studies in current research in view of its vital applications in areas such as optical modulation, optical switching, frequency shifting and optical data storage for the development of technologies in telecommunications and information processing. Nonlinear optical materials capable of producing second harmonic 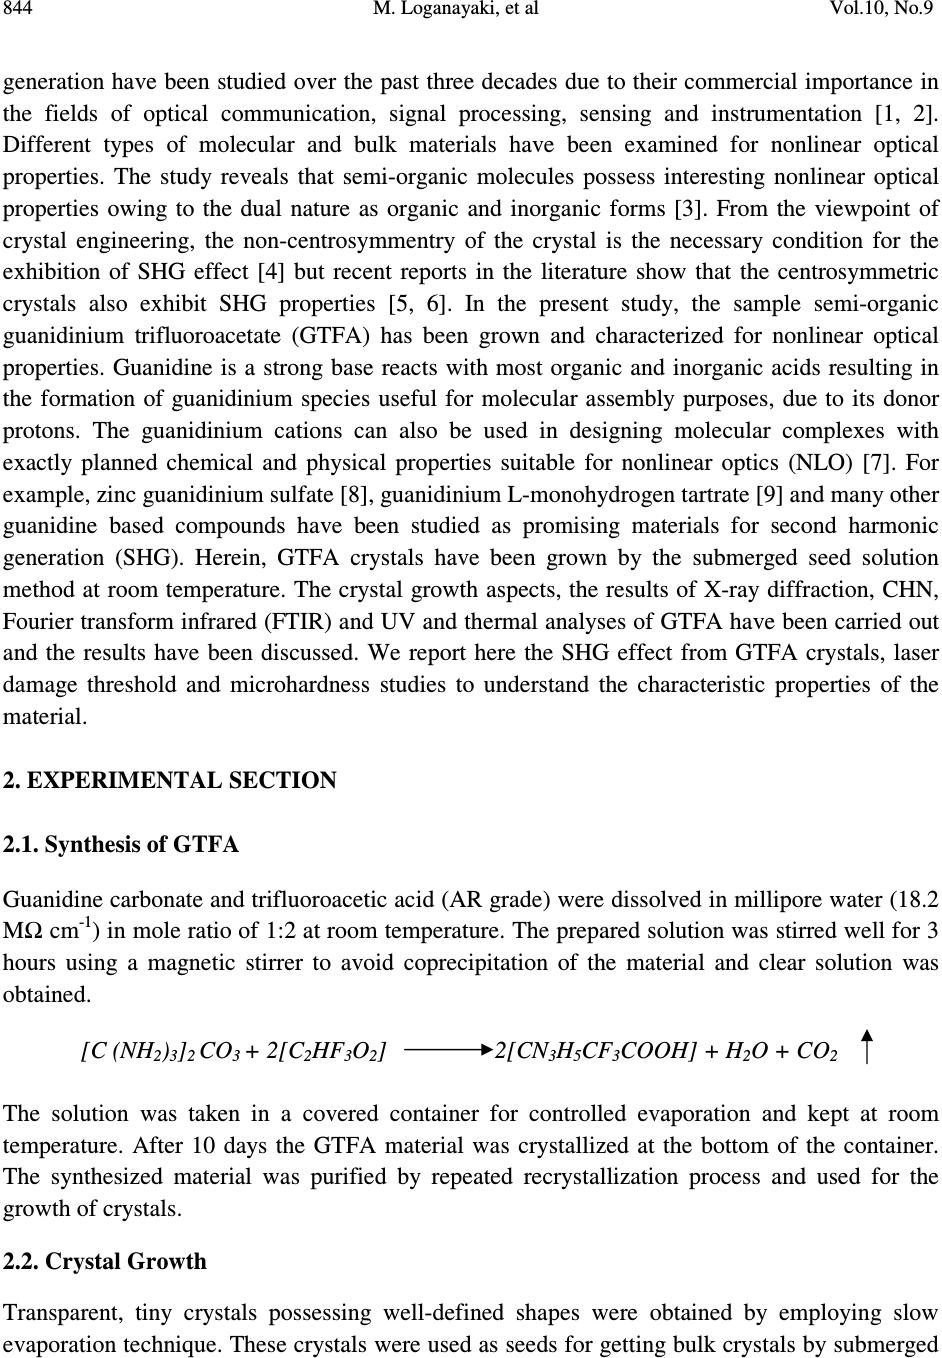 844 M. Loganayaki, et al Vol.10, No.9 generation have been studied over the past three decades due to their commercial importance in the fields of optical communication, signal processing, sensing and instrumentation [1, 2]. Different types of molecular and bulk materials have been examined for nonlinear optical properties. The study reveals that semi-organic molecules possess interesting nonlinear optical properties owing to the dual nature as organic and inorganic forms [3]. From the viewpoint of crystal engineering, the non-centrosymmentry of the crystal is the necessary condition for the exhibition of SHG effect [4] but recent reports in the literature show that the centrosymmetric crystals also exhibit SHG properties [5, 6]. In the present study, the sample semi-organic guanidinium trifluoroacetate (GTFA) has been grown and characterized for nonlinear optical properties. Guanidine is a strong base reacts with most organic and inorganic acids resulting in the formation of guanidinium species useful for molecular assembly purposes, due to its donor protons. The guanidinium cations can also be used in designing molecular complexes with exactly planned chemical and physical properties suitable for nonlinear optics (NLO) [7]. For example, zinc guanidinium sulfate [8], guanidinium L-monohydrogen tartrate [9] and many other guanidine based compounds have been studied as promising materials for second harmonic generation (SHG). Herein, GTFA crystals have been grown by the submerged seed solution method at room temperature. The crystal growth aspects, the results of X-ray diffraction, CHN, Fourier transform infrared (FTIR) and UV and thermal analyses of GTFA have been carried out and the results have been discussed. We report here the SHG effect from GTFA crystals, laser damage threshold and microhardness studies to understand the characteristic properties of the material. 2. EXPERIMENTAL SECTION 2.1. Synthesis of GTFA Guanidine carbonate and trifluoroacetic acid (AR grade) were dissolved in millipore water (18.2 MΩ cm -1 ) in mole ratio of 1:2 at room temperature. The prepared solution was stirred well for 3 hours using a magnetic stirrer to avoid coprecipitation of the material and clear solution was obtained. [C (NH 2 ) 3 ] 2 CO 3 + 2[C 2 HF 3 O 2 ] 2[CN 3 H 5 CF 3 COOH] + H 2 O + CO 2 The solution was taken in a covered container for controlled evaporation and kept at room temperature. After 10 days the GTFA material was crystallized at the bottom of the container. The synthesized material was purified by repeated recrystallization process and used for the growth of crystals. 2.2. Crystal Growth Transparent, tiny crystals possessing well-defined shapes were obtained by employing slow evaporation technique. These crystals were used as seeds for getting bulk crystals by submerged  Vol.10, No.9 Growth and Characterization of Guanidinium Trifluoroacetate 845 seed solution method at room temperature. A saturated solution of 100mL was prepared by dissolving the purified material in millipore water. After filteration, the solution was tightly closed with thick filter paper to control the rate of evaporation. Single crystal of size 22 X 7 X 2 mm 3 was obtained in a period of 30 days and is shown in Fig. 1. Fig. 1. Photograph of GTFA single crystal 2.3. Characterization of GTFA The single-crystal XRD data of the grown GTFA crystal was obtained using ENRAF NONIUS FR 590 single-crystal X-ray diffractometer. X-ray powder pattern of the crystal was recorded on a REICH SEIFERT powder X-ray diffractometer using CuKα (Kα =1.540A˚ ) radiation. The sample was scanned for 2θ range 10–70° at a scan rate of 1°/min. The elemental analysis of the synthesized GTFA was carried out by carbon, hydrogen and nitrogen (CHN) analysis using Elementar Vario EL III-GERMANY analyzer. The functional groups of vibration of GTFA crystal were identified by FTIR technique using a Bruker IFS-66 FTIR spectrometer in the range 4000-400 cm -1 . The UV-Vis-NIR absorption spectrum of the GTFA crystal was examined in the wavelength range 200-2200 nm by a varian Cary 5E model spectrophotometer. Melting point of GTFA crystal was determined using capillary tube method. Thermogravimetric analysis was carried out for the as grown crystals of GTFA using Netzsch STA 409 analyzer in the temperature range 0°C to 300°C in the nitrogen atmosphere at a heating rate of 20°C/min. The NLO property of GTFA crystal was confirmed by Kurtz- powder SHG test using Nd-YAG laser (1064 nm). An actively Q-switched diode array side pumped Nd-YAG laser was used for the laser damage threshold (LDT) studies. The pulse width and the repetition rate of the laser pulses were 10 ns and 10 Hz respectively at 1064 nm radiation. The microhardness studies of single crystal was carried out using a Leitz microhardness tester fitted with a diamond pyramidal indenter attached to an incident light microscope.  846 M. Loganayaki, et al Vol.10, No.9 3. RESULTS AND DISCUSSIONS 3.1. X-ray Diffraction Analysis Fig. 2. Powder X-ray diffraction pattern of GTFA crystal Unit cell parameters of the grown GTFA crystals were obtained using the single crystal diffractometer and are given in Table 1. It is found that GTFA crystallizes in orthorhombic system with centrosymmetric space group Pbcn and V = 1414.1(3) Å 3 . The crystallanity of the grown crystals was checked by taking the X-ray diffraction pattern of powder samples of GTFA. The obtained 2θ values were used for indexing. The indexed powder XRD pattern of the grown crystals is shown in Fig. 2. Table 1 Comparison of unit cell parameters of GTFA with other semi-organic crystals Crystal a (Å) b(Å) c (Å) β (Å) Crystal system Zinc guanidinium sulfate [8] 9.530 9.530 14.358 90 Tetragonal L-arginine TFA [10] 10.580 5.710 10.863 106.81 Monoclinic L-Lysinium TFA [11] 5.698 23.543 8.500 91.63 Monoclinic L-Histidinium TFA [12] 5.172 8.818 12.481 99.85 Triclinic GTFA (present work) 10.563 10.275 13.030 90 Orthorhombic 10 20 30 40 5060 70 0 100 200 300 400 500 (0 0 2) Intensity (cps) 2 θ θ θ θ ( (( ( deg) (11 0)(0 0 2) (2 0 1) (1 2 1) (2 0 2) (1 2 9) (3 6 0) (6 0 1) (0 5 4) (1 1 7) ( 0 5 3)(2 5 0) ( 4 3 2) (2 4 3) (3 3 3) (2 4 1) (4 1 2) (2 20) (2 21) (2 0 3) (2 13) (1 14) (2 3 1) (0 4 0) (4 0 1)  Vol.10, No.9 Growth and Characterization of Guanidinium Trifluoroacetate 847 Fig. 3. ORTEP plot of GTFA molecule showing the thermal ellipsoids at 30% probability level. Crystallographic data of compound in this paper have been deposited with the Cambridge Crystallographic Data centre as supplemental publication no. CCDC – 784254. Copies of the data can be obtained, free of charge on application to CCDC, 12 Union Road, Cambridge CB2 1EZ, UK (fax: +44 01223 336033 or email: deposit@ccdc.cam.ac.uk). The ORTEP plot of GTFA molecule is represented in Fig. 3. 3.2. CHN Analysis The chemical composition of the synthesized GTFA has been determined by carbon, hydrogen and nitrogen (CHN) analysis. The calculated values are C=20.81%, H=3.49%, N=24.29%; observed values are C=21%, H=3.59%, N=24.66%. Both the calculated and observed values are in good agreement with each other. The synthesized compound is quantitatively confirmed. 3.3. Fourier Transform Infrared (FTIR) Analysis Infrared spectra are an important record, which provide more information about the structure of a compound. The FT-IR spectrum of GTFA recorded at room temperature using KBr pellet method is shown in Fig. 4. The absorption peak at 3436 cm -1 is due to the presence of N-H…O stretching vibrations [8]. The absorption peak at 1721 cm -1 establishes the presence of C=O stretching. The peak at 1660 cm -1 is due to the presence of NH 2 in plane bending modes. The band at 1190 cm -1 is assigned due to the presence of C-N-H scissoring. The peaks appeared in the  848 M. Loganayaki, et al Vol.10, No.9 region 1209 cm -1 and 1190 cm -1 are assigned for CF stretching vibrations [10]. The peak appeared in the region 1129 cm -1 is assigned for rocking mode of NH 2 group. The sharp peak at 840 cm -1 is assigned to the presence of COO - rocking. The peak at 804 cm -1 is assigned for C-C stretching. The presence of CN 3 is clearly illustrated by the peak appeared at 725 cm -1 . The presence of wagging mode of C-C=O produces its characteristic peak at 536 cm -1. The spectral analysis reveals the overall molecular structure of the synthesized compound. Fig. 4. FTIR spectrum of GTFA crystal 3.4. UV-Vis –NIR Analysis The optical absorption spectrum for GTFA recorded between 200 nm and 2200 nm is shown in Fig.5. From the graph, it is evident that the GTFA crystal has a low cut off wavelength at 250 nm which is sufficient for SHG laser radiation of 1064 nm or other applications in the blue region. There is no appreciable absorption till 2000 nm from the cut off wavelength. This shows that the crystal has a wide transparency range, which starts in the UV region and extends upto the near- infrared region through the visible region. The large transmittance in the visible region makes this crystal as a good optical window material. From the fundamental absorption at 250 nm, band gap energy of the material is found to be 4.96 eV. The UV cut off wavelength of GTFA is comparable with other guanidine derivatives such as zinc guanidium sulfate (230 nm) [8].  Vol.10, No.9 Growth and Characterization of Guanidinium Trifluoroacetate 849 Fig. 5. The UV-Vis-NIR spectrum of GTFA crystal 3.5. Thermal Analysis Fig. 6. TG/DTA spectrum of GTFA crystal 050100 150 200 250 300 0 20 40 60 80 100 Temperature ( 0 C) Weight (%) 0.6 0.8 1.0 1.2 1.4 1.6 Temperature Difference ( 0 C) TGA DTA  850 M. Loganayaki, et al Vol.10, No.9 Thermal analysis was performed for the grown GTFA crystals to study their thermal stability by TGA and DTA. The sample of 2.260 mg was taken to carry out the thermal analysis. The TGA and DTA thermogram of GTFA is shown in Fig. 6. The DTA curve of GTFA shows an endothermic peak at 71°C which is due to the evaporation of surface adsorbed loosely attached water molecules. The DTA trace indicates a strong and sharp endothermic peak at 159°C due to the melting of the crystal. The melting point of GTFA was also confirmed by capillary tube method. The sharpness of the endothermic peak shows the good degree of crystallanity of the grown sample. The major decomposition occurs between 196°C and 265°C with a weight loss of about 84.75% due to the release of volatile substances in the compound. This weight loss associated with a sharp endothermic peak in DTA trace at 253°C is attributed to the absorption of energy for breaking of bonds during the decomposition of the compound. From these studies, it is concluded that the crystal can retain its texture and the crystal application is restricted upto 159°C which is lesser than other semiorganic materials like zinc guanidinium sulfate (334°C) [8], L-arginine trifluoroacetate (215°C) [10] and L-lysinium trifluoroacetate (210°C) [13]. 3.6. NLO Activity The Kurtz-Perry technique remains an extremely valuable tool for the initial screening of materials for second harmonic generation [14]. The fundamental beam of 1064 nm from a Q- switched Nd-YAG laser was used to test the second harmonic generation (SHG) property of GTFA crystal. The crystalline samples were powdered to particle sizes in the range 125 –150 µm. To make relevant comparisons with known SHG materials, KDP was also ground and sieved into the same particle size range. The powder sample of GTFA was tightly packed in the micro-capillary tubes of uniform diameter (1.5 mm). A pulse energy of 2.4 mJ/pulse, pulse width of 10 ns and a repetition rate of 10 Hz was used. The fundamental beam was filtered using an IR filter and a photomultiplier tube was used as detector. The output power intensity from GTFA is found to be 0.87 times that of KDP. The comparison of conversion efficiency of GTFA crystal with other reported centrosymmetric materials is given in Table 2. Table 2 Comparative SHG efficiencies of different centrosymmetric crystals Compound Space group SHG efficiency in comparison with KDP R,S-Serine [5] P2 1 /a 0.02 (p-Nitrophenol, hexamethylaminetetramine, phosphoric acid and water) super molecular crystal [6] P2 1 /c 3.1 Glycine picrate [15] P2 1 /a 2.34 GTFA [present work] Pbcn 0.87  Vol.10, No.9 Growth and Characterization of Guanidinium Trifluoroacetate 851 3.7. Laser Induced Damage Threshold Studies Laser damage studies on NLO crystals are extremely important as the surface damage of the crystal by high power laser limits its performance in NLO applications. If the material has a low damage threshold, it severely limits its applications, even though it has many excellent properties like high optical transmittance and high SHG efficiency. In this study, a laser beam from Q- switched Nd:YAG laser was focused onto the surface of the grown GTFA crystal by a lens with 20.5 cm focal length. The distance between crystal and lens was 18.4 cm. The beam spot size on the sample was 0.51 mm. The laser damage threshold value of GTFA is found to be 3.9 GW/cm 2 . This threshold value of GTFA crystal is compared with that of guanidine derivative compound zinc guanidinium sulfate and other technologically important optical crystals such as KDP and urea. These results are presented in Table 3. Due to high laser damage threshold value of GTFA, it is concluded that GTFA can be used for high-power applications. Table 3 Comparison of laser damage threshold of GTFA with other crystals Compound Laser damage threshold (GW/cm 2 ) KDP [16] 0.2 Urea [16] 1.5 Zinc guanidinium sulfate [8] 1.38 GTFA (present work) 3.9 3.8. Microhardness Studies The microhardness testing of single crystal was carried out to understand the mechanical properties of materials such as fracture behavior, yield strength, brittleness index and temperature of cracking [17,18]. Microhardness studies have been carried out on GTFA single crystal of dimension 8 x 6 x 2 mm 3 . The static indentations have been made for different loads from 5 to 80 g with a constant indentation time of 10s. Vickers microhardness values have been calculated using H v = 1.8544 P/d 2 kg/mm 2 where P is the applied load in kg and d is the mean diagonal length of the indenter impression in mm. The variation of Vickers hardness number (H v) with applied load (P) of the GTFA crystal is shown in Fig. 7. It is seen that H v value of the grown crystal increases with the increase in load. For an indentation load of 80 g, cracks are initiated on the crystal surface, around the indentation. This is due to the release of internal stress locally initiated by indentation [19]. Vickers hardness measurement shows that the GTFA crystal has a hardness value of 59 kg/mm 2 at 60g which is less than Zinc guanidinium sulfate (118 kg/mm 2 at 60 g) [8]. 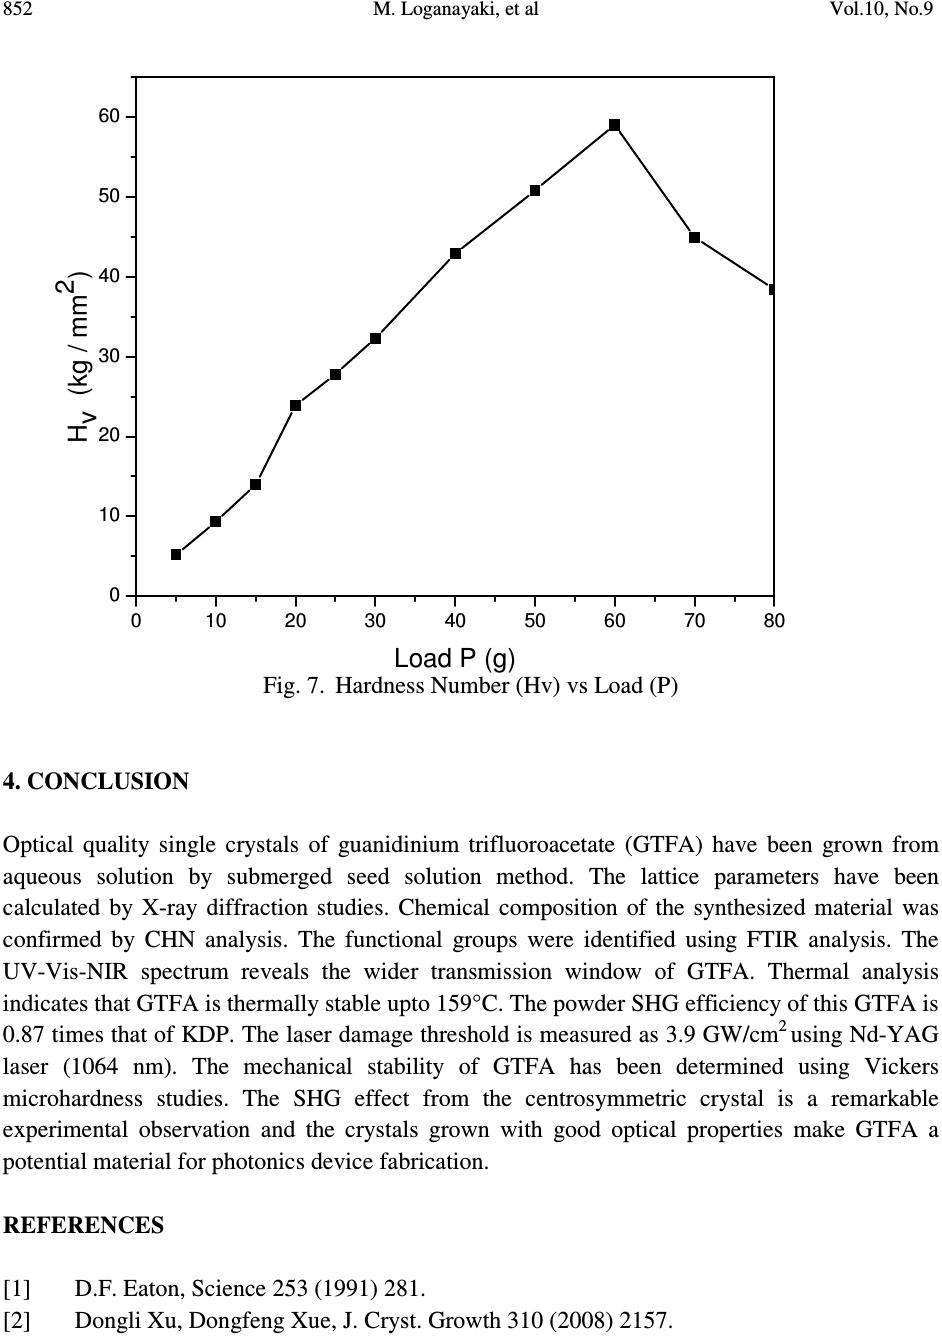 852 M. Loganayaki, et al Vol.10, No.9 Fig. 7. Hardness Number (Hv) vs Load (P) 4. CONCLUSION Optical quality single crystals of guanidinium trifluoroacetate (GTFA) have been grown from aqueous solution by submerged seed solution method. The lattice parameters have been calculated by X-ray diffraction studies. Chemical composition of the synthesized material was confirmed by CHN analysis. The functional groups were identified using FTIR analysis. The UV-Vis-NIR spectrum reveals the wider transmission window of GTFA. Thermal analysis indicates that GTFA is thermally stable upto 159°C. The powder SHG efficiency of this GTFA is 0.87 times that of KDP. The laser damage threshold is measured as 3.9 GW/cm 2 using Nd-YAG laser (1064 nm). The mechanical stability of GTFA has been determined using Vickers microhardness studies. The SHG effect from the centrosymmetric crystal is a remarkable experimental observation and the crystals grown with good optical properties make GTFA a potential material for photonics device fabrication. REFERENCES [1] D.F. Eaton, Science 253 (1991) 281. [2] Dongli Xu, Dongfeng Xue, J. Cryst. Growth 310 (2008) 2157. 010 20 30 40 50 60 70 80 0 10 20 30 40 50 60 Hv (kg / mm2) Load P (g)  Vol.10, No.9 Growth and Characterization of Guanidinium Trifluoroacetate 853 [3] S. Debrusa, H. Rataczak, J. Venturini, N. Pincon, J. Baran, J. Barycki, T. Glowiak, A. Pietraszko, Synth.Met.127 (2002) 99 [4] A.M. Petrosoyan, R.P. Sukiyasan, H.A. Karpetyan, S.S. Tenzya, R.S. Feigelson, J. Cryst. Growth 213 (2000) 103. [5] K.E. Reickhoff, W.L. Peticolas, Science 147 (1965) 610 [6) Guo Wensheng, Guo Fang, Wei Chunsheng, Liu Qitao, Zhou Guangyong, Wang Dong, Shao Zhongshu, Sci.China Ser.B; Chem.45 (2002) 276 [7] M. Drozd, Mat. Sci. and Engineering B, 1 (2007) 20 [8] V. Siva shankar, R. Siddheswaran, T. Bharthasarathi, P. Murugakoothan, J. Cryst. Growth, 9 (2009) 2709. [9] J.Zyss, J. Pecaut, J. P. Levy and R. Masse, Acta cryst, B49 (1993) 334. [10] Z. H. Sun, D. Xu, X. Q. Wang, X. J. Liu, G. Yu, G. H. Zhang, L.Y. Zhu, and H. L. Fan, Cryst. Res. Technol. 42 (2007) 812. [11] Zhi Hua Sun, Jian Dong Fan, Guang Hui Zhang, Xin Qiang Wang and Dong Xu, Acta Cryst. E64 (2008) o393. [12] S. Gokul Raj, G. R. Kumar, R. Mohan and R. Jayavel, Acta Cryst. E62 (2006) o5. [13] V. Mathivanan, T. Raghavalu, M. Kovendhan, K. Suriya Kumar, S. Gokul Raj, G. Ramesh Kumar, R. Mohan, Cryst. Res. Technol, 43 (2008) 248. [14] K.Kurtz, T.T.Perry, J.Appl.Phys, 39 (1968) 3798 [15] S.K.Mohd. Shakir, K.K.Kushwaha, Maurya, Manju Arora, G.Bhagavannarayana, J. Cryst. Growth 311 (2009) 3871 [16] Martin Britto Dhas, S.A.; Natrajan, S. Cryst.Res.Technol. 42 (2007) 471 [17] B.R. Lawn, E.R. Fuller, J. Mater. Sci. 9 (1975) 2016. [18] J.H. Westbrook, H. Report 58-RL-2033 of the G.E. Research Laboratory, USA, 1958 [19] T.Balakrishnan, K.Ramamurthi, Spectrochim. Acta A 68 (2007) 360 |