Paper Menu >>
Journal Menu >>
 Journal of Minerals & Materials Characterization & Engineering, Vol. 10, No.9, pp.805-815, 2011 jmmce.org Printed in the USA. All rights reserved 805 Growth, Thermal, Mechanical and Dielectric Studies of Glycine Doped Potassium Acid Phthalate Single Crystals T. Baraniraj a and P. Philominathan b, * a Department of Physics, Roever college of Engineering & Technology, Perambalur 621 212, India b Department of Physics, A.V.V.M Sri Pushpam College (Autonomous), Poondi, Thanjavur- 613 503, India *Corresponding Author: philominathan@gmail.com ABSTRACT Single crystals of glycine doped potassium acid phthalate (KAP) have been grown from low temperature solution growth method by employing slow evaporation of the solvent at room temperature. The grown crystal was subjected to various studies such as X-ray diffraction (XRD), Fourier Transform Infrared (FTIR), UV-visible and Second Harmonic Generation (SHG) studies. The thermal stability, mechanical strength and dielectric constant were also measured. The various studies revealed the influence of the glycine on KAP and the investigations indicated that glycine played an important role in the changes of the spectral, optical and mechanical properties of KAP crystals. Keywords: nonlinear optics; growth from solution; X-ray diffraction; dielectric constant 1. INTRODUCTION Second order nonlinear optical (SONLO) materials have recently attracted much attention because of their potential applications in emerging optoelectronic technologies [1,2]. It has been reported that organic crystals have very large nonlinear susceptibility compared with inorganic crystals, but their use is impeded by low optical transparency, poor mechanical strength, low laser damage threshold and inability to produce and process large crystals [3,4]. The inorganic NLO materials have excellent mechanical and thermal properties with optical nonlinearities because of the lack of extended π-electron delocalization. The semiorganic NLO materials 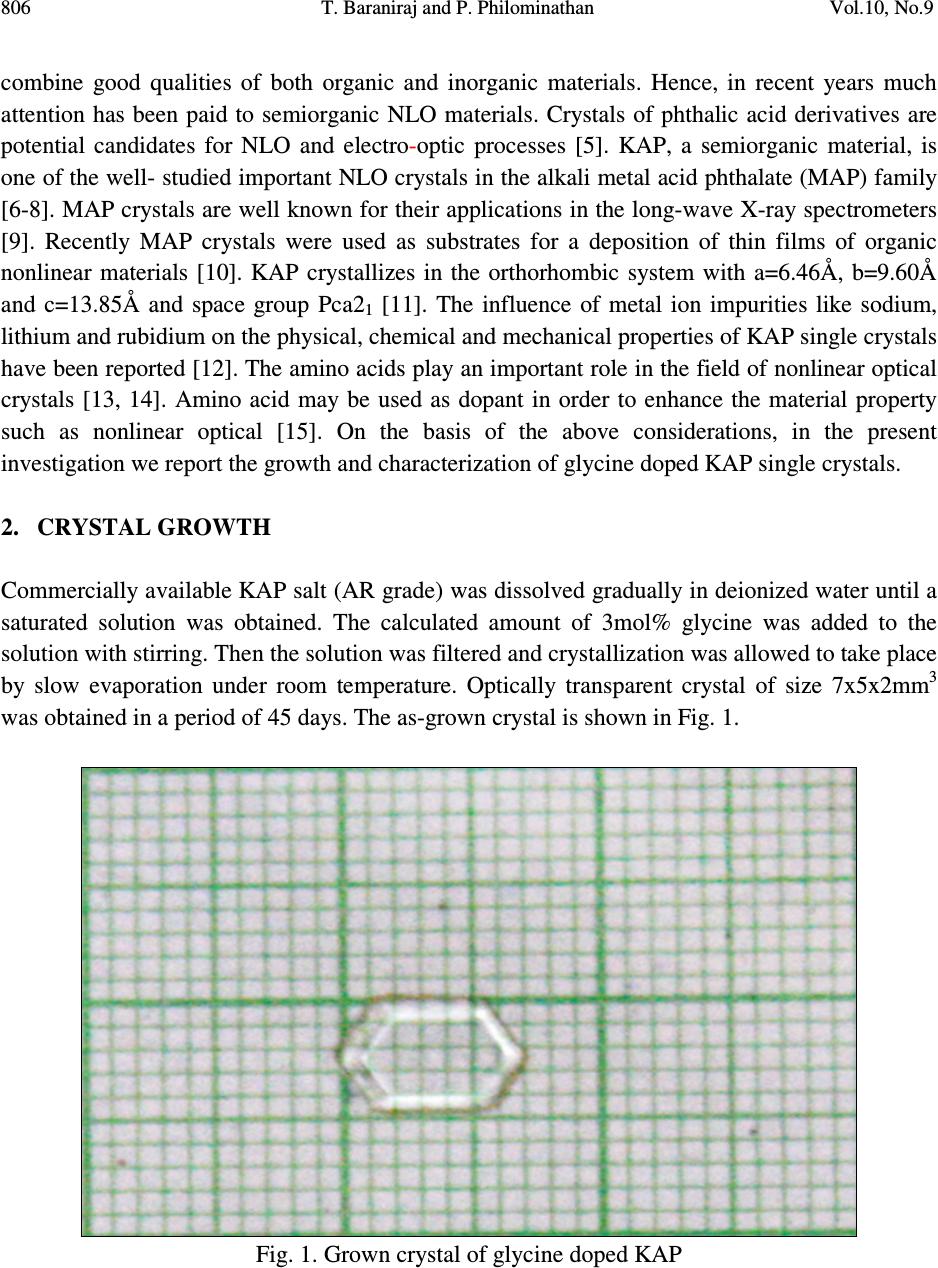 806 T. Baraniraj and P. Philominathan Vol.10, No.9 combine good qualities of both organic and inorganic materials. Hence, in recent years much attention has been paid to semiorganic NLO materials. Crystals of phthalic acid derivatives are potential candidates for NLO and electro-optic processes [5]. KAP, a semiorganic material, is one of the well- studied important NLO crystals in the alkali metal acid phthalate (MAP) family [6-8]. MAP crystals are well known for their applications in the long-wave X-ray spectrometers [9]. Recently MAP crystals were used as substrates for a deposition of thin films of organic nonlinear materials [10]. KAP crystallizes in the orthorhombic system with a=6.46Å, b=9.60Å and c=13.85Å and space group Pca2 1 [11]. The influence of metal ion impurities like sodium, lithium and rubidium on the physical, chemical and mechanical properties of KAP single crystals have been reported [12]. The amino acids play an important role in the field of nonlinear optical crystals [13, 14]. Amino acid may be used as dopant in order to enhance the material property such as nonlinear optical [15]. On the basis of the above considerations, in the present investigation we report the growth and characterization of glycine doped KAP single crystals. 2. CRYSTAL GROWTH Commercially available KAP salt (AR grade) was dissolved gradually in deionized water until a saturated solution was obtained. The calculated amount of 3mol% glycine was added to the solution with stirring. Then the solution was filtered and crystallization was allowed to take place by slow evaporation under room temperature. Optically transparent crystal of size 7x5x2mm 3 was obtained in a period of 45 days. The as-grown crystal is shown in Fig. 1. Fig. 1. Grown crystal of glycine doped KAP 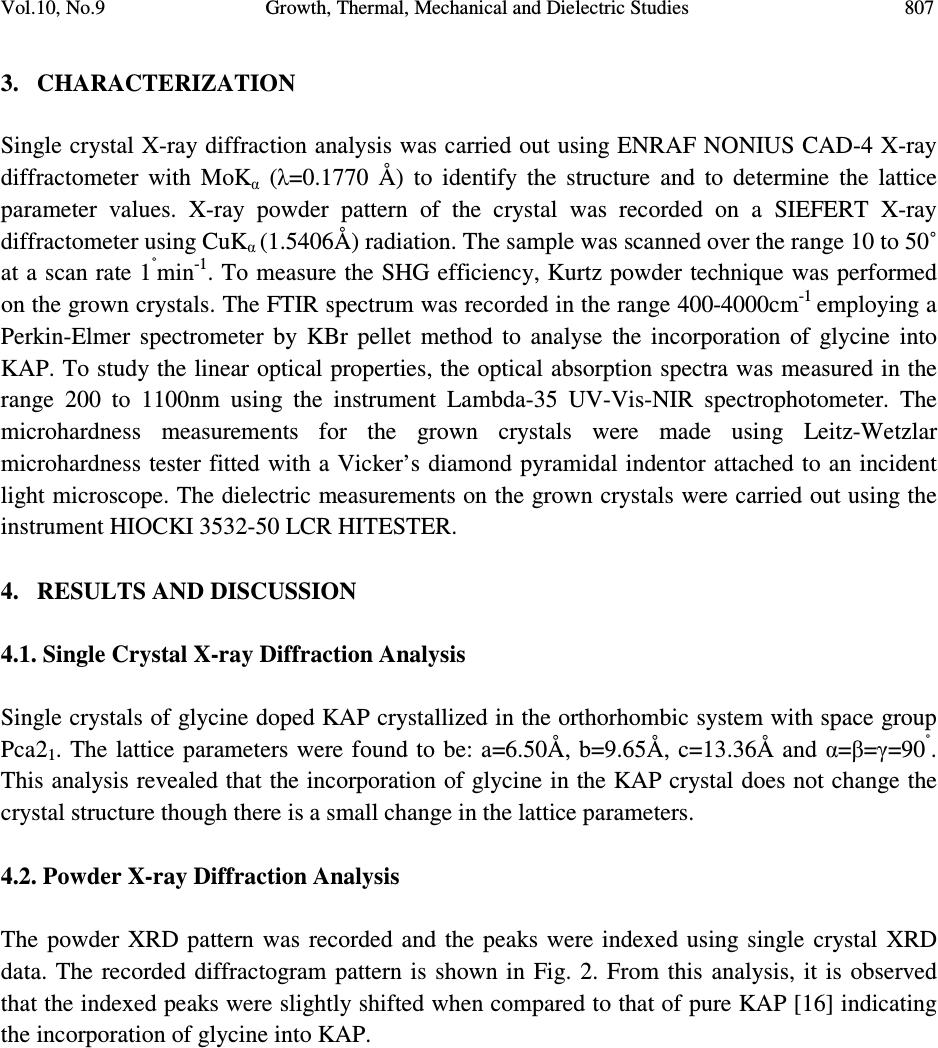 Vol.10, No.9 Growth, Thermal, Mechanical and Dielectric Studies 807 3. CHARACTERIZATION Single crystal X-ray diffraction analysis was carried out using ENRAF NONIUS CAD-4 X-ray diffractometer with MoK α (λ=0.1770 Å) to identify the structure and to determine the lattice parameter values. X-ray powder pattern of the crystal was recorded on a SIEFERT X-ray diffractometer using CuK α (1.5406Å) radiation. The sample was scanned over the range 10 to 50˚ at a scan rate 1 ˚ min -1 . To measure the SHG efficiency, Kurtz powder technique was performed on the grown crystals. The FTIR spectrum was recorded in the range 400-4000cm -1 employing a Perkin-Elmer spectrometer by KBr pellet method to analyse the incorporation of glycine into KAP. To study the linear optical properties, the optical absorption spectra was measured in the range 200 to 1100nm using the instrument Lambda-35 UV-Vis-NIR spectrophotometer. The microhardness measurements for the grown crystals were made using Leitz-Wetzlar microhardness tester fitted with a Vicker’s diamond pyramidal indentor attached to an incident light microscope. The dielectric measurements on the grown crystals were carried out using the instrument HIOCKI 3532-50 LCR HITESTER. 4. RESULTS AND DISCUSSION 4.1. Single Crystal X-ray Diffraction Analysis Single crystals of glycine doped KAP crystallized in the orthorhombic system with space group Pca2 1 . The lattice parameters were found to be: a=6.50Å, b=9.65Å, c=13.36Å and α=β=γ=90 ˚ . This analysis revealed that the incorporation of glycine in the KAP crystal does not change the crystal structure though there is a small change in the lattice parameters. 4.2. Powder X-ray Diffraction Analysis The powder XRD pattern was recorded and the peaks were indexed using single crystal XRD data. The recorded diffractogram pattern is shown in Fig. 2. From this analysis, it is observed that the indexed peaks were slightly shifted when compared to that of pure KAP [16] indicating the incorporation of glycine into KAP. 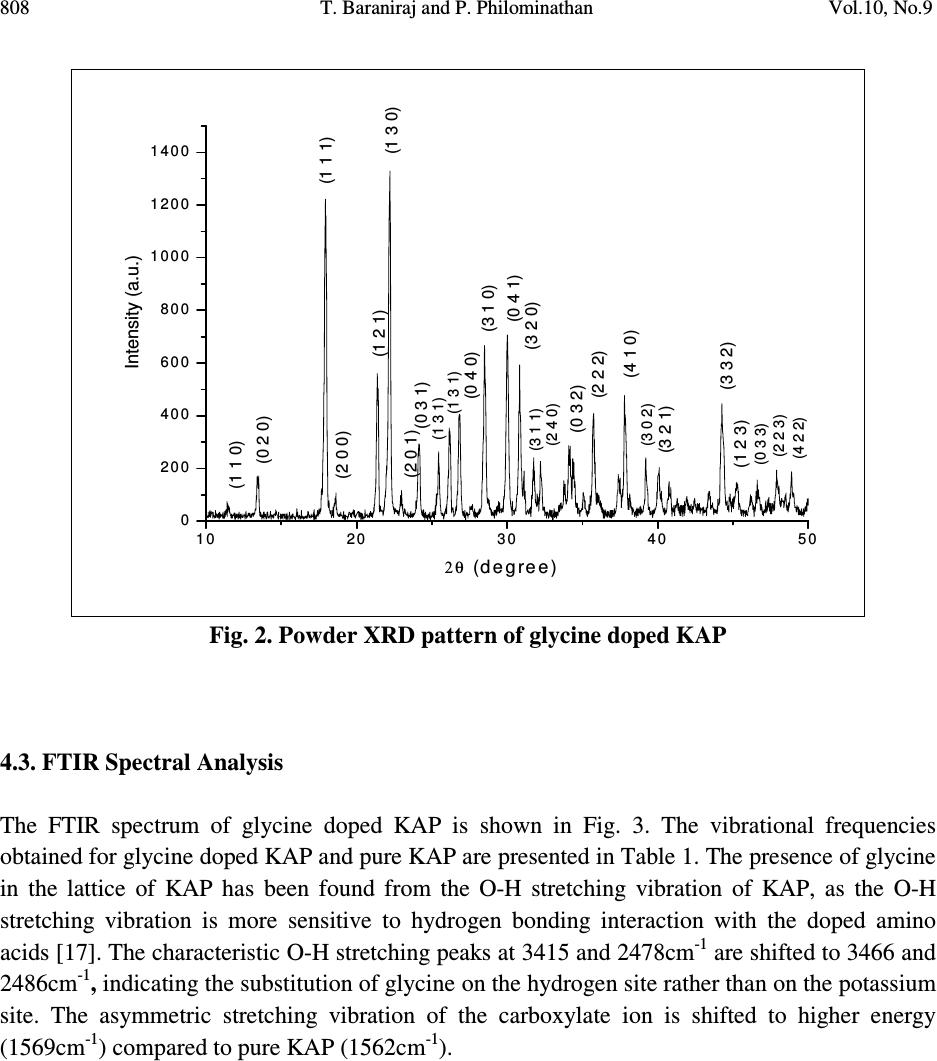 808 T. Baraniraj and P. Philominathan Vol.10, No.9 10 20 3040 50 0 2 0 0 4 0 0 6 0 0 8 0 0 1 0 0 0 1 2 0 0 1 4 0 0 (1 3 1) Intensity (a.u.) 2θ (d e g re e ) (1 1 0) (0 2 0) (1 1 1) (2 0 0) (1 2 1)(1 3 0) (2 0 1)(0 3 1) (1 3 1) (0 4 0) (3 1 0) (0 4 1) (3 2 0) (3 1 1) (2 4 0) (0 3 2) (2 2 2) (4 1 0) (3 0 2) (3 2 1) (3 3 2) (1 2 3) (0 3 3) (2 2 3) (4 2 2) Fig. 2. Powder XRD pattern of glycine doped KAP 4.3. FTIR Spectral Analysis The FTIR spectrum of glycine doped KAP is shown in Fig. 3. The vibrational frequencies obtained for glycine doped KAP and pure KAP are presented in Table 1. The presence of glycine in the lattice of KAP has been found from the O-H stretching vibration of KAP, as the O-H stretching vibration is more sensitive to hydrogen bonding interaction with the doped amino acids [17]. The characteristic O-H stretching peaks at 3415 and 2478cm -1 are shifted to 3466 and 2486cm -1 , indicating the substitution of glycine on the hydrogen site rather than on the potassium site. The asymmetric stretching vibration of the carboxylate ion is shifted to higher energy (1569cm -1 ) compared to pure KAP (1562cm -1 ).  Vol.10, No.9 Growth, Thermal, Mechanical and Dielectric Studies 809 Fig. 3. FTIR spectrum of glycine doped KAP Table 1. Vibrational frequency assignments for pure and glycine doped KAP Pure KAP[12] glycine doped KAP Assignments cm -1 cm -1 [present work] 3415 3466 O-H stretching hydrogen bond 1544 1569 -C=O carboxylate ion=O asymmetric stretching 1382 1379 -C=O carboxylate ion=O symmetric stretching 1288 1278 C-O stretching 1087 1091 C-C-O stretching 852 849 C-H out of plane bending 767 764 C-C stretching 684 685 C-O wagging 550 552 C=C-C out of plane ring deformation 450 441 C= plane bending  810 T. Baraniraj and P. Philominathan Vol.10, No.9 4.4. Thermal Analyses The TGA/DTA analyses of glycine doped KAP single crystal were carried out between 50 and 1200˚C at a heating rate of 20k/min in nitrogen atmosphere and are shown in Fig. 4. The TGA curve shows a sharp weight loss at 290˚C without any intermediate stages, which is assigned as melting point of the crystal. There is no weight loss below 290˚C, illustrating the absence of absorbed water in the crystal. It is reported that the melting point of the pure KAP is 290˚C [18]. Hence, we can conclude that there is no change in the melting point of the KAP due to the addition of glycine. From the DTA trace, the endothermic peak observed at 317˚C may be attributed to decomposition of glycine doped KAP. These analyses indicate that the compound could be used for the fabrication of any optical devices below its melting point. 200 400 600 80010001200 Temperature /°C 0 2 4 6 8 10 12 14 DTA /(mW/mg) 40 50 60 70 80 90 100 TG /% [1] BASEL610.dsv TG DTA Mass Change: -40.61 % Mass Change: -17.38 % Mass Change: -7.81 % Peak: 866.1 °C, 15.24 mW/mgPeak: 920.8 °C, 15.06 mW/mg Peak: 1021.9 °C, 7.985 mW/mg Peak: 603.1 °C, 8.542 mW/mg Peak: 317.0 °C, -0.7845 mW/mg [1] [1] ↑ exo Fig. 4. TGA/DTA trace of glycine doped KAP 4.5. Linear Optical Assessment UV-visible spectral study is a useful tool to determine the transparency, which is an important requirement for a material to be optically active [19]. Glycine doped KAP crystal of thickness 2mm was employed for this study. The recorded spectrum (Fig. 5) shows that the crystals have very low absorbance in the entire visible and IR region. The UV cut-off wavelength for glycine  Vol.10, No.9 Growth, Thermal, Mechanical and Dielectric Studies 811 doped KAP is at 300nm. This results in high percentage of transmission, which is one of the most desired properties for the crystals used for the device fabrication. Fig. 5. UV-vis. absorption spectrum of glycine doped KAP 4.6. Second Harmonic Generation Efficiency Measurement The Kurtz and Perry powder technique remains an extremely valuable tool for initial screening of materials for second harmonic generation. The fundamental beam of wavelength 1064nm from Q-switched Nd: YAG laser (Pro lab 170 Quanta ray) was used to test SHG property of the pure and glycine doped KAP. Pulse energy of 4 mJ/pulse, pulse width of 10 ns and repetition rate of 10 Hz was used in both measurements. The fundamental beam was filtered using an IR filter and photomultiplier tube (Philips photonics) was used as the detector. KDP was used as the reference material and the output power intensity of pure and glycine doped KAP were observed. A second harmonic signal of 35mV and 40mV were obtained from pure and glycine doped KAP respectively, with reference to 62mV of KDP. Thus, the SHG efficiency of pure and glycine doped KAP is roughly 0.6 times that of KDP. 4.7. Dielectric Study Dielectric measurement is one of the useful methods for characterization of electrical response in crystalline and ceramic materials. A study of the dielectric properties provides information about electric fields within the solid materials. Frequency dependence of these properties gives great  812 T. Baraniraj and P. Philominathan Vol.10, No.9 insight into the materials applications. Single crystals of glycine doped KAP cut in the rectangular specimen of thickness 1.2mm and area of cross section 6mm 2 is subjected to dielectric studies. Silver paste is coated on both the surfaces of the sample to make contact between the crystal and the copper electrodes. The capacitance (C) and dissipation factor (D) of the parallel plate capacitors formed by the copper plate and electrode having the sample as dielectric medium have been measured. The dielectric constant (ε) and dielectric loss (tanδ) were calculated using the relations, ε = Cd/Aε 0 and tanδ = Dε, Where d is the thickness of the sample, A is the area of the sample and ε 0 is the permittivity of free space. The variation of dielectric constant and dielectric loss with frequency at room temperature are shown in Fig. 6 and 7 respectively. The dielectric constants have high values in the lower frequency region and then it decreases with the applied frequency. The high value of ε at lower frequencies may be due to the presence of all the four polarizations namely, space charge, orientational, electronic and ionic polarization and its low value at higher frequencies may be due to the loss of significance of these polarizations gradually. The low value of dielectric loss at high frequency suggests that the glycine doped KAP crystals possesses enhanced optical quality with lesser defects and this parameter is of vital importance for nonlinear optical materials in their applications. 1234567 0 1 2 3 4 Dielectric constant ( ε ) Log freque ncy Fig. 6. Variation of dielectric constant with frequency  Vol.10, No.9 Growth, Thermal, Mechanical and Dielectric Studies 813 1 2 3 45 6 7 0 .0 0 .2 0 .4 0 .6 0 .8 1 .0 Dielctric loss (tan δ ) Log frequency Fig. 7. Variation of dielectric loss with frequency 4.8. Microhardness Studies The Vicker’s microhardness measurement was carried out on the grown crystals to assess the mechanical property. The static indentations were made at room temperature with a constant indentation time of 10s for all indentations. The indentation marks were made on the surfaces by varying the load from 10 to 100g. The Vicker’s microhardness number Hv of the pure and glycine doped KAP were calculated using the relation Hv=1.8544P/d 2 Kgmm -2 . Where P is the applied load in Kg and d is the average diagonal length of the indentation in mm. A graph plotted between hardness number (Hv) and applied load (P) is shown in Fig. 8. At lower load, there is an increase in hardness with load, for both the crystals, which can be attributed to the work hardening of the surface layer. Beyond 100g, significant cracking occurs, which may be due to release of internal stress generated with indentation. The work hardening coefficient of pure and glycine doped KAP is found to be 1.76 and 1.66 respectively. According to Onitsch, 1.0 ≤ n ≤ 1.6 for hard material and n > 1.65 for soft materials. Hence, it is concluded that pure and glycine doped KAP belongs to soft materials. 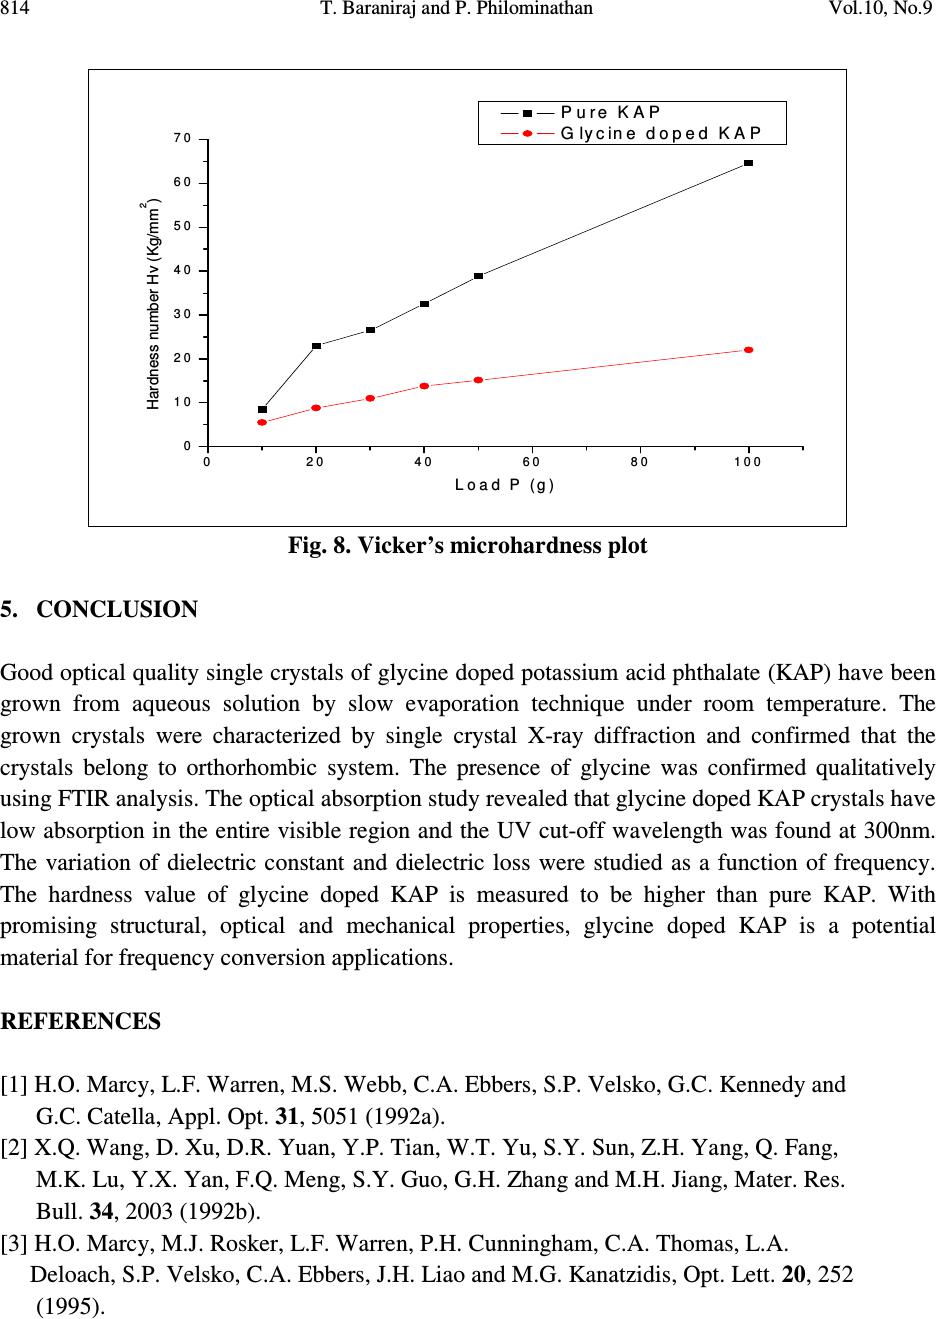 814 T. Baraniraj and P. Philominathan Vol.10, No.9 02 04 06 08 01 0 0 0 1 0 2 0 3 0 4 0 5 0 6 0 7 0 Hardness number Hv (Kg/mm 2 ) L oa d P (g ) P ure K A P Glycine d oped K A P Fig. 8. Vicker’s microhardness plot 5. CONCLUSION Good optical quality single crystals of glycine doped potassium acid phthalate (KAP) have been grown from aqueous solution by slow evaporation technique under room temperature. The grown crystals were characterized by single crystal X-ray diffraction and confirmed that the crystals belong to orthorhombic system. The presence of glycine was confirmed qualitatively using FTIR analysis. The optical absorption study revealed that glycine doped KAP crystals have low absorption in the entire visible region and the UV cut-off wavelength was found at 300nm. The variation of dielectric constant and dielectric loss were studied as a function of frequency. The hardness value of glycine doped KAP is measured to be higher than pure KAP. With promising structural, optical and mechanical properties, glycine doped KAP is a potential material for frequency conversion applications. REFERENCES [1] H.O. Marcy, L.F. Warren, M.S. Webb, C.A. Ebbers, S.P. Velsko, G.C. Kennedy and G.C. Catella, Appl. Opt. 31, 5051 (1992a). [2] X.Q. Wang, D. Xu, D.R. Yuan, Y.P. Tian, W.T. Yu, S.Y. Sun, Z.H. Yang, Q. Fang, M.K. Lu, Y.X. Yan, F.Q. Meng, S.Y. Guo, G.H. Zhang and M.H. Jiang, Mater. Res. Bull. 34, 2003 (1992b). [3] H.O. Marcy, M.J. Rosker, L.F. Warren, P.H. Cunningham, C.A. Thomas, L.A. Deloach, S.P. Velsko, C.A. Ebbers, J.H. Liao and M.G. Kanatzidis, Opt. Lett. 20, 252 (1995).  Vol.10, No.9 Growth, Thermal, Mechanical and Dielectric Studies 815 [4] R. Mohan Kumar, D. Rajan Babu, G. Ravi and R. Jayavel, J. Cryst. Growth 250 113 (2003). [5] R. Bairava Ganesh, V. Kannan, K. Meera, N.P. Rajesh and P. Ramasamy, J. Cryst. Growth 282, 429 (2005a). [6] A.V. Alex and J. Philip, J. Appl. Phys. 88, 2349 (2000). [7] M.H.J. Hottenhuis, J.G.E. Gardenhers, L.A.M.J. Jetten and P. Bennema, J. Cryst. Growth 92, 171 (1988). [8] N. Kejalekshmy and K. Srinivasan, Opt. Mater. 27, 389 (2004). [9] M.L. Barsukova, G.S. Belikova, L.M. Belyaev, V.A. Boyko, A.B. Gil’varg, S.A. Pikuz, A. Ya. Jayenov and A. Yu. Chugunov, Instr. Exp. Techniq. 23, No.4. Part 2, 1028 (1980). [10] M. Nisoli, V. Pruneri, V. Mangi, S. DeSilvestri, G. Dellepiane, D. Comoretto, C. Cuniberti and J. LeMoigne, Appl. Phys. Lett. 65, 590 (1994). [11] Y. Okaya, Acta Crystallogr. 19, 879 (1965). [12] S.K. Geetha, R. Perumal, S. Moorthy Babu and P.M. Anbarasan, Cryst. Res. Technol. 41, 221 (2006a). [13] K. Ambujam, K. Rajarajan, S. Selvakumar, I. Vetha Pothekar, Ginson A. Joseph and P. Sagayaraj, J. Cryst. Growth 286, 440 (2006b). [14] R. Mohan Kumar, D. Rajan Babu, D. Jayaraman, R. Jayavel and K.Kitmura, J. Cryst. Growth 275, 1935 (2005b). [15] N.R. Dhumane, S.S. Hussaini, V.G. Dongre and Mahendra D. Shirsat, Opt. Mater. 31, 328 (2008a). [16] Monica Enculescu, Opt. Mater. 32, 281 (2009) [17] K. Uthayarani, R. Sankar and C.K. Shashidharan Nair, Cryst. Res. Technol. 43, 733 (2008b). [18] M. Senthil Pandian, N. Balamurugan, G. Bhagavannarayana and P. Ramasamy, J. Cryst. Growth 310, 4143 (2008c). [19] C.N.R. Rao, Ultraviolet and visible spectroscopy, chemical applications, Plenum Press, 1975. |