Paper Menu >>
Journal Menu >>
 Journal of Minerals & Materials Characterization & Engineering, Vol. 10, No.8, pp.755-7 64, 2011 jmmce.org Printed in the USA. All rights reserved 755 Tempering Heat Treatment Effects on Steel Welds A.V. Adedayo1,3, S.A. Ibitoye1 and O.O. Oluwole2 1 Materials Science and Engineering Department, Obafemi Awolowo University, Ile-Ife, Nigeria 2Mechanical Engineering Department, University of Ibadan, Ibadan, Nigeria 3 Metallurgical Engineering Department, Kwara State P olytechnic, PMB 1375, Ilorin, Nigeria *Corresponding author: adelekeadedayo58@yahoo.com ABSTRACT This paper reports investigations made on the tempering heat treatment effects on steel welds. The properties of the weld investigated were hardness value and toughness. Micro examination of the samples was also done with optical microscopy. Four (4) different grades of steel rods in 10mm diameter were obtained. The range of the carbon contents of the steel rods was from 0.16 wt% C to 0.33 wt % C. From each grade of the steel materials, grooved specimen of about 150 mm were prepared. The grooves were then filled to create welds using arc welding. A set of the resulting welds were then subjected to tempering heat treatment. The hardness values and toughness of the welds were determined. The microstructural analyses of the welds were carried out as well. The results show that hardness and toughness were dependent on the carbon content. There was also significant microstructural modification due to heat treatment. Keywords: Welding, Tempering, Heat treatment, Hardness, Toughness, Microstructure 1. INTRODUCTION Normally, during the arc welding process, the peak temperature varies from near the melting point to the lower critical temperature. The duration of the cycle is very short relative to normal soaking times in heat treating cycles. At high peak temperatures near the fusion line, diffusion is more rapid and the solute atoms, especially carbon, disperse uniformly in the austenite [1]. Also, austenite grain growth occurs. At lower peak temperatures, slightly above the austenite 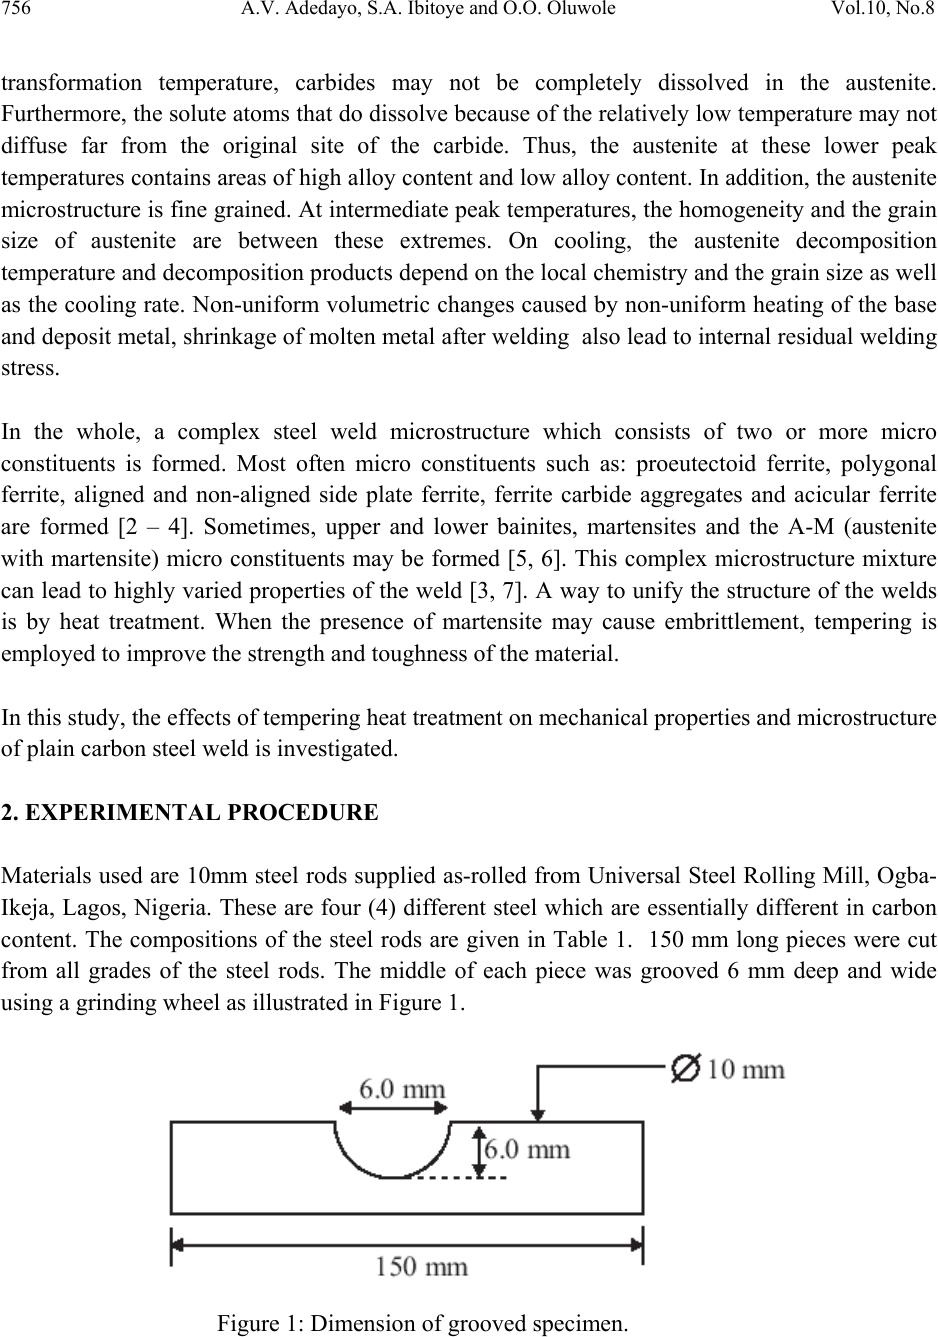 756 A.V. Adedayo, S.A. Ibitoye and O.O. Oluwole Vol.10, No.8 transformation temperature, carbides may not be completely dissolved in the austenite. Furthermore, the solute atoms that do dissolve because of the relatively low temperature may not diffuse far from the original site of the carbide. Thus, the austenite at these lower peak temperatures contains areas of high alloy content and low alloy content. In addition, the austenite microstructure is fine grained. At intermediate peak temperatures, the homogeneity and the grain size of austenite are between these extremes. On cooling, the austenite decomposition temperature and decomposition products depend on the local chemistry and the grain size as well as the cooling rate. Non-uniform volumetric changes caused by non-uniform heating of the base and deposit metal, shrinkage of molten metal after welding also lead to internal residual welding stress. In the whole, a complex steel weld microstructure which consists of two or more micro constituents is formed. Most often micro constituents such as: proeutectoid ferrite, polygonal ferrite, aligned and non-aligned side plate ferrite, ferrite carbide aggregates and acicular ferrite are formed [2 – 4]. Sometimes, upper and lower bainites, martensites and the A-M (austenite with martensite) micro constituents may be formed [5, 6]. This complex microstructure mixture can lead to highly varied properties of the weld [3, 7]. A way to unify the structure of the welds is by heat treatment. When the presence of martensite may cause embrittlement, tempering is employed to improve the strength and tough n e s s o f t h e material. In this study, the effects of tempering heat treatment on mechanical properties and microstructure of plain carbon steel weld is investigated. 2. EXPERIMENTAL PROCEDURE Materials used are 10mm steel rods supplied as-rolled from Universal Steel Rolling Mill, Ogba- Ikeja, Lagos, Nigeria. These are four (4) different steel which are essentially different in carbon content. The compositions of the steel rods are given in Table 1. 150 mm long pieces were cut from all grades of the steel rods. The middle of each piece was grooved 6 mm deep and wide using a grinding wheel as illustrated in Figure 1. Figure 1: Dimension of grooved specimen.  Vol.10, No.8 Tempering Heat Treatment Effects on Steel Welds 757 Table 1: Composition of steel rods used. Element (wt %) Sample 1 Sample 2 Sample 3 Sample 4 C 0.2529 0.1576 0.2756 0.3320 Si 0.1468 0.1821 0.1769 0.3116 S 0.0510 0.0598 0.0523 0.0520 P 0.0419 0.0288 0.0275 0.0274 Mn 0.3658 0.6440 0.6247 0.7523 Ni 0.1034 0.1030 0.1170 0.1110 Cr 0.889 0.1224 0.1306 0.1750 Mo 0.0177 0.0114 0.0141 0.0170 V 0.0003 0.001 0.0013 0.003 Cu 0.3213 0.3380 0.3949 0.2773 W 0.0023 0.0007 0.0007 0.0043 As 0.0053 0.0033 0.0033 0.0045 Sn 0.0278 0.0797 0.0797 0.0268 Co 0.0098 0.0086 0.0086 0.0094 Al 0.0049 0.0025 0.0025 0.0025 Pb 0.0012 0.0003 0.0003 0.0017 Ca 0.0004 0.0001 0.0001 0.0005 Zn 0.0033 0.0069 0.0069 0.0061 Fe 98.5550 98.2505 98.2505 97.8859 The grooved samples were then filled in the course of welding to create a weld. AWS E 6013 electrodes were used with a.c. arc welding process. The current used was 100 A with a terminal voltage of 80 V. Eight pieces of welds were prepared in all, two from each grade of steel. A set  758 A.V. Adedayo, S.A. Ibitoye and O.O. Oluwole Vol.10, No.8 of four welds were untreated and kept as control, the other set was then tempered at 640 ˚C for 60 minutes using Deguassa-Durferrit furnace. Hardness values of the welds were determined using a LECO micro-hardness tester which uses a diamond indenter. The test load was 98.07mN (10gf) and the dwell time was 10 seconds. The LECO micro-hardness tester automatically calculates the hardness values in Vickers hardness (VHN). The hardness values of the steel welds were evaluated at three points: (i) the weld pool region (ii) the weld pool and base metal junction (iii) the heat affected zone (HAZ) see fig. 2. Figure 2: Hardness test specimen (1) Weld pool, (2) Weld pool and base metal junction, (3) Heat Affected Zone (HAZ) The toughness values were determined from notched specimen of circular cross section prepared from the steel welds. The specimens were notched at the required points to evaluate their toughness at those points. Micro-examination of the steel welds was carried out with optical microscopy. The microstructures were captured with an Olympus metallurgical microscope which has a minisee optical viewing sy s t e m connected to a computer 3. RESULT AND DISCUSSION Tables 2 to 5 were used to generate Figures 3 to 6. Figures 3 and 4 show the variation of the hardness values, while Figs. 5 and 6 show the toughness values of the specimen along the weld. These figures show a general trend for each of the tempered samples. There is increase in hardness values with increase in carbon content, while the toughness decreased. This is also the trend for the untreated samples. Normally, the structure of the steels investigated, viz: 0.16wt%C, 0.25wt%C, 0.28wt%C and 0.33wt%C are essentially ferritic. Ferritic structures could be: proeutectoide ferrite, polygonal ferrite, aligned and non-aligned side plate ferrite, ferrite carbide aggregates, acicular ferrite, bainitic etc [2]. IIW DOC IX-1533-88 [2] gives a detailed classification of weld metal microstructures. The maximum solubility of carbon in ferrite is 0.025wt%C [8, 9]. This suggests that the ferritic structures in the investigated steels 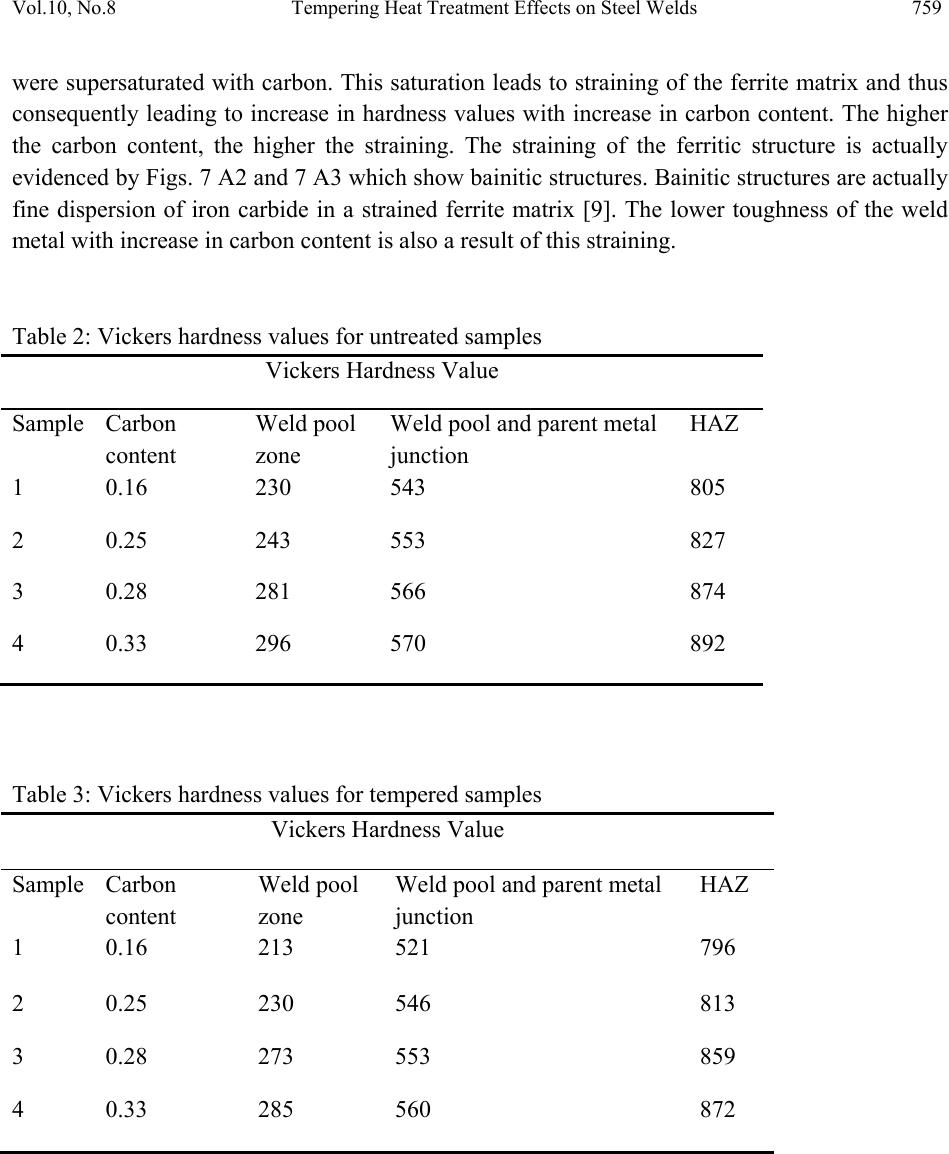 Vol.10, No.8 Tempering Heat Treatment Effects on Steel Welds 759 were supersaturated with carbon. This saturation leads to straining of the ferrite matrix and thus consequently leading to increase in hardness values with increase in carbon content. The higher the carbon content, the higher the straining. The straining of the ferritic structure is actually evidenced by Figs. 7 A2 and 7 A3 which show bainitic structures. Bainitic structures are actually fine dispersion of iron carbide in a strained ferrite matrix [9]. The lower toughness of the weld metal with increase in carbon content is also a result of this straining. Table 2: Vickers hardness values for untreated samples Vickers Hardness Value Sample Carbon content Weld pool zone Weld pool and parent metal junction HAZ 1 0.16 230 543 805 2 0.25 243 553 827 3 0.28 281 566 874 4 0.33 296 570 892 Table 3: Vickers hardness values for tempered samples Vickers Hardness Value Sample Carbon content Weld pool zone Weld pool and parent metal junction HAZ 1 0.16 213 521 796 2 0.25 230 546 813 3 0.28 273 553 859 4 0.33 285 560 872  760 A.V. Adedayo, S.A. Ibitoye and O.O. Oluwole Vol.10, No.8 Table 4: Toughness values of untreated samples Toughness values (J) Sample Carbon content Weld pool zone Weld pool and parent metal junction HAZ 1 0.16 20.16 15.6 8.32 2 0.25 18.32 12.6 7.78 3 0.28 16.6 11.64 6.02 4 0.33 15.84 9.8 4.84 Table 5: Charpy toughness for tempered samples Toughness values (J) Sample Carbon content Weld pool zone Weld pool and parent metal junction HAZ 1 0.16 23.59 16.4 8.82 2 0.25 22.48 13.52 8.29 3 0.28 20.56 11.90 6.52 4 0.33 17.71 10.2 5.56 0 250 500 750 1000 0.05 0.10.15 0.20.250.30.35 Carbon content (wt %) Hard ne ss Val ue (VHN) Weld pool Junction HAZ Figure 3: Variation of hardness with carbon content for untreated sample 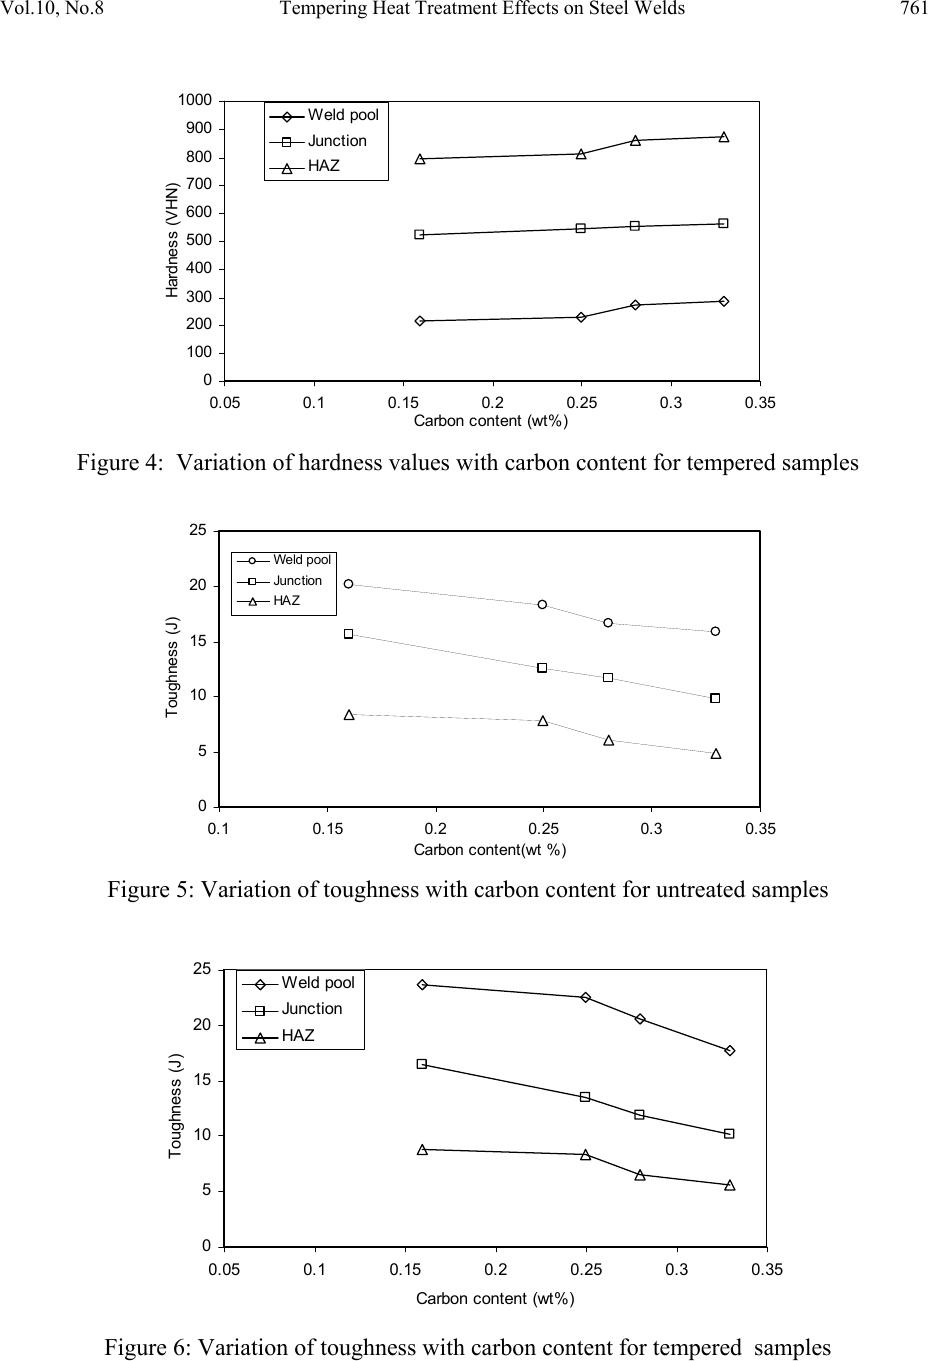 Vol.10, No.8 Tempering Heat Treatment Effects on Steel Welds 761 0 100 200 300 400 500 600 700 800 900 1000 0.05 0.1 0.15 0.2 0.25 0.3 0.35 Carbon c ontent (wt %) Hardn ess (V HN) Weld pool Junction HAZ Figure 4: Variation of hardness values with carbon content for tempered samples 0 5 10 15 20 25 0.10.15 0.2 0.25 0.30.35 Carbon c on t ent(wt %) Toughness (J) Weld pool Junc tion HAZ Figure 5: Variation of toughness with carbon content for untreated samples 0 5 10 15 20 25 0.05 0.1 0.15 0.2 0.25 0.3 0.35 Carbon c ont ent (wt % ) Toughness (J) Weld pool Junc tion HAZ Figure 6: Variation of toughness with carbon content for tempered samples 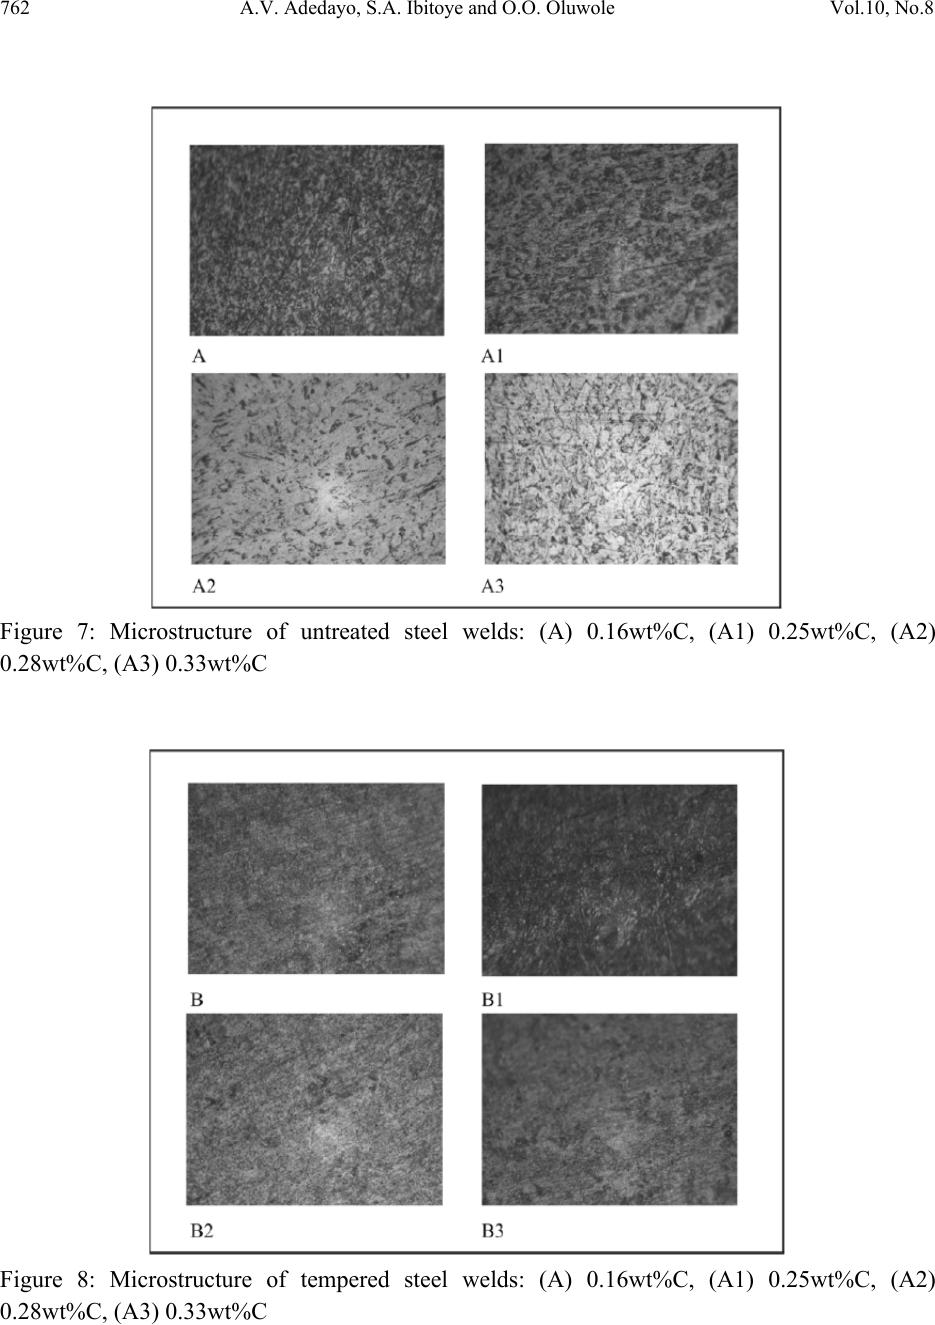 762 A.V. Adedayo, S.A. Ibitoye and O.O. Oluwole Vol.10, No.8 Figure 7: Microstructure of untreated steel welds: (A) 0.16wt%C, (A1) 0.25wt%C, (A2) 0.28wt%C, (A3) 0.33wt%C Figure 8: Microstructure of tempered steel welds: (A) 0.16wt%C, (A1) 0.25wt%C, (A2) 0.28wt%C, (A3) 0.33wt%C  Vol.10, No.8 Tempering Heat Treatment Effects on Steel Welds 763 By comparing the values of Figs. 3 and 4, Figs. 5 and 6, it is obvious that the trend is decreasing, i.e. hardness values decrease from Fig 3 to Fig. 4 while it increased from Fig. 5 to Fig. 6. Figures 4 and 6 are for the tempered samples, while Figs. 3 and 5 are for the untreated samples. Generally, the values for the tempered samples are minimal for hardness and maximum for toughness. During tempering heat treatment, there is ejection of carbon from the super saturated ferrite matrix [7,10]. This leads to the softening of the ferrite matrix. Also any A-M (Austenite with Martensite) phases present are converted to ferrite by losing carbon through diffusion process. Furthermore, the tempering temperature employed (640 ˚C) is equivalent to that used in recrystallization annealing [11-13], as a result, there is nucleation and growth of new crystals due to recrystallization. Figure 8 (B, B1, B2, B3) which reveals micrographs with finer crystals compared to Fig. 7 (A, A1, A2, A3) which are more coarse confirms that recrystallization actually took place during the tempering heat treatment. The structural modification from coarse to fine structure after tempering heat treatment is also responsible for the increased toughness observed. Also, apart from straining due to saturation by carbon atoms which are relieved, residual stresses in the welds are also relieved during tempering. Normally, arc welding process can induce residual stresses in the weld during the course of welding. Also, it is obvious that the hardness values increased from the weld pool through to the heat affected zone (HAZ) where the hardness values are higher. The toughness however decreased. Generally, the electrodes have low carbon content; however, there is carbon pick-up in the weld pool due to dilution and solid state diffusion from the base metal. The higher the carbon diluted and/or diffused into the weld pool, the higher the hardness values. 4. CONCLUSION AND RECOMMENDATION The result of the research shows that the hardness and toughness values of the specimen varies with the carbon contents of the specimen. Generally, there was increase in hardness values with increase in carbon content while toughness decreased. It was also found out that the hardness values were minimal at the weld pool compared to the HAZ. It is the other way round for toughness. Tempering significantly affects the microstructure and thus the mechanical properties of the weld. The range of steels investigated in this work excludes high carbon steels. Further experiment should be carried out to investigate this range of steels. ACKNOWLEDGEMENT The authors wish to thank Mr Adepoju O. Elijah of the Universal Steels Rolling Mill, Ogba- Ikeja, Lagos, Nigeria, for the help in providing the metallurgy steel rods. The authors further  764 A.V. Adedayo, S.A. Ibitoye and O.O. Oluwole Vol.10, No.8 wish to convey their gratitude to the Engineering Materials Development Institute (EMDI) Akure, Ondo State Nigeria for offering the distinguished opportunity to use the institute’s LECO micro-hardness tester. REFERENCES [1] AWS 1997 American Welding Society welding Handbook, 8th ed. New York. [2] IIW 1988 International Institute of Welding, Guidelines for the classification of ferrite steel weld metal microstructure constituents using the light microscopy, International Institute of Welding, IIW DOC. IX-1533-88. [3] Adedayo, A.V., Ibitoye, S.A., Oyetoyan, O.A. 2010 Annealing Heat Treatment Effects on Steel Welds. Journal of Mineral, Materials Characterization and Engineering, Vol. 9, No. 6 pp 547-557. [4] da Trindade Filho V.B., A.S. Guimaraes, J. da C. Payao Filho, R.P. da R. Paranhos 2004 Normalizing heat treatment effects on low alloy steel weld metals. Journal of Brazilian Society of Mechanica l Sci en ce s and Engineering, Vol. 26., No. 1 [5] Grong, O. 1992 Microstructure and properties of steel weld metals in : D.L. Olson and T.H. North (eds. ) Ferrous Alloys Weldments Transaction Technical Publications. Pp 21- 46. [6] Evans, G.M. 1991 The effects of Nickel on microstructure and properties of C-Mn all- weld metal deposits. Welding Research Abroad, 37, Vol. 41 [7] Adedayo, A.V. 2009 Effects of Carbon Content on Steel Welds. Journal of Research in Technology and Enginee r ing Management, Vol. 2, No. 1 pp131-135 [8] Higgins, R.A. 1998 Properties of engineering materials, 2nd ed., Viva books, Private Ltd, New Delhi. [9] Brophy, J.H., Rose, R.M.; Wulff J., 1964 The structure and properties of materials, thermodynamics, vol.2, John Wiley and Sons, Brisbane, pp 113-114, 188-189 [10] Rajan, T.V.; Sharma C.P.; Sharma A. 1988 Heat treatment principles and techniques; prentice-Hall of India, Private Ltd. New Delhi, pp289. [11] Rajput, R.K. 2006 Engineering materials and metallurgy, 1st ed. S. Chand & Co. New Delhi. pp. 66 [12] DeGarmo, E.P.; Black, J.T.; Kosher, R.A. 2003 Material and Processes in Manufacturing 9th ed. John Wiley and Sons, New York, pp 84 [13] DeGarmo, E.P.; Black, J.T.; Kosher, R.A. 1999 Material and Processes in Manufacturing 8th ed. John Wiley and Sons, New York, pp 112 |