Paper Menu >>
Journal Menu >>
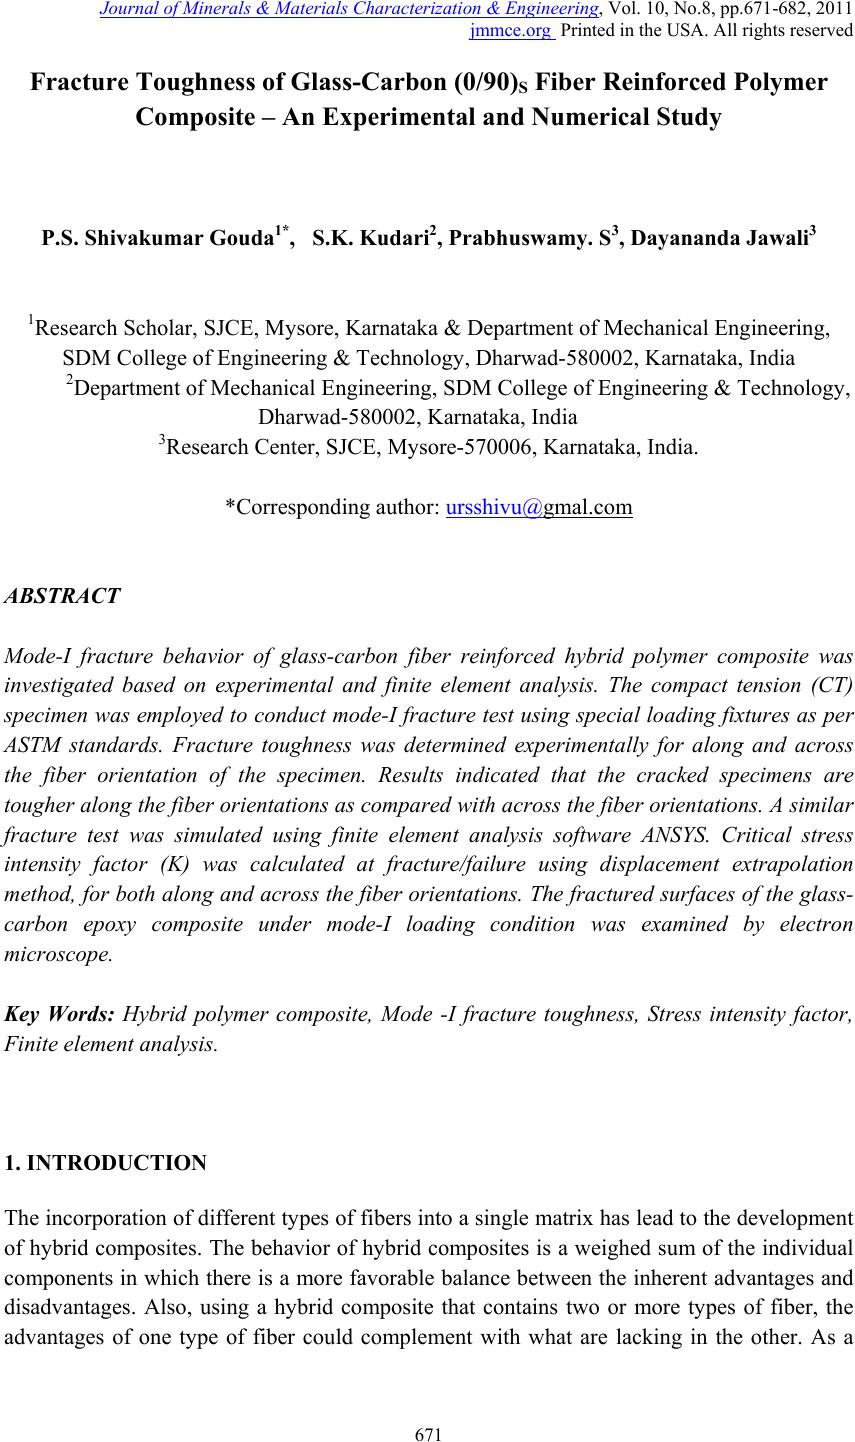 Journal of Minera ls & Materials Ch ar ac teri zatio n & Engineeri ng, Vol. 10, No.8, pp.671-682, 2011 jmmce.org Printed in the USA. All rights reserved 671 Fracture Toughness of Glass-Carbon (0/90)S Fiber Reinforced Polymer Composite – An Experimental and Numerical Study P.S. Shivakumar Gouda1*, S.K. Kudari2, Prabhuswamy. S3, Dayananda Jawali3 1Research Scholar, SJCE, Mysore, Karnataka & Department of Mechanical Engineering, SDM College of Engineering & Technology, Dharwad-580002, Karnataka, India 2Department of Mechanical Engineering, SDM College of Engineering & Technology, Dharwad-580002, Karnataka, India 3Research Center, SJCE, Mysore-570006, Karnataka, India. *Corresponding author: ursshivu@gmal.com ABSTRACT Mode-I fracture behavior of glass-carbon fiber reinforced hybrid polymer composite was investigated based on experimental and finite element analysis. The compact tension (CT) specimen was employed to conduct mode-I fracture test using special loading fixtures as per ASTM standards. Fracture toughness was determined experimentally for along and across the fiber orientation of the specimen. Results indicated that the cracked specimens are tougher along the fiber orientations as compared with across the fib er orientations. A similar fracture test was simulated using finite element analysis software ANSYS. Critical stress intensity factor (K) was calculated at fracture/failure using displacement extrapolation method, for both along and across the fiber orientations. The fractured surfaces of the glass- carbon epoxy composite under mode-I loading condition was examined by electron microscope. Key Words: Hybrid polymer composite, Mode -I fracture toughness, Stress intensity factor, Finite element analysis. 1. INTRODUCTION The incorporation of different types of fibers into a single matrix has lead to the development of hybrid composites. The behavior of hybrid composites is a weighed sum of the individual components in which there is a more favorable balance between the inherent advantages and disadvantages. Also, using a hybrid composite that contains two or more types of fiber, the advantages of one type of fiber could complement with what are lacking in the other. As a 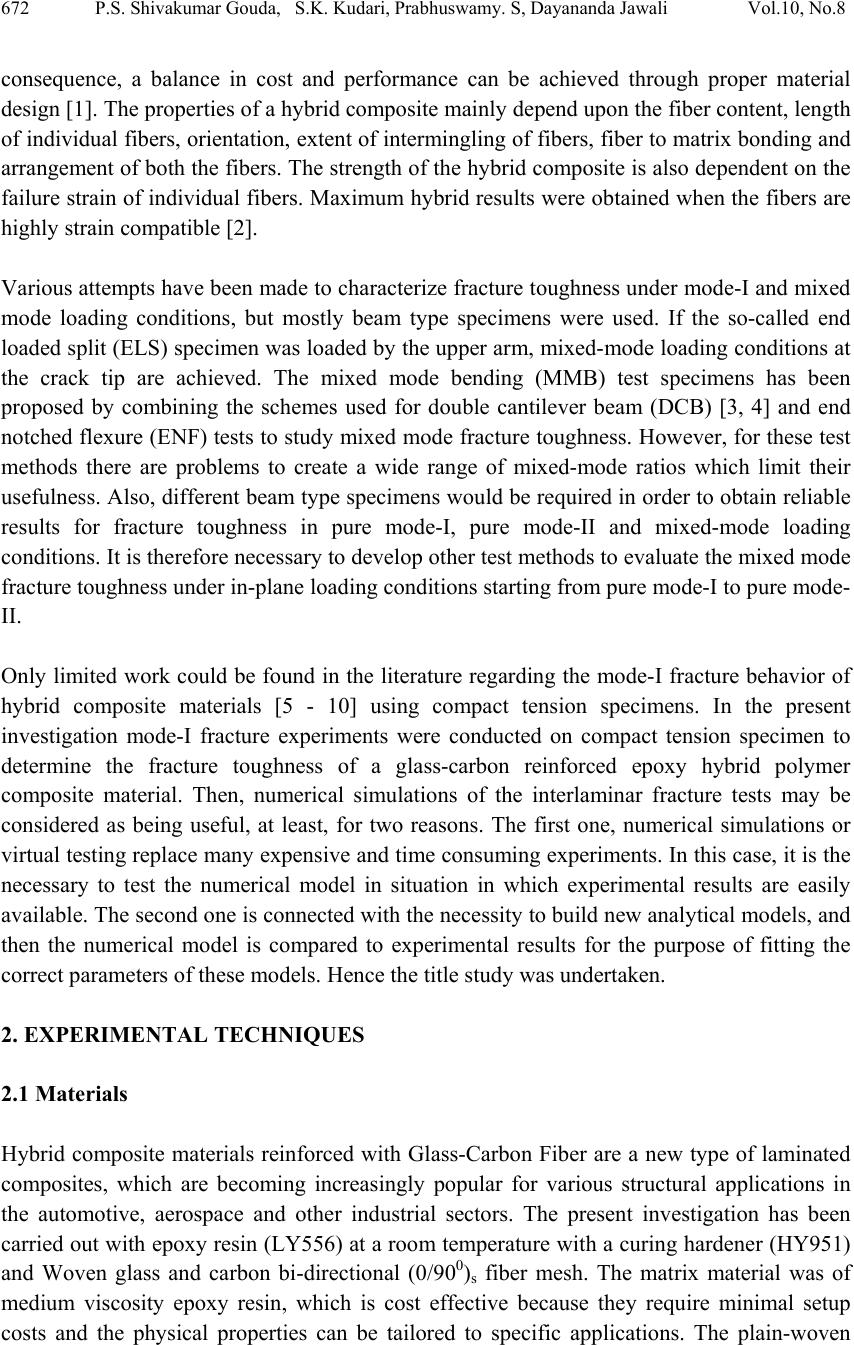 672 P.S. Shivakumar Gouda, S.K. Kudari, Prabhuswamy. S, Dayananda Jawali Vol.10, No.8 consequence, a balance in cost and performance can be achieved through proper material design [1]. The properties of a hybrid composite mainly depend upon the fiber content, length of individual fibers, orientation, extent of intermingling of fibers, fiber to matrix bonding and arrangement of both the fibers. The strength of the hybrid composite is also dependent on the failure strain of individual fibers. Maximum hybrid results were obtained when the fibers are highly strain compatible [2]. Various attempts have been made to characterize fracture toughness under mode-I and mixed mode loading conditions, but mostly beam type specimens were used. If the so-called end loaded split (ELS) specimen was loaded by the upper arm, mixed-mode loading conditions at the crack tip are achieved. The mixed mode bending (MMB) test specimens has been proposed by combining the schemes used for double cantilever beam (DCB) [3, 4] and end notched flexure (ENF) tests to study mixed mode fracture toughness. However, for these test methods there are problems to create a wide range of mixed-mode ratios which limit their usefulness. Also, different beam type specimens would be required in order to obtain reliable results for fracture toughness in pure mode-I, pure mode-II and mixed-mode loading conditions. It is therefore necessary to develop other test methods to evaluate the mixed mode fracture toughness under in-plane loading conditions starting from pure mode-I to pure mode- II. Only limited work could be found in the literature regarding the mode-I fracture behavior of hybrid composite materials [5 - 10] using compact tension specimens. In the present investigation mode-I fracture experiments were conducted on compact tension specimen to determine the fracture toughness of a glass-carbon reinforced epoxy hybrid polymer composite material. Then, numerical simulations of the interlaminar fracture tests may be considered as being useful, at least, for two reasons. The first one, numerical simulations or virtual testing replace many expensive and time consuming experiments. In this case, it is the necessary to test the numerical model in situation in which experimental results are easily available. The second one is connected with the necessity to build new analytical models, and then the numerical model is compared to experimental results for the purpose of fitting the correct parameters of these models. Hence the title study was undertaken. 2. EXPERIMENTAL TECHNIQUES 2.1 Materials Hybrid composite materials reinforced with Glass-Carbon Fiber are a new type of laminated composites, which are becoming increasingly popular for various structural applications in the automotive, aerospace and other industrial sectors. The present investigation has been carried out with epoxy resin (LY556) at a room temperature with a curing hardener (HY951) and Woven glass and carbon bi-directional (0/900)s fiber mesh. The matrix material was of medium viscosity epoxy resin, which is cost effective because they require minimal setup costs and the physical properties can be tailored to specific applications. The plain-woven 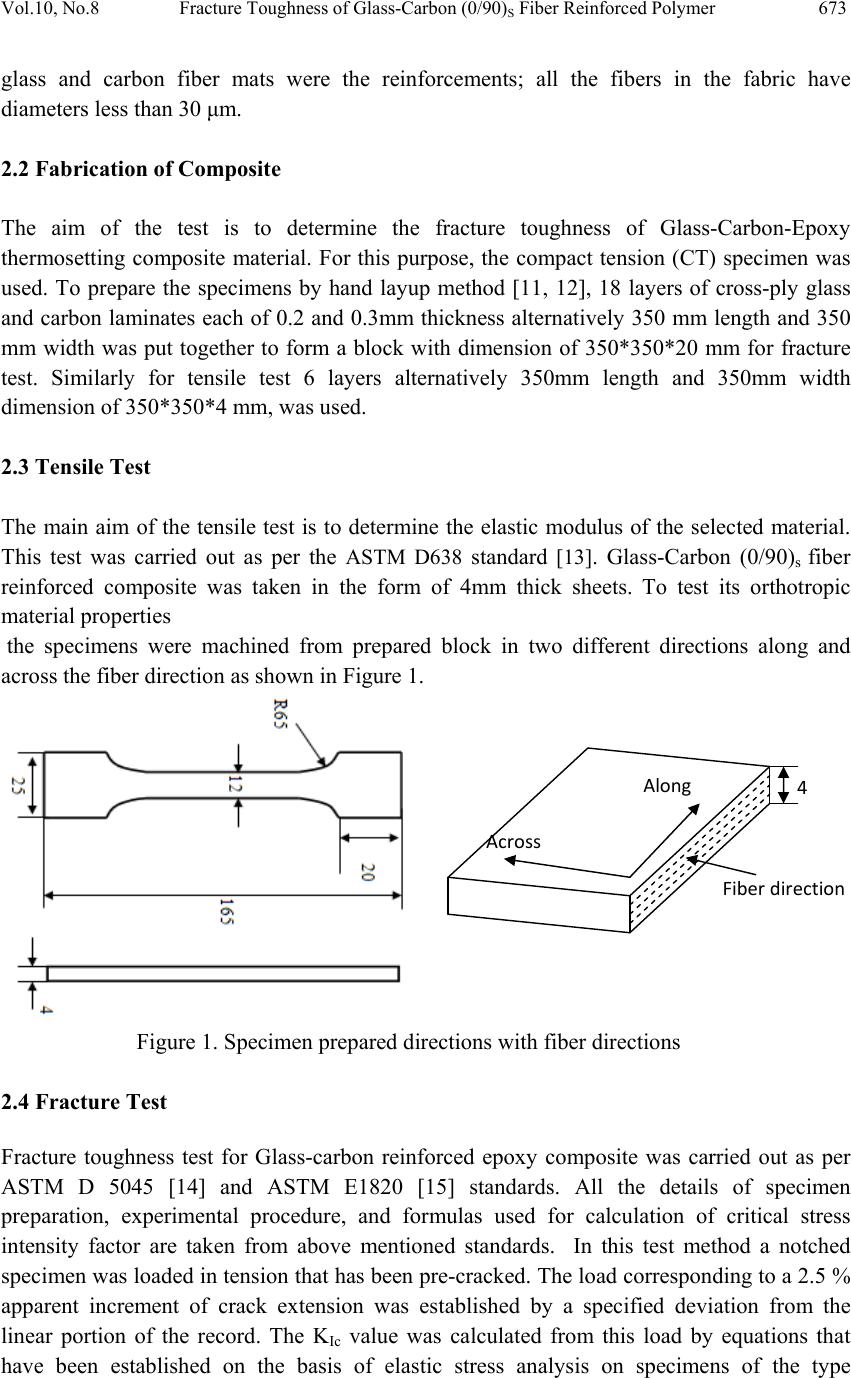 Vol.10, No.8 Fracture Toughness of Glass-Carbon (0/90)S Fiber Reinforced Polymer 673 glass and carbon fiber mats were the reinforcements; all the fibers in the fabric have diameters less than 30 μm. 2.2 Fabrication of Composite The aim of the test is to determine the fracture toughness of Glass-Carbon-Epoxy thermosetting composite material. For this purpose, the compact tension (CT) specimen was used. To prepare the specimens by hand layup method [11, 12], 18 layers of cross-ply glass and carbon laminates each of 0.2 and 0.3mm thickness alternatively 350 mm length and 350 mm width was put together to form a block with dimension of 350*350*20 mm for fracture test. Similarly for tensile test 6 layers alternatively 350mm length and 350mm width dimension of 350*350*4 mm, was used. 2.3 Tensile Test The main aim of the tensile test is to determine the elastic modulus of the selected material. This test was carried out as per the ASTM D638 standard [13]. Glass-Carbon (0/90)s fiber reinforced composite was taken in the form of 4mm thick sheets. To test its orthotropic material properties the specimens were machined from prepared block in two different directions along and across the fiber direction as shown in Figure 1. Figure 1. Specimen prepared directions with fiber directions 2.4 Fracture Test Fracture toughness test for Glass-carbon reinforced epoxy composite was carried out as per ASTM D 5045 [14] and ASTM E1820 [15] standards. All the details of specimen preparation, experimental procedure, and formulas used for calculation of critical stress intensity factor are taken from above mentioned standards. In this test method a notched specimen was loaded in tension that has been pre-cracked. The load corresponding to a 2.5 % apparent increment of crack extension was established by a specified deviation from the linear portion of the record. The KIc value was calculated from this load by equations that have been established on the basis of elastic stress analysis on specimens of the type Along Across 4 Fiberdirection  674 P.S. Shivakumar Gouda, S.K. Kudari, Prabhuswamy. S, Dayananda Jawali Vol.10, No.8 described in the standard ASTM D 5045. The validity of the determination of the KIc value by these test methods depends upon the establishment of a sharp-crack condition at the tip of the crack, in a specimen of adequate size to give linear elastic behavior. Figure 2. Standard specimen dimensions CT geometries were recommended over other configurations because this geometry will allow smaller specimen sizes to achieve plane strain. Specimen dimensions shown in Figure 2 are taken as per the ASTM D 5045 standard. The material is taken in the form of a sheet, the specimen thickness, B =20mm was taken and it is identical with the sheet thickness. The sample width, W = 2B. In the specimen geometry the crack length, a, is selected in such a way that 0.45 < a/w < 0.55. To tests it’s mode-1 and mixed mode [16] fracture toughness specimens were machined from prepared block of composite in two different directions along and across the fiber directions. 2.5 Test Setup Specimens are prepared in accordance with ASTM standards were loaded on a computer controlled Universal Testing Machine. The specimens were clamped in custom-built Transfixing fixture was designed and fabricated to perform the fracture test for mode-I, EN150 steel was used to fabricate this fixture. This was subjected to monotonic uniaxial tension at a displacement rate of 5 mm/min. The tests were closely monitored and conducted at room temperature. Since it is difficult to detect the first point of damage in laminates, the elongation recorded corresponds to the applied load the hybrid composite specimen can withstand. The fracture toughness KIC has been calculated by using load extension curve. 2.6. Finite Element Analysis of the Fracture Model A 3D Finite Element model was created to simulate fracture test in ANSYS 10. Solving a fracture mechanics problem involves performing a linear elastic or elastic-plastic static analysis and then using specialized post processing commands or macros to calculate desired fracture parameters [17]. In this section, we will concentrate on two main aspects of this procedure: Modeling the crack region and calculating fracture parameters. The most important region in a fracture model is the region around the edge of the crack. In linear elastic problems, it has been shown that the displacements near the crack tip (or crack front) 0.27 5W W/4 WB a 0.6W W/10 9000.6W 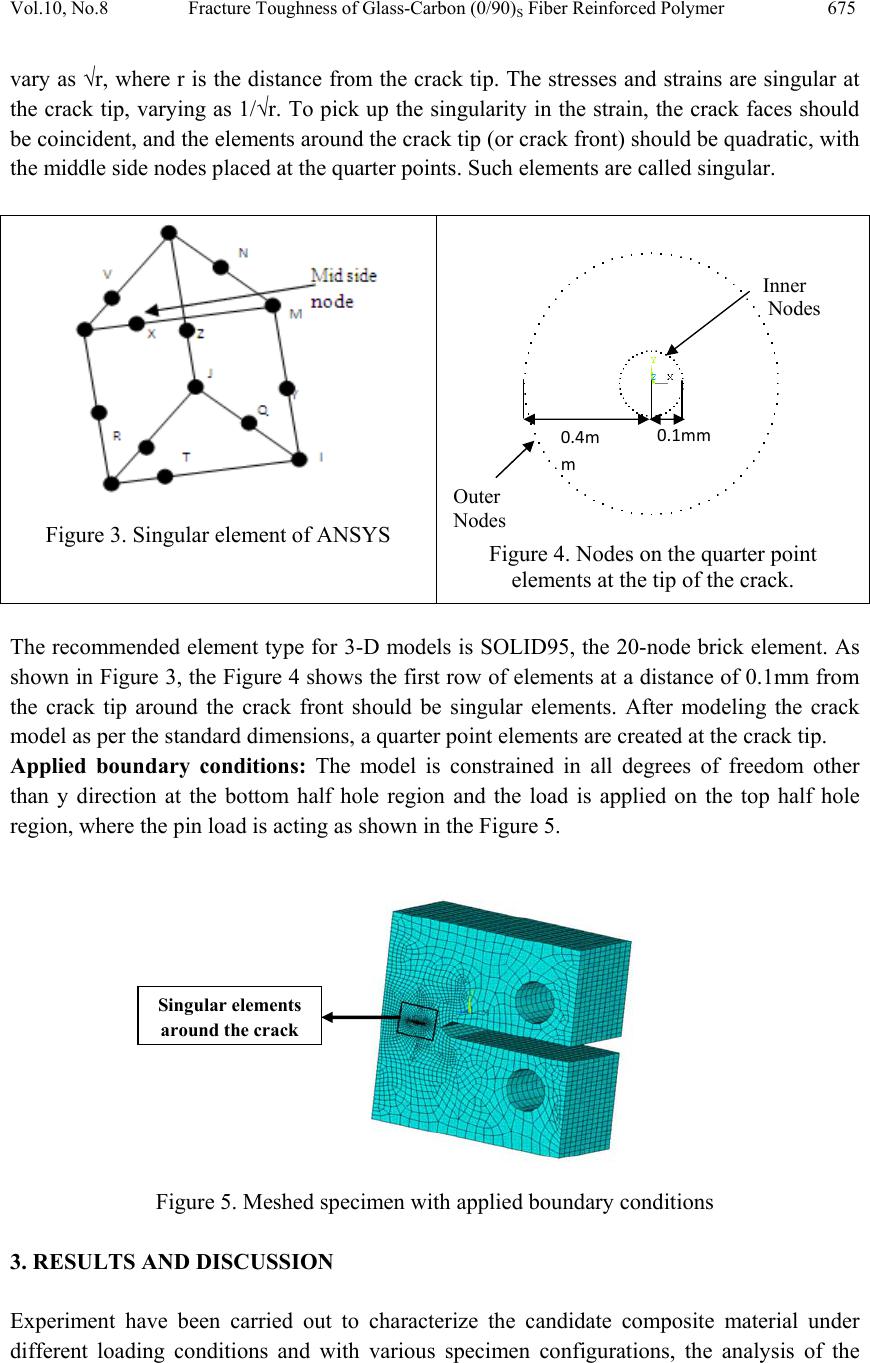 Vol.10, No.8 Fracture Toughness of Glass-Carbon (0/90)S Fiber Reinforced Polymer 675 vary as √r, where r is the distance from the crack tip. The stresses and strains are singular at the crack tip, varying as 1/√r. To pick up the singularity in the strain, the crack faces should be coincident, and the elements around the crack tip (or crack front) should be quadratic, with the middle side nodes placed at the quarter points. Such elements are called singular. Figure 3. Singular element of ANSYS Figure 4. Nodes on the quarter point elements at the tip of the crack. The recommended element type for 3-D models is SOLID95, the 20-node brick element. As shown in Figure 3, the Figure 4 shows the first row of elements at a distance of 0.1mm from the crack tip around the crack front should be singular elements. After modeling the crack model as per the standard dimensions, a quarter point elements are created at the crack tip. Applied boundary conditions: The model is constrained in all degrees of freedom other than y direction at the bottom half hole region and the load is applied on the top half hole region, where the pin load is acting as shown in the Figure 5. Figure 5. Meshed specimen with applied boundary conditions 3. RESULTS AND DISCUSSION Experiment have been carried out to characterize the candidate composite material under different loading conditions and with various specimen configurations, the analysis of the Singular elements around the crack Outer Nodes Inner Nodes 0.1mm 0.4m m 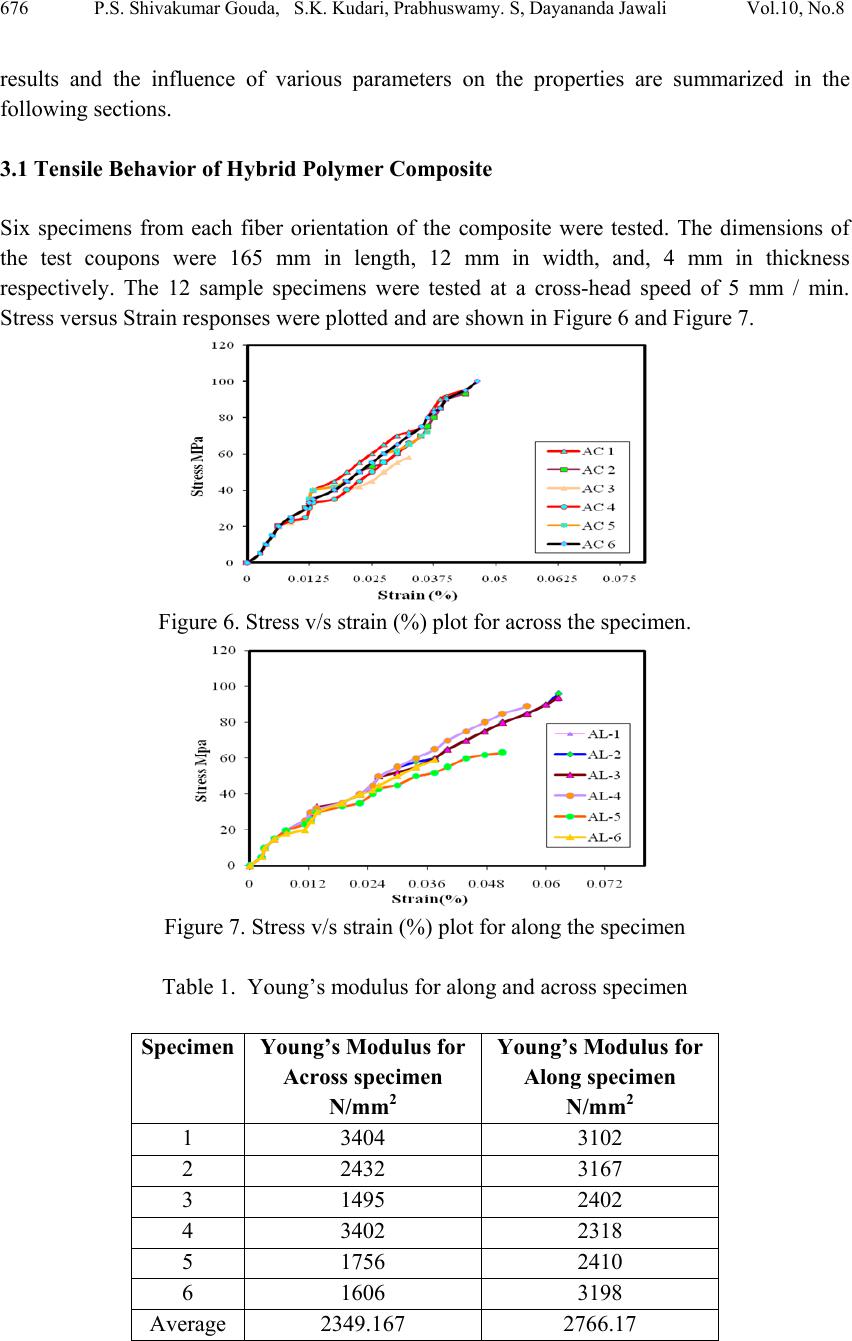 676 P.S. Shivakumar Gouda, S.K. Kudari, Prabhuswamy. S, Dayananda Jawali Vol.10, No.8 results and the influence of various parameters on the properties are summarized in the following sections. 3.1 Tensile Behavior of Hybrid Polymer Composite Six specimens from each fiber orientation of the composite were tested. The dimensions of the test coupons were 165 mm in length, 12 mm in width, and, 4 mm in thickness respectively. The 12 sample specimens were tested at a cross-head speed of 5 mm / min. Stress versus Strain responses were plotted and are shown in Figure 6 and Figure 7. Figure 6. Stress v/s strain (%) plot for across the specimen. Figure 7. Stress v/s strain (%) plot for along the specimen Table 1. Young’s modulus for along and across specimen Specimen Young’s Modulus for Across specimen N/mm2 Young’s Modulus for Along specimen N/mm2 1 3404 3102 2 2432 3167 3 1495 2402 4 3402 2318 5 1756 2410 6 1606 3198 Average 2349.167 2766.17  Vol.10, No.8 Fracture Toughness of Glass-Carbon (0/90)S Fiber Reinforced Polymer 677 The initial tensile response is typical for visco-elastic materials, in that they are initially linear and later become nonlinear. The elastic modulus for six composite specimens was calculated using the slope of stress v/s strain curve. The average modulus for along and across the fiber directions of the glass-carbon epoxy composite was found to be 2766.17 MPa and 2349.16 Mpa respectively. These values are low for these types of composite structures especially for the woven fiber case. It is observed that the difference in Young’s modulus of along and across specimens is 417 MPa, this data is used to calculate mode-I fracture property of the glass-Carbon fiber reinforced epoxy hybrid composite polymer. Figure 8. Glass-Carbon epoxy hybrid composite test coupon after tensile test showing (a) front view and (b) side view. With a magnification of 4X This may be the result of insufficient wetting of fibers and manual errors encountered during the hand layup method of manufacturing process. A microscopic analysis was conducted in order to verify this hypothesis. The resulting microscopic images are shown in Figure 8. The fracture of the Glass-Carbon epoxy hybrid composite test coupon, shown in the above Figure 8(a), began at points A and B. At these points an accumulation of stresses occurred and this is shown by the crazing (white area) on the coupon. This stress concentration was greater than the threshold of the material and failure occurred at points A and B. Thereafter there was catastrophic failure along the width of the specimen as the load bearing area decreased. The test coupon shown in Figure 8 exhibits a fracture path that is angled. This angle was determined to be approximately 20º to the vertical in Figure 8(a). In Figure 8(b) the fracture path is angled at 45º to the vertical, and this is typical of a shear crack. When the load was applied to the specimen, stresses were transversely induced along the fiber edges. Due to the random nature of the fibers, high stress concentration areas were created. The induced stresses in these areas were not greater than the allowable stress but they were sufficient to rupture the matrix. The angled fracture shown in Figure 8(a) is actually the path taken by these stresses, along the fiber edges, throughout the width of the coupon. 3.2 Mode-I Fracture Behavior of Hybrid Polymer Composite Mode-I Fracture toughness test for Glass- Carbon fiber reinforced epoxy polymer composite was carried out as per ASTM D 5045 [18] and ASTM E1820 [19] standards. All the details of  678 P.S. Shivakumar Gouda, S.K. Kudari, Prabhuswamy. S, Dayananda Jawali Vol.10, No.8 specimen preparation, experimental procedure, and formulas used for calculation of critical stress intensity factor are taken from above mentioned standards. The figures 9 and 10, show a Load versus displacement response for the glass-carbon reinforced epoxy composite specimen, from this curve the hybrid polymer composite achieved a average maximum critical stress intensity factor (KIC) of 29.68 MPa√m at a average peak load of 2958N, while an average minimum critical stress intensity factor (KIC) of 23.59 MPa√m at a average peak load of 2860N has been obtained. For the CT specimens tested in mode-I loading, the crack growth was not so smooth nor continuous instead, fewer crack jumps of a few millimeters each time were observed in load versus displacement curves ( Figure 9 and 10) for across and along the fiber orientation of the specimen. Figure 9. Load Vs displacement plot for across the fiber direction Figure 10. Load Vs displacement plot along the fiber direction Further the study has been extended to know the fewer crack jumps during fracture, the mode-I fracture surfaces were examined using a microscope. The microscopic study of fracture surfaces of the mode-I specimens are shown in Figure 11a and b. Figure 11a shows the fractrograph of the mode-I fracture along the fiber orientation of the initiation area taken just beyond the pre crack of the glass- carbon-epoxy composite. Therefore, the fracture surfaces show the first increment of crack growth which corresponds to the measured fracture toughness. The mode-I fracture surface is indicative of a brittle cleavage failure with relatively smooth and flat matrix fracture (11a-A) and shows very small debonding between fiber and matrix, 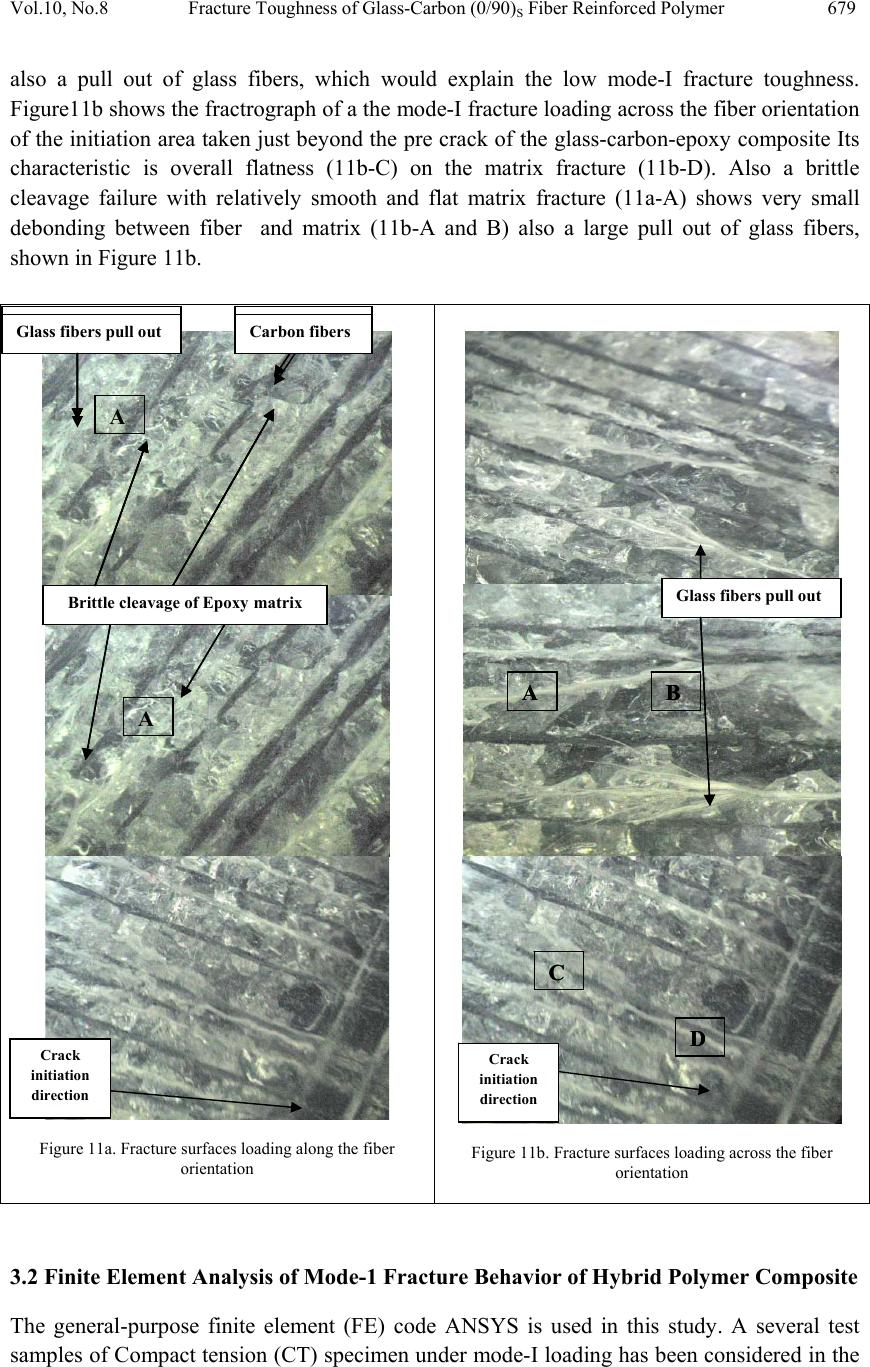 Vol.10, No.8 Fracture Toughness of Glass-Carbon (0/90)S Fiber Reinforced Polymer 679 also a pull out of glass fibers, which would explain the low mode-I fracture toughness. Figure11b shows the fractrograph of a the mode-I fracture loading across the fiber orientation of the initiation area taken just beyond the pre crack of the glass-carbon-epoxy composite Its characteristic is overall flatness (11b-C) on the matrix fracture (11b-D). Also a brittle cleavage failure with relatively smooth and flat matrix fracture (11a-A) shows very small debonding between fiber and matrix (11b-A and B) also a large pull out of glass fibers, shown in Figure 11b. Figure 11a. Fracture surfaces loading along the fiber orientation Figure 11b. Fracture surfaces loading across the fiber orien tat ion 3.2 Finite Element Analysis of Mode-1 Fracture Behavior of Hybrid Polymer Composite The general-purpose finite element (FE) code ANSYS is used in this study. A several test samples of Compact tension (CT) specimen under mode-I loading has been considered in the Glass fibers pull out Carbon fibers Brittle cleavage of Epoxymatrix Glass fibers pull out Carbon fibers Brittle cleavage of Epoxymatrix Crack initiation direction C D Crack initiation direction Glass fibers pull out Carbon fibers Brittle cleavage of EpoxymatrixGlass fibers pull out A B A A A B C D Glass fibers pull out Carbon fibers Brittle cleavage of Epoxymatrix  680 P.S. Shivakumar Gouda, S.K. Kudari, Prabhuswamy. S, Dayananda Jawali Vol.10, No.8 present study with orthotropic material properties as inputs from the tensile test and maximum load and crack length as inputs from experimental fracture test. A series of finite element calculations have been made on the several specimens considering full specimen geometry due to lack of loading symmetry. A typical 3-dimensional FE mesh used in the analysis is shown in Figure.5. The loading and displacement boundary conditions were used in this analysis. Three-dimensional elastic FE calculations were performed using SOLID95, the 20-node higher order brick elements considering plane strain condition. In these calculations, the material behavior has been considered to be linear elastic. The stress intensity factors in mode-I loading (KI) have been computed for various loadings and crack lengths using ANSYS post processor. The magnitudes of KI have also been computed experimentally and cited in the Table 2. This result in Table 2 indicates that there exists some discrepancy in estimation of stress intensity factors by experimental fracture test and present FE results. It is found that there is 15% and 24% error in estimation of KI. This discrepancy in estimated magnitudes of stress intensity factor attributed to varied loading condition in experimental fracture test through loading fixtures. Table 2. Experimental and FE results for across the specimen Table 3. Experimental and FE results for along the specimen The computed magnitudes of KI for the CT specimens are tabulated and it can be seen that the stress intensity factors for mode I is greater along the fiber orientation as compared with the across the fiber orientation. 4. CONCLUSIONS The difference in the magnitude of elastic modulus along and across the fiber orientation is 417 MPa. Also the elastic modulus is dominant in along the fiber orientation of the tensile specimen. Similarly the magnitude of the critical stress intensity factor (KIC) is dominant in along the fiber orientation of the CT specimen. Across specimen Load N Crack Length KIC(Exp) MPa/√m KIC(Ansys) MPa/√m Percentage error 1 2860 6.50 34.07 28.95 15.02 2 2232 8.0 21.67 27.26 22.93 3 2123 6.0 18.35 24.85 24.46 4 2367 7.0 20.30 23.38 19.90 Along specimen Load N Crack Length KIC(Exp) MPa/√m KIC(Ansys) MPa/√m Percentage error 1 2852 5.0 32.84 39.46 17.29 2 2958 5.0 26.34 32.54 23.31 3 2607 5.0 29.23 34.45 17.85 4 2639 13.0 30.34 38.75 21.68  Vol.10, No.8 Fracture Toughness of Glass-Carbon (0/90)S Fiber Reinforced Polymer 681 The fracture surfaces of the glass-carbon-epoxy hybrid composite under mode-I loading condition were examined by electron microscopy to gain insight into the failure responses. The fracture surface observations showed that the mode-I fracture surface is indicative of brittle cleavage failure with relatively smooth and flat matrix fracture and shows a little debonding between fiber and matrix with small amount of glass fiber pullout can be observed. The finite element result indicates that the magnitude of the critical stress intensity factor (KIC) is dominant in along the fiber orientation of the CT specimen also it is found that there is 15% and 24% error in estimation of KIC. This discrepancy in estimated magnitudes of stress intensity factor attributed to varied loading condition and method of composite fabrication, experimental fracture test through the loading fixtures. ACKNOWLEDGEMENTS The authors express their thanks to Dr. S.Mohankumar, Principal, and Management, S.D.M College of Engineering and Technology, Dharwad, Karnataka, India- 580002, and Prof. V.K.Heblikar Professor & Head, Mechanical Engineering, and Dr.S.T.Nandibewoor, Chairman, Department of PG Studies, Karnatak University, Dharwad also to the staff of Mechanical Engineering Department, S.D.M College of Engineering and Technology, and the facility provided for microscopic examinations at Geology laboratories, S.D.M College of Engineering and Technology, Dharwad, India. REFERENCES [1]. M.M Thwe., K Liao. (2003) Comp. Sci. Tech,, 63 ,375 [2]. M.S Sreekala., J.George, M.G Kumaran., S. Thomas (2002) Comp. Sci. Technol. 62 339. [3]. James R. Reeder. K. Song, P. Chunchu, D. R. Ambur, “Postbukling and growth of delamination in composite plates subjected to axial compression.” AIAA journal, 2002. [4]. James R. Reeder and John R. Crews. “Mixed Mode Bending Method for Delamination Testing.” Published in AIAA Journal, vol 28, 1990, pages 1270-1276 [5]. L. P. Borrego , F. V. Antunes, Fatigue Crack Growth Behaviour Under Mixed-Mode Loading, anales de mecánica de la fractura vol. 22 (2005). [6]. M.G.D. Geers a,b, R. de Borst , T. Peijs, Mixed numerical-experimental investigations of non-local characteristics of random-fiber-reinforced composites, Composites Science and Technology 59 (1999) 1569-1578. [7]. P. Naghipour, M. Bartsch, Effect of fiber angle orientation and stacking sequence on mixed mode fracture toughness of carbon fiber reinforced plastics: Numerical and experimental investigations, Journal of Materials Science and Engineering (2009). 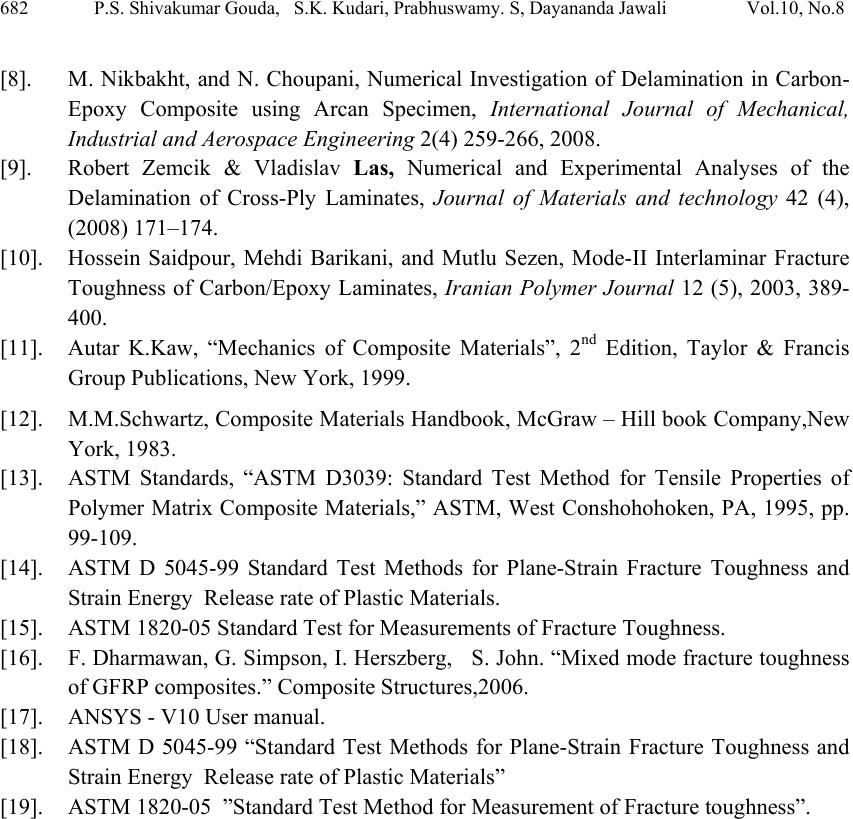 682 P.S. Shivakumar Gouda, S.K. Kudari, Prabhuswamy. S, Dayananda Jawali Vol.10, No.8 [8]. M. Nikbakht, and N. Choupani, Numerical Investigation of Delamination in Carbon- Epoxy Composite using Arcan Specimen, International Journal of Mechanical, Industrial and Aerospace Engineering 2(4) 259-266, 2008. [9]. Robert Zemcik & Vladislav Las, Numerical and Experimental Analyses of the Delamination of Cross-Ply Laminates, Journal of Materials and technology 42 (4), (2008) 171–174. [10]. Hossein Saidpour, Mehdi Barikani, and Mutlu Sezen, Mode-II Interlaminar Fracture Toughness of Carbon/Epoxy Laminates, Iranian Polymer Journal 12 (5), 2003, 389- 400. [11]. Autar K.Kaw, “Mechanics of Composite Materials”, 2nd Edition, Taylor & Francis Group Publications, New York, 1999. [12]. M.M.Schwartz, Composite Materials Handbook, McGraw – Hill book Company,New York, 1983. [13]. ASTM Standards, “ASTM D3039: Standard Test Method for Tensile Properties of Polymer Matrix Composite Materials,” ASTM, West Conshohohoken, PA, 1995, pp. 99-109. [14]. ASTM D 5045-99 Standard Test Methods for Plane-Strain Fracture Toughness and Strain Energy Release rate of Plastic Materials. [15]. ASTM 1820-05 Standard Test for Measurements of Fracture Toughness. [16]. F. Dharmawan, G. Simpson, I. Herszberg, S. John. “Mixed mode fracture toughness of GFRP composites.” Composite Structures,2006. [17]. ANSYS - V10 User manual. [18]. ASTM D 5045-99 “Standard Test Methods for Plane-Strain Fracture Toughness and Strain Energy Release rate of Plastic Materials” [19]. ASTM 1820-05 ”Standard Test Method for Measurement of Fracture toughness”. |