Paper Menu >>
Journal Menu >>
 Journal of Minerals & Materials Characterization & Engineering, Vol. 10, No.3, pp.279-298, 2011 jmmce.org Printed in the USA. All rights reserved 279 Coag-Flocculation Studies of Afzelia Bella Coagulant (ABC) in Coal Effluent Using Single and Simulated Multi Angle Nephelometry M.C. Menkiti* and O.D. Onukwuli Department of Chemical Engineering, Nnamdi Azikiwe University, Awka, Nigeria. *Corresponding author: cmenkiti@yahoo.com Telephone: +234 8037441882 ABSTRACT Following the need for the use of environmentally friendly, renewable resource in industrial processes, this work explores the potential of an effective application in pilot scale of Afzelia bella seed as a coag-flocculant. The study evaluates the coag-flocculation efficiency and functional kinetic parameter response to varying pH and dosage of coal washery effluent and ABC respectively. The maximum coag-flocculation performance is recorded at rate constant, K of 3.3333 x 10⁻³m3/kg.s, dosage of (0.3 and 0.2kg/m3); pH of 2 and coagulation period, τ1/2 of 28.1216 s while the minimum is recorded at K of 1.6667 x 10⁻⁴m3/kg.s, dosage of 0.2kg/m3, pH of 10 and τ1/2 of 562.365 s. The least value of coag-flocculation efficiency, E (%)>89.00. Simulated and unsimulated values of rate constants Ks and K respectively are in close agreement, validating the concept of perikinetics. The potential of ABC as an effective organic coag-flocculant has been established. The results confirm that theory of rapid coag- flocculation holds for the aggregation of coal washery effluent using ABC and at the conditions of the experiment. Keywords: Afzelia bella; coag-flocculation; coal effluent; kinetics; nephelometry. 1. INTRODUCTION 1.1 Background In waste water treatment operations, the process of coag-flocculation (coagulation / flocculation) is employed to separate suspended solids from waste effluent; via floc formation [1, 2, 3, 4,]. Among the factors that can affect the formation of the flocs are temperature, pH, effluent quality e.t.c. [5].  280 M.C. Menkiti and O.D. Onukwuli Vol.10, No.3 Coag-flocculation can be achieved by the use of inorganic substances (alum, FeCl3 e.t.c) and natural organic derivatives. However, the caog-flocculation behaviors of these inorganic aggregates agents are well documented with little or no attention given to the study of the animal and plant material as a potential source of organic derived coagulant. To this end, focus is hereby given to the study of a plant material, Afzelia bella bean, as a potential source of coagulant derivative. Afzelia bella is a leguminous plant, rich in protein, fat and starch. It is a native to tropical climate such as Eastern Nigeria [6]. Afzelia bella is an edible, non-toxic and biodegradable substance. Previous results obtained in its thickening properties highlight promise of renewable material with extensive application in water treatment technology. However, in spite of the abundance of Afzelia bella in our local communities in Nigeria, little or no comprehensive work has been reported on its coag-flocculating application. Against this backdrop, this work endeavors to explore and generate interest in the utilization of Afzelia bella as a coagulant. In line with this, the work focuses on coag-flocculation performance and kinetics of ABC under varying pH of coal washery effluent (a typical medium for this kind of study) using single and simulated multi angle light scattering techniques. Thus if well harnessed and developed, ABC can be an alternative to or be used in conjunction with the inorganic coagulant. Ultimately, post usage handling and health challenges posed by the inorganic coagulant can be reduced. 1.2 Theoretical Principles and Model Development For a uniformly coag-flocculating equilibrium phase with negligible influence of external forces [7]: nTP i ii n G G ,, a constant ….1 And dx dC C TK fi i B d …2 Where G is the total Gibbs free energy ni is the number of moles of component i μi is chemical potential Ci is concentration x is diffusion distance fd is viscous drag force. B K is Boltzmann’s constant (J/K) T is Absolute temperature (K) But from Ficks law  Vol.10, No.3 Coag-Flocculation Studies of Afzelia Bella 281 dx dC C B f D i id …3 Where D′ is diffusion coefficient B is friction factor Comparing equation 2 and 3 generates Einstein’s equation: B TK DB …4 For similar phase, the rate of successful collision between particles sizes i and j (mass concentration/time) to form particle of size k is [8, 5]: Nij = εp β (i,j) ninj …5 where εp = collision efficiency β(i,j) = collision factor between particles of size i and j ninj = particle concentration for particles of size i and j, respectively. Assuming monodisperse, no break up and bi particle collision, the general model for perikinetic coag-flocculation is given as [9, 5]: ki i ji kji knnkinnji dt dn 1 ),(),( 2 1 …6 where dt dnk is the rate of change of concentration of particle of size k (concentration / time). is a function of the coag-flocculation transport mechanism. The appropriate value of for Brownian transport is given by [10]: TKB pBR 3 8 …7 The generic aggregation rate of particles (during coagulation / flocculation) can be derived by the combination of equations 6 and 7 to yield: t tKN dt dN …8 Where t N is total particle concentration at time t , kt nN (mass / volume) K is the Menkonu coag-flocculation rate constant for th order. is the order of coag-flocculation process . Meanwhile BR K 2 1 …9 Also, RpBR K 2 …10 Combining equations 8,9 and 10 produce: dt dNt tRp NK ….11 Where R K is the Von smoluchowski rate constant for rapid coagulation [11].  282 M.C. Menkiti and O.D. Onukwuli Vol.10, No.3 However DaKR 8 ….12 aRp2 ….13 Where a is particle radius. From Einstein’s equation:B T KD B From Stoke’s equation :aB 6 ….14 where η is the viscosity of the coag-flocculating fluid Combining equations 11 to14 gives: t B p tN TK dt dN 3 4 …15 Comparing equations 8 and 15 show: TK KB p 3 4 ...16 For perikinetic aggregation, theoretically equals 2 as would be shown below [12, 7]: From Fick’s law, dR dN RDJ t pf 2 4 ..17 Integrating equation 17 at initial conditions0 t N,aR2 : pt RN Nt p pf dN R dR D J 020 4 ...18 Thus 0 8aNDJ f …19 For central particle of same size undergoing Brownian motion, the initial rate of rapid coag-flocculation is: 0 NJ dt dN pf t …20 2 0 3 4N TKB p ...21 2 3 4 t B pN TK at 0t Hence, from equation 21,2 For 2 ; equivalence of equation 8 yields: 2 KN dt dN Hence: tN NdtK N dN 0 2 0 …22 Thus 0 1 1 N Kt N ...23 Plot of N 1 Vs t produces a slope of K and intercept of 0 1N.  Vol.10, No.3 Coag-Flocculation Studies of Afzelia Bella 283 For the evaluation of coagulation period (21 ), from Equation 23: KN t N N 0 0 1 1 ...24 Where KN0 1 …25 Hence: /1 0 t N N …26 When t , equation 26 becomes 2 0 N N …27 Therefore as 2100 ;5.0 NN Hence KN0 21 5.0 1 ...28 For Brownian (perikinetic) aggregation at early stages (t≤30 minutes), equation 6 can be solved exactly, resulting in the generic expression 1 1 0 )( 1 m m tm t t N N ...29 Where 2 Hence, for singlets (m=1) 2 01 1 1 t NN ...30 For doublets (m=2) 3 02 1 t t NN ...31 For triplets (m=3) 4 2 03 1 t t NN ….32 Also for the coagulating phase, the intensity of light scattered from suspension of monodispersed phase is described as [11]: )()(21)0,(),( 2qACqIqI md mmd ….33 Where I(q, Τd) is the intensity of light scattered by the initially unaggregated suspension ; Τd = t / τ′ (dimensionless time)  284 M.C. Menkiti and O.D. Onukwuli Vol.10, No.3 q is the scattering wave vector 5.0sin 4 0 0 nq …34 where λ0 is the wave length of the laser incident light in Vacuum, (λ0 =2πa / 6) n0 is the refractive index of the suspending medium θ is the scattering angle Am is the form factor for an aggregate consisting of m primary particles. a is radius of particles sphere. If the coagulating medium obeys the Rayleigh-Gans-Debye (RGD) approximations, then m i m jij i mqr qr qA 1 sin )( …35 Where rij is the centre-to-centre separation of primary particles i and j in the given m-fold aggregate. The summation accounts for all pairs of particle centers in the aggregate. The expression for the scattered intensity in view of many possible configurations arising from larger aggregates is: )()(2 )1( sin 21)0,(),( 3 3 0 0qAC qd qd qIqI md mm d d d …36 The form factors are given by an average of all contributing structures where d0 is hard core interaction diameter of singlets.Differentiating equation 36 as t→0, yields: )()(2 )1( sin 21 ),( )0,( 3 3 0 0 0 qAC qd qd dt d dt tqdI qI I md mm d d t …37 0 0 0 0 sin ),( )0,( qd qd N dt tqdI qI I BR t …38 Using simulated version of equation 38, KS (simulated K) can easily be determined at several scattering angles. A plot of 0 0 0 sin ),( )0,( qd qd Vs dt tqdI qI I t gives a slope of N0βBR from where (KS)t→0 could be determined. 2. MATERIALS AND METHODS. The sample of Afzelia bella was sourced from Nsugbe,Anambra State, Nigeria and processed to ABC based on the work reported by Adebowale and Adebowale [13]. The jar test was conducted based on standard Bench scale Nephelometric method (single angle procedure) for the examination of water and waste water [14, 15] using model WZS- 185 MC Turbidimeter, APPNo 688644A Gulenhamp magnetic stirrer and mettler Toledo Delta 320 pH meter. For the simulation, excel package was used while d0 = 1μm [16, 7] and no [17] were generated from literature and simple experiment respectively.  Vol.10, No.3 Coag-Flocculation Studies of Afzelia Bella 285 3. RESULTS AND DISCUSSION 3.1 Coag-flocculation Parameters The values of caog-flocculation reaction parameters are presented in Tables 1 to 6. For all cases of dosages and pH, the value of α is 2, though with the exception of few, the corresponding value of R2 is generally >0.9. This result actually emphasizes its consistency with Von Smoluchowski theory of coagulation. Meanwhile, it should be noted that α relates with K inversely. Since K is rate per concentration and K is associated with energy barrier (KT), it is understandable that for higher α to be obtained, lower K is a necessary condition for such phenomenon [12]. K (=0.5βBR) values appreciably are less sensitive to a given pH as the dosage of ABC changes from 0.1kg/m3 to 0.5kg/m3 .This may be as a result of situation where same or similar coag-flocculation mechanism is controlling the process. Also, the variation in KR is generally minimal; following insignificant changes in values of temperature and viscosity of the coag-flocculation medium. At nearly invariant values of KR ,εP relates directly to 2K= βBR .The consequence is that high εP results in high kinetic energy to overcome the zeta potential. The implication is that the double layer is either reduced or the colloids destabilized to actualize low τ1/2 in favor of high rate of coagulation. The results show that high values of τ1/2 corresponds to low εP and K, and indication of repulsion in the system. τ1/2 values lie within the range of previous works where milliseconds had been reported [7]. Table1: Coag-flocculation Functional parameters for varying pH and constant dosage of 0.1kg/m3 ABC Parameter pH=2 pH=4 pH=6 pH=8 pH=10 2 2 2 2 2 2 R 0.976 0.907 0.989 0.944 0.937 K (m3/kg.s) 1.667 x 10⁻³ 3.333 x 10⁻⁴ 1 x 10⁻³ 3.333 x 10⁻⁴ 1.667 x 10⁻⁴ Br (m3/kg.s) 3.333 x 10⁻³ 6.667x10⁻⁴ 2x10⁻³ 6.667x10⁻⁴ 3.333x10⁻⁴ R K(m3/s) 1.273x10⁻¹⁷ 1.470x10⁻¹⁷ 1.274x10⁻¹⁶ 1.470x10⁻¹⁶ 1.470x10⁻¹⁶ p ( kg-1) 2.618x10¹⁴ 4.535x10¹² 1.570x10¹³ 4.535x10¹² 2.268x10¹² )( 2 1s 56.237 281.19 93.748 281.191 562.365 c SP 0(kg/m3) 0.417 1.25 0.526 1 1.667 c p N0(m-3) 2.5 x 1026 7.5 x 1026 3.1694 x 1026 6.0221 x 1026 10.0371 x 1026 r (kg/m3.s) 1.667x10⁻³ c2 3.333x10⁻³ c2 1x10⁻³ c2 3.333x10⁻⁴ c 1.667x10⁻⁴ c 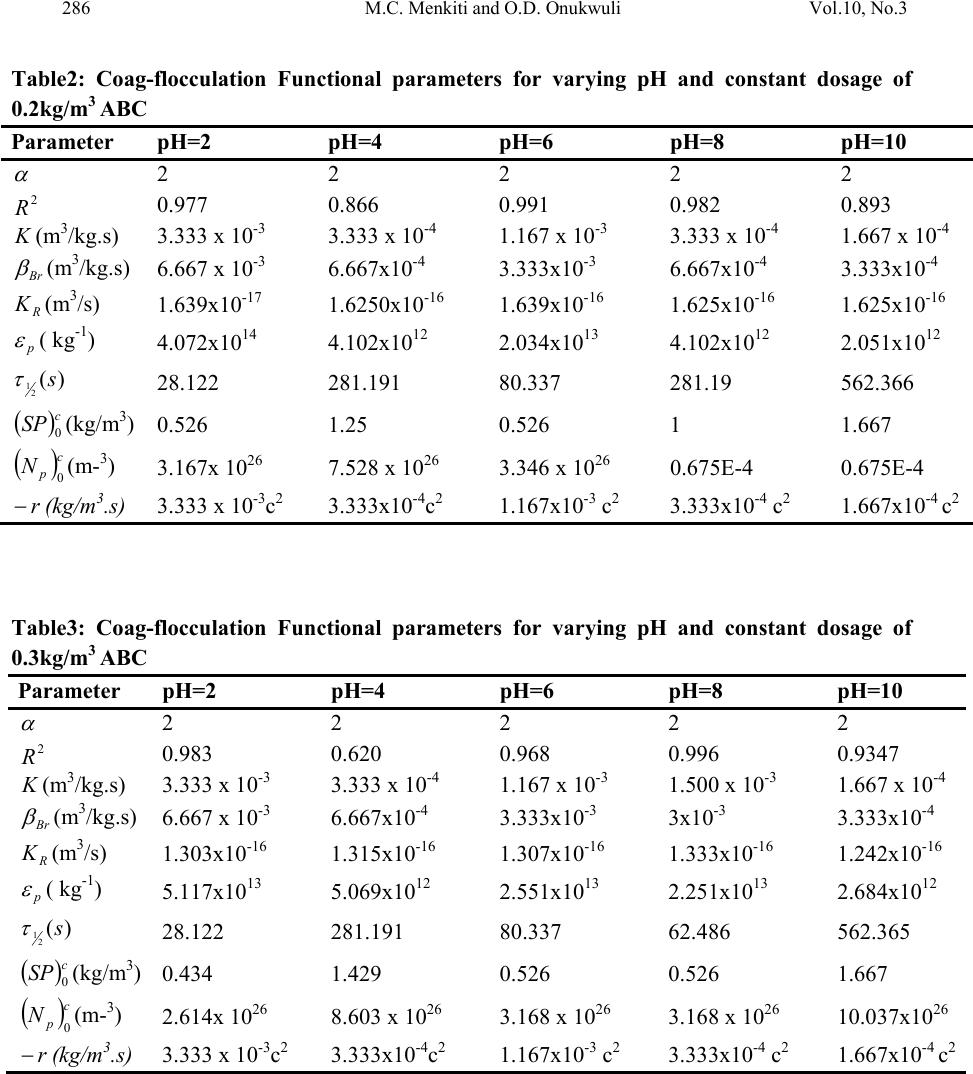 286 M.C. Menkiti and O.D. Onukwuli Vol.10, No.3 Table2: Coag-flocculation Functional parameters for varying pH and constant dosage of 0.2kg/m3 ABC Parameter pH=2 pH=4 pH=6 pH=8 pH=10 2 2 2 2 2 2 R 0.977 0.866 0.991 0.982 0.893 K (m3/kg.s) 3.333 x 10⁻³ 3.333 x 10⁻⁴ 1.167 x 10⁻³ 3.333 x 10⁻⁴ 1.667 x 10⁻⁴ Br (m3/kg.s) 6.667 x 10⁻³ 6.667x10⁻⁴ 3.333x10⁻³ 6.667x10⁻⁴ 3.333x10⁻⁴ R K(m3/s) 1.639x10⁻¹⁷ 1.6250x10⁻¹⁶ 1.639x10⁻¹⁶ 1.625x10⁻¹⁶ 1.625x10⁻¹⁶ p ( kg-1) 4.072x10¹⁴ 4.102x10¹² 2.034x10¹³ 4.102x10¹² 2.051x10¹² )( 2 1s 28.122 281.191 80.337 281.19 562.366 c SP 0(kg/m3) 0.526 1.25 0.526 1 1.667 c p N0(m-3) 3.167x 1026 7.528 x 1026 3.346 x 1026 0.675E-4 0.675E-4 r (kg/m3.s) 3.333 x 10⁻³c2 3.333x10⁻⁴c2 1.167x10⁻³ c2 3.333x10⁻⁴ c2 1.667x10⁻⁴ c2 Table3: Coag-flocculation Functional parameters for varying pH and constant dosage of 0.3kg/m3 ABC Parameter pH=2 pH=4 pH=6 pH=8 pH=10 2 2 2 2 2 2 R 0.983 0.620 0.968 0.996 0.9347 K (m3/kg.s) 3.333 x 10⁻³ 3.333 x 10⁻⁴ 1.167 x 10⁻³ 1.500 x 10⁻³ 1.667 x 10⁻⁴ Br (m3/kg.s) 6.667 x 10⁻³ 6.667x10⁻⁴ 3.333x10⁻³ 3x10⁻³ 3.333x10⁻⁴ R K(m3/s) 1.303x10⁻¹⁶ 1.315x10⁻¹⁶ 1.307x10⁻¹⁶ 1.333x10⁻¹⁶ 1.242x10⁻¹⁶ p ( kg-1) 5.117x10¹³ 5.069x10¹² 2.551x10¹³ 2.251x10¹³ 2.684x10¹² )( 2 1s 28.122 281.191 80.337 62.486 562.365 c SP 0(kg/m3) 0.434 1.429 0.526 0.526 1.667 c p N0(m-3) 2.614x 1026 8.603 x 1026 3.168 x 1026 3.168 x 1026 10.037x1026 r (kg/m3.s) 3.333 x 10⁻³c2 3.333x10⁻⁴c2 1.167x10⁻³ c2 3.333x10⁻⁴ c2 1.667x10⁻⁴ c2  Vol.10, No.3 Coag-Flocculation Studies of Afzelia Bella 287 Table 4: Coag-flocculation Functional parameters for varying pH and constant dosage of 0.4kg/m3 ABC Parameter pH=2 pH=4 pH=6 pH=8 pH=10 2 2 2 2 2 2 R 0.922 0.403 0.851 0.979 0.934 K (m3/kg.s) 3.333 x 10⁻³ 1.667 x 10⁻⁴ 3.333 x 10⁻⁴ 1.667 x 10⁻³ 1.667 x 10⁻⁴ Br (m3/kg.s) 6.667 x 10⁻³ 3.333x10⁻⁴ 6.667x10⁻³ 3.333x10⁻³ 3.333x10⁻⁴ R K(m3/s) 1.130x10⁻¹⁶ 1.231x10⁻¹⁶ 1.130x10⁻¹⁶ 1.242x10⁻¹⁶ 1.243x10⁻¹⁶ p ( kg-1) 5.902x10¹³ 2.708x10¹² 5.902x10¹³ 2.684x10¹³ 2.683x10¹² )( 2 1s 28.122 562.366 281.193 56.237 562.237 c SP 0(kg/m3) 0.100 1.429 1.111 0.556 1.429 c p N0(m-3) 0.602x 1026 8.603 x 1026 6.891 x 1026 3.346 x 1026 8.603x1026 r (kg/m3.s) 3.333 x 10⁻³c2 1.667 x 10⁻⁴c2 3.333 x 10⁻⁴c2 1.667 x 10⁻³c2 1.667x10⁻⁴ c2 Table 5: Coag-flocculation Functional parameters for varying pH and constant dosage of 0.5kg/m3ABC Parameter pH=2 pH=4 pH=6 pH=8 pH=10 2 2 2 2 2 2 R 0.921 0.549 0.986 0.979 0.934 K (m3/kg.s) 3.333 x 10⁻³ 3.333 x 10⁻⁴ 5.000 x 10⁻⁴ 1.667 x 10⁻³ 1.667 x 10⁻⁴ Br (m3/kg.s) 6.667 x 10⁻³ 6.667 x 10⁻⁴ 10.000x10⁻⁴ 3.333x10⁻³ 3.333x10⁻⁴ R K(m3/s) 1.587x10⁻¹⁶ 1.408x10⁻¹⁶ 1.587x10⁻¹⁶ 1.408x10⁻¹⁶ 1.121x10⁻¹⁶ p ( kg-1) 4.200x10¹³ 4.735x10¹² 3.151x10¹² 2.367x10¹³ 2.974x10¹² )( 2 1s 28.119 281.191 187.459 56.237 562.366 c SP 0(kg/m3) 0.769 1.429 1.111 0.323 1.429 c p N0(m-3) 0.602x 1026 8.603 x 1026 6.891 x 1026 3.346 x 1026 8.603x1026 r (kg/m3.s) 3.333 x 10⁻³c2 3.333 x 10⁻⁴c2 5.000 x 10⁻⁴c2 1.667 x 10⁻³c2 1.667x10⁻⁴ c2 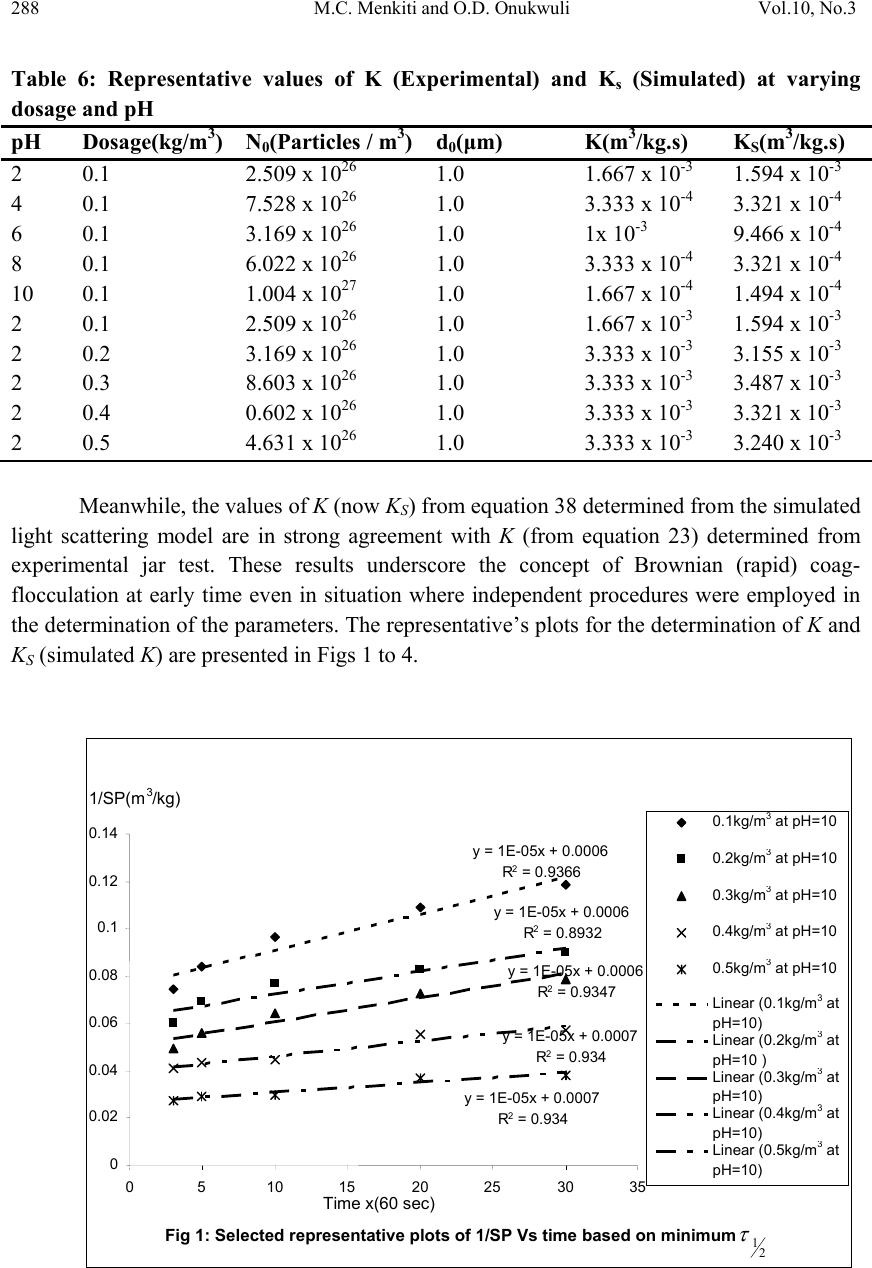 288 M.C. Menkiti and O.D. Onukwuli Vol.10, No.3 Table 6: Representative values of K (Experimental) and Ks (Simulated) at varying dosage and pH pH Dosage(kg/m3) N0(Particles / m3) d0(μm) K(m3/kg.s) KS(m3/kg.s) 2 0.1 2.509 x 1026 1.0 1.667 x 10⁻³ 1.594 x 10⁻³ 4 0.1 7.528 x 1026 1.0 3.333 x 10⁻⁴ 3.321 x 10⁻⁴ 6 0.1 3.169 x 1026 1.0 1x 10⁻³ 9.466 x 10⁻⁴ 8 0.1 6.022 x 1026 1.0 3.333 x 10⁻⁴ 3.321 x 10⁻⁴ 10 0.1 1.004 x 1027 1.0 1.667 x 10⁻⁴ 1.494 x 10⁻⁴ 2 0.1 2.509 x 1026 1.0 1.667 x 10⁻³ 1.594 x 10⁻³ 2 0.2 3.169 x 1026 1.0 3.333 x 10⁻³ 3.155 x 10⁻³ 2 0.3 8.603 x 1026 1.0 3.333 x 10⁻³ 3.487 x 10⁻³ 2 0.4 0.602 x 1026 1.0 3.333 x 10⁻³ 3.321 x 10⁻³ 2 0.5 4.631 x 1026 1.0 3.333 x 10⁻³ 3.240 x 10⁻³ Meanwhile, the values of K (now KS) from equation 38 determined from the simulated light scattering model are in strong agreement with K (from equation 23) determined from experimental jar test. These results underscore the concept of Brownian (rapid) coag- flocculation at early time even in situation where independent procedures were employed in the determination of the parameters. The representative’s plots for the determination of K and KS (simulated K) are presented in Figs 1 to 4. Fig 1: Selected representative plots of 1/SP Vs time based on minimum 2 1 y = 1E-05x + 0.0006 R2 = 0.9366 y = 1E-05x + 0.0006 R2 = 0.8932 y = 1E-05x + 0.0006 R2 = 0.9347 y = 1E-05x + 0.0007 R2 = 0.934 y = 1E-05x + 0.0007 R2 = 0.934 0 0.02 0.04 0.06 0.08 0.1 0.12 0.14 0510 1520 2530 35 Time x(60 sec) 1/SP(m3/kg) 0.1kg/m 3 at pH=10 0.2kg/m 3 at pH=10 0.3kg/m 3 at pH=10 0.4kg/m 3 at pH=10 0.5kg/m 3 at pH=10 Linear (0.1kg/m 3 at pH=10) Linear (0.2kg/m 3 at pH=10 ) Linear (0.3kg/m 3 at pH=10) Linear (0.4kg/m 3 at pH=10) Linear (0.5kg/m 3 at pH=10) 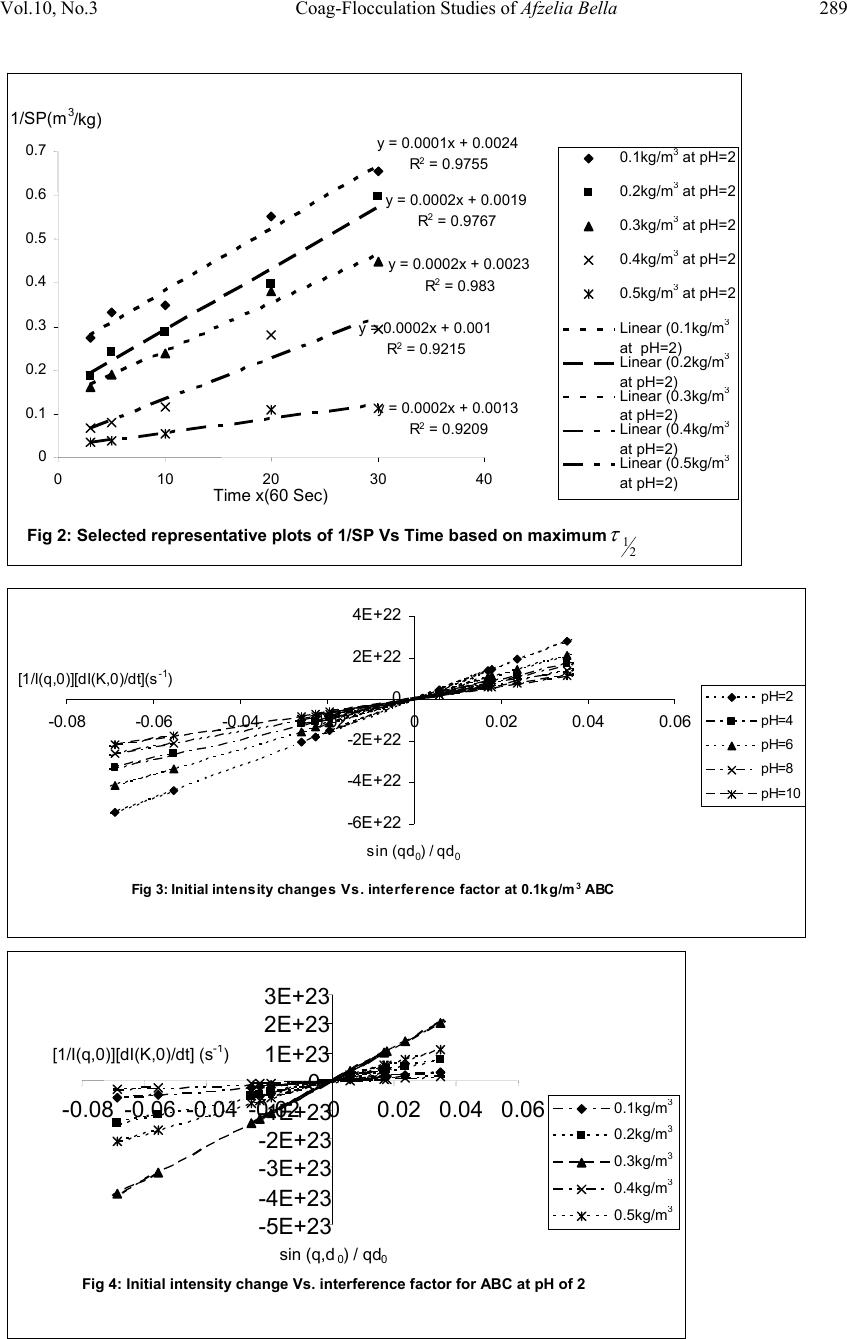 Vol.10, No.3 Coag-Flocculation Studies of Afzelia Bella 289 Fig 3: Initial intensity changes Vs. interference factor at 0.1kg/m 3 ABC -6E+22 -4E+22 -2E+22 0 2E +22 4E +22 -0.08 -0.06 -0.04 -0.0200.020.040.06 sin (qd 0 ) / qd 0 [1/I(q,0)][dI(K,0)/dt](s -1 ) pH=2 pH=4 pH=6 pH=8 pH=10 Fig 2: Selected representative plots of 1/SP Vs Time based on maximum 2 1 y = 0.0001x + 0.0024 R2 = 0.9755 y = 0.0002x + 0.0019 R2 = 0.9767 y = 0.0002x + 0.0023 R2 = 0.983 y = 0.0002x + 0.001 R2 = 0.9215 y = 0.0002x + 0.0013 R2 = 0.9209 0 0.1 0.2 0.3 0.4 0.5 0.6 0.7 010203040 Time x(60 Sec) 1/SP(m3/kg) 0.1kg/m 3 at pH=2 0.2kg/m 3 at pH=2 0.3kg/m 3 at pH=2 0.4kg/m 3 at pH=2 0.5kg/m 3 at pH=2 Linear (0.1kg/m 3 at pH=2) Linear (0.2kg/m 3 at pH=2) Linear (0.3kg/m 3 at pH=2) Linear (0.4kg/m 3 at pH=2) Linear (0.5kg/m 3 at pH=2) Fig 4: Initial intensity change Vs. interference factor for ABC at pH of 2 -5E+23 -4E+23 -3E+23 -2E+23 -1E+23 0 1E+23 2E+23 3E+23 -0.08 -0.06 -0.04 -0.02 00.02 0.04 0.06 sin (q,d0) / qd0 [1/I(q,0)][dI(K,0)/dt] (s- 1 ) 0.1kg/m 3 0.2kg/m 3 0.3kg/m 3 0.4kg/m 3 0.5kg/m 3  290 M.C. Menkiti and O.D. Onukwuli Vol.10, No.3 The discrepancies in K, KR and c SP 0are explained by the unattainable assumption that mixing of particles and ABC throughout the dispersion is 100% efficient before any aggregation occurs. The effect of this limitation will be local increase in particle ratios during the mixing phase given uneven distribution of particles / ABC complexes [18]. Another account is the interplay between the Vander Waal forces and the hydrodynamic interactions which typically alters the theoretically predicted parameter values by a factor of ±2.However, other additional short range forces may represent the most likely explanation for any other remaining discrepancies [19, 20]. 3.2 SP (kg/m3) Vs Time plots The SP Vs Time plots are presented in Figs 5 to 9. The common trend is that SP reduces with time. This is because as single particles flocculate into large aggregates and settle, the turbidity of the dispersion decreases and the transmission intensity increases. This behavior reflects the complex dependence of turbidity (hence coag-flocculation) on particle number (dropping) and particle size (increasing) over time [18]. The rapid settling of the flocculated particle is shown in Figs 5 to 9 where 90% of the initial SP concentration of 21204.72mg/l were removed at the 3rd minute. This is supported strongly by the values of τ1/2 recorded in Tables 1 to 5 where the highest and least coag-flocculation were achieved at pH of 2 and 10 respectively. Fig 5:Plot of SP vs Coag-flocculation Time at varying pH and constant dosage of 0.1kg/m 3 0 200 400 600 800 1000 1200 1400 1600 1800 0 10203040 Timex(60 sec) SPX(1 0 -3 kg/m 3 ) pH=2 pH=4 pH=6 pH=8 pH=10 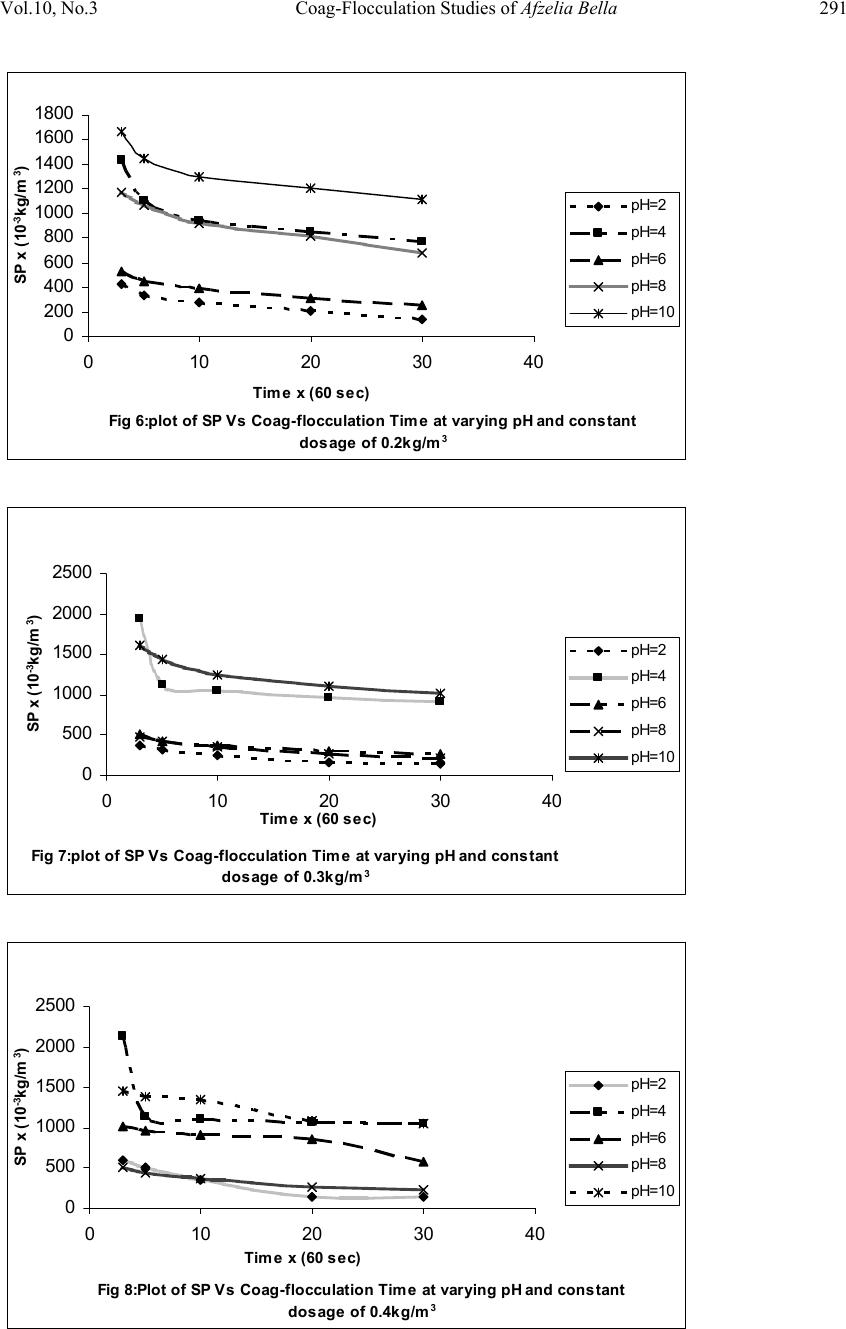 Vol.10, No.3 Coag-Flocculation Studies of Afzelia Bella 291 Fig 6:plot of SP Vs Coag-floccul ation Ti me at varyi ng pH and constant dosage of 0.2kg/m 3 0 200 400 600 800 1000 1200 1400 1600 1800 0 10203040 Time x (60 sec) SP x (10 -3 kg/m 3 ) pH=2 pH=4 pH=6 pH=8 pH=10 Fig 7:plot of SP Vs Coag-flocculation Time at varying pH and constant dosage of 0.3kg/m 3 0 500 1000 1500 2000 2500 0 10203040 Time x (60 sec) SP x (10 -3 kg/m 3 ) pH=2 pH=4 pH=6 pH=8 pH=10 Fig 8:Pl ot of SP Vs Coag-flocculation Time at varying pH and constant dosage of 0.4kg/m 3 0 500 1000 1500 2000 2500 0 10203040 Time x (60 sec) SP x (10 -3 kg/m 3 ) pH=2 pH=4 pH=6 pH=8 pH=10 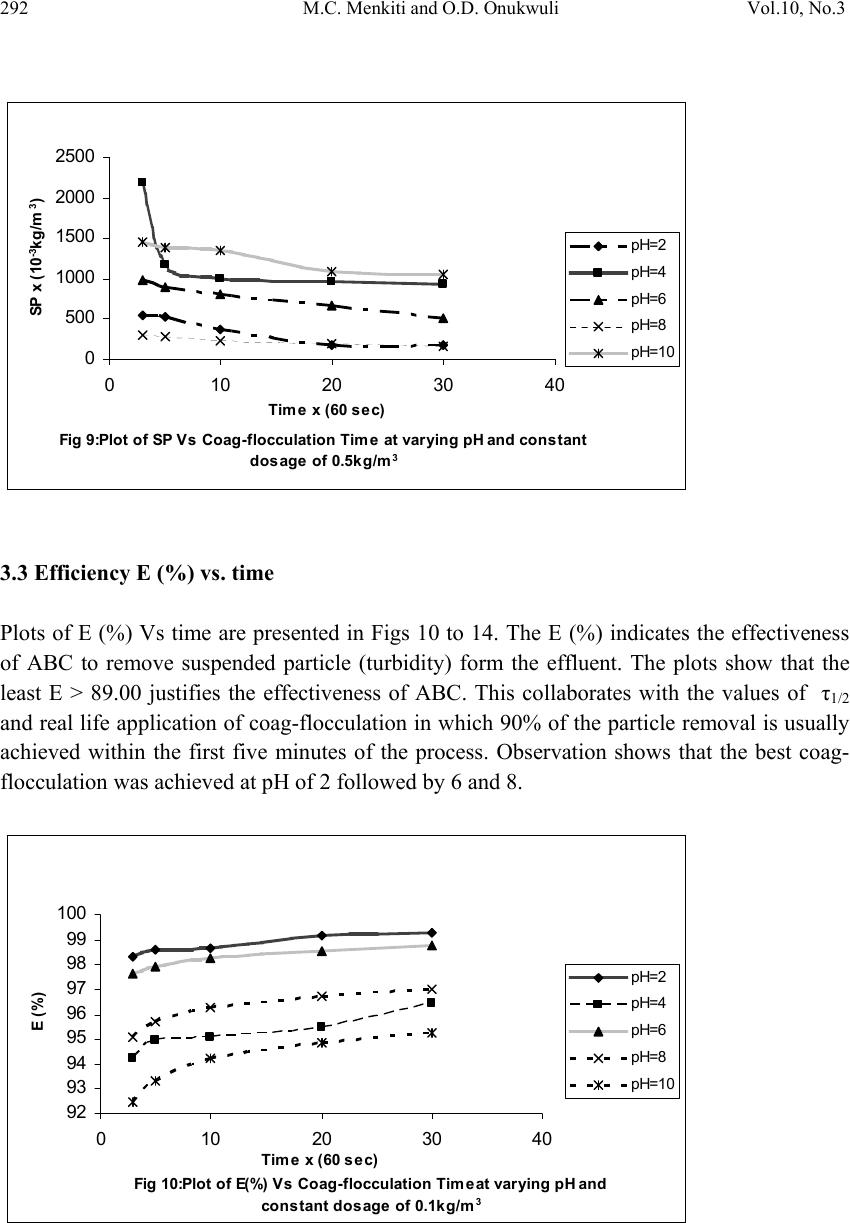 292 M.C. Menkiti and O.D. Onukwuli Vol.10, No.3 Fig 9:P lot of SP Vs Coag-flocculation Time a t varying pH and constant dosage of 0. 5kg/ m 3 0 500 1000 1500 2000 2500 0 10203040 Time x (60 sec) SP x (10 -3 kg/m 3 ) pH=2 pH=4 pH=6 pH=8 pH=10 3.3 Efficiency E (%) vs. time Plots of E (%) Vs time are presented in Figs 10 to 14. The E (%) indicates the effectiveness of ABC to remove suspended particle (turbidity) form the effluent. The plots show that the least E > 89.00 justifies the effectiveness of ABC. This collaborates with the values of τ1/2 and real life application of coag-flocculation in which 90% of the particle removal is usually achieved within the first five minutes of the process. Observation shows that the best coag- flocculation was achieved at pH of 2 followed by 6 and 8. Fig 10:Pl ot of E(%) Vs Coag-flocculati on Timeat varying pH and constant dosage of 0.1kg/m 3 92 93 94 95 96 97 98 99 100 0 10203040 Time x (60 sec) E (%) pH=2 pH=4 pH=6 pH=8 pH=10 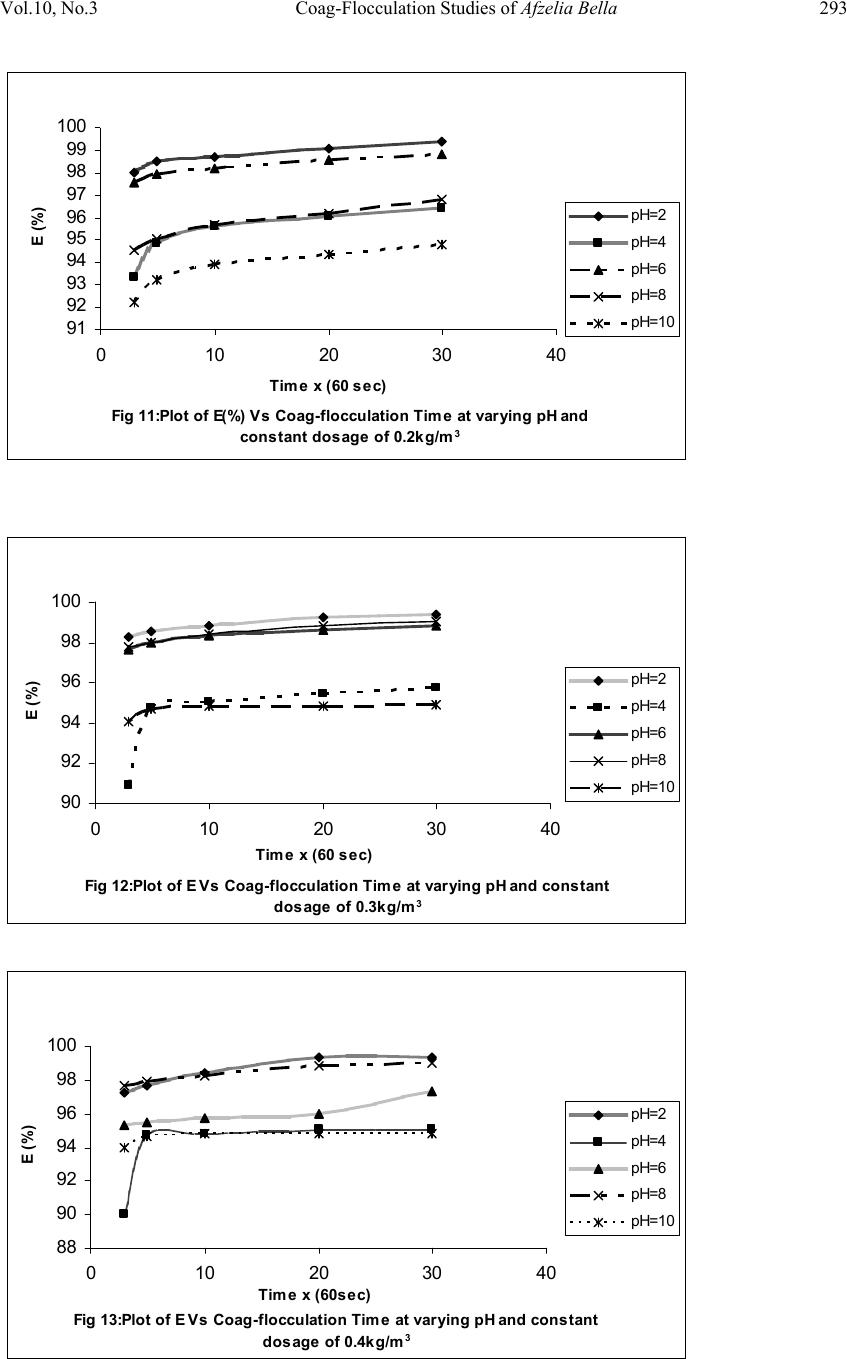 Vol.10, No.3 Coag-Flocculation Studies of Afzelia Bella 293 Fig 11:Plot of E(%) Vs Coag-fl occulati on Time at varying pH and consta nt dosage of 0 .2kg/m 3 91 92 93 94 95 96 97 98 99 100 010203040 Time x (60 sec) E (%) pH=2 pH=4 pH=6 pH=8 pH=10 Fig 12:P lot of E Vs Coag-flocculation Time at varying pH and constant dosage of 0.3kg/m 3 90 92 94 96 98 100 010203040 Time x (60 sec) E (%) pH=2 pH=4 pH=6 pH=8 pH=10 Fig 13:P lot of E Vs Coag-flocculation Time at varying pH and constant dosage of 0.4kg/m 3 88 90 92 94 96 98 100 010203040 Time x (60sec) E (%) pH=2 pH=4 pH=6 pH=8 pH=10  294 M.C. Menkiti and O.D. Onukwuli Vol.10, No.3 Fig 14:P lot of E vs Coag-flocculation Time at varying pH and constant dosage of 0.5kg/m 3 88 90 92 94 96 98 100 010203040 Time x (60sec) E (%) pH=2 pH=4 pH=6 pH=8 pH=10 3.4 E (%) vs. pH This is presented in Fig 15. It indicates the performance of various doses of ABC at varying pH. Interestingly, all the doses have a similar trend having their maxima at pH=2 and minima at pH=10.All doses have the same E at pH of 2,indicating that dose does not affect the E(%) at pH of 2. 3.5 E (%) vs. Dosage (kg/m3) This is presented in Fig 16. The optimum dosages are 0.1kg/m3 and 0.3kg/m3 at E = 99.3722% and pH =2.It confirms the observation made in fig 15.pH of 10 has the least E(%) for all the dosages. Fig 15: Plot of E(%) Vs pH at 30 min for varying dosages 94 95 96 97 98 99 100 024 681012 pH E (%) 0.1kg/m 3 0.2kg/m 3 0.3kg/m 3 0.4kg/m 3 0.5kg/m 3  Vol.10, No.3 Coag-Flocculation Studies of Afzelia Bella 295 Fig 16:P lot of E(% ) Vs Dosages at varying pH and constant Time 94 95 96 97 98 99 100 00.10.20.30.40.50.6 Dosage(kg/m 3 ) E(%) pH=2 pH=4 pH=6 pH=8 pH=10 3.6 Time Evolution of the Cluster Size Distribution The representative plots (here Ni given in particles / m3) are presented in Figs 17 and 18. The discussion is presented in two cases as follows: Case I: Consider Fig 17. The particle distributions expected in a typical coag-flocculation process is shown here. The curves Ni Vs. t, beginning with twins (doublets) passes through a maxima because they are absent at the initial instant (t=0, N2=0) and at the end of coag- flocculation process (t=∞, N2=0).The number of primary particles (singlets) can be seen to decrease more rapidly than the total number of particles. For all consolidated particles, the curves pass through maxima whose height lowers with an increase consolidation. The curves are expected in coag-flocculation where there is absence of excessive colloidal entrapment and high shear resistance. Mainly, the dominant mechanism in these graphs are charge neutralization combined with low bridging to ensure moderate speed of coag- flocculation. The discrete nature of formation of N1, N2, and N3 is associated with moderate energy barrier. Case II: Consider Fig 18.This is the case in which the values of N3 and ∑Ni are close such that their variation with time is near same. Also, similar trend with respect to N2 and Ni is obtained. The plot indicates that there exists a wide margin of difference in concentration values between the pair of (N3 and ∑Ni) and (N2 and Ni).The implication is the existence of high shear force and resistance to collision. This is clearly demonstrated by the value of τ1/2 which is the highest recorded. This is an indication of high zeta potential associated with the process. 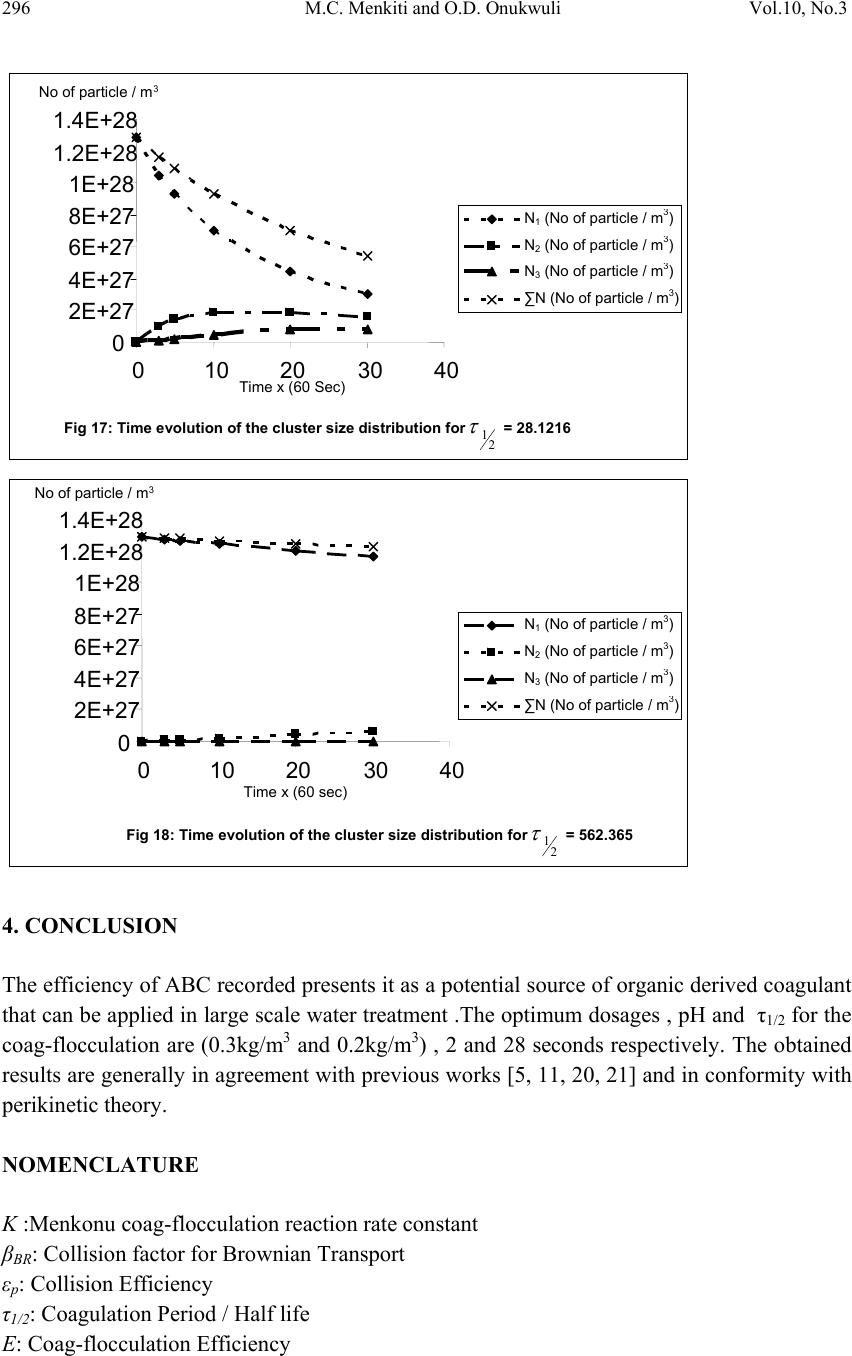 296 M.C. Menkiti and O.D. Onukwuli Vol.10, No.3 4. CONCLUSION The efficiency of ABC recorded presents it as a potential source of organic derived coagulant that can be applied in large scale water treatment .The optimum dosages , pH and τ1/2 for the coag-flocculation are (0.3kg/m3 and 0.2kg/m3) , 2 and 28 seconds respectively. The obtained results are generally in agreement with previous works [5, 11, 20, 21] and in conformity with perikinetic theory. NOMENCLATURE K :Menkonu coag-flocculation reaction rate constant βBR: Collision factor for Brownian Transport εp: Collision Efficiency τ1/2: Coagulation Period / Half life E: Coag-flocculation Efficiency Fig 17: Time evolution of th e cluster size distribution for 2 1 = 28.1216 0 2E+27 4E+27 6E+27 8E+27 1E+28 1.2E+28 1.4E+28 0 102030 40 Time x (60 Sec) No of particle / m3 N1 (No of particle / m 3 ) N2 (No of particle / m 3 ) N3 (No of particle / m 3 ) ∑N (No of particle / m 3 ) Fig 18: Time evolution of the cluster size distribution for 2 1 = 562.365 0 2E+27 4E+27 6E+27 8E+27 1E+28 1.2E+28 1.4E+28 0 102030 40 Time x (60 sec) No of particle / m3 N1 (No of particle / m 3 ) N2 (No of particle / m 3 ) N3 (No of particle / m 3 ) ∑N (No of particle / m 3 )  Vol.10, No.3 Coag-Flocculation Studies of Afzelia Bella 297 R2: Coefficient of Determination α: Coag-flocculation reaction order -r: Coag-flocculation reaction rate c SP 0: Computed initial suspended particle (kg/m3) Jf :Flux fd: Drag force KS : K value obtained from simulation. ABC: Afzelia bella coagulant do : Hard core interaction diameter of the primary particle. a: Radius of the primary particle REFERENCES [1] Ma, J.J., Li, G., Chen, G.R., Xu, G.O., and Cai, G.Q., 2001, “Enhanced coagulation of surface waters with high organic content by permanganate perooxidation” Water science and Technology: Water Supply,Vol 1,pp. 51-61 [2] Diterlizzi, S.D., 1994, Introduction to Coagulation and Flocculation of Waste water, Environmental System Project, U.S.A ,pp 1-4. [3] Edzwald, J.K.,1987, “Coagulation – sedimentation filtration process for removing organic substances in drinking and waste water.”,Noyes Data Corporation ,Park Bridge ,New Jersey, pp 26-27. [4] O’Meila C.R., 1978, Coagulation in waste water treatment : The scientific basis of flocculation (NATO Advanced study Inst. Series E, Appl.Sc.No 27), In : Sijtholf and Noordhoff,Alpenan den Rijn, pp 219-268, (Ives ,K.J., Ed.),Netherlands. [5] Jin, Y., 2005, Use of high Resolution Photographic Technique for studying Coagulation/flocculation in water treatment, M.Sc thesis, University of Saskatchewan, Saskatoon, Canada. [6] Ezeagu I E, Metges C.C, Proll .J, Petzke K.J, and Akinsoyinu A.O, 2006, Chemical composition and nutritive value of some wild gathered tropical plant seeds; Deutscher Akademischer Austaischdienst, German Institute for Human Nutrition Bonn Germany.pp3- 4 [7] Hunter, R.J., 1993; Introduction to Modern Colloid Science, Oxford University Press, New York,pp 33-38;289-290 [8] Thomas, D.N., Judd, S.J., and Fawcett, N., 1999; “ Flocculation modeling: A review”. Water Resources, Vol 33, pp. 1579-1592. [9] Swift, D.L., and Friedlander, S.K., 1964, “The coagulation of hydrolysis by Brownian motion and laminar shear flow.” Journal of Colloid Science, Vol 19, Pp 621. [10] Von Smoluchowski, M., 1917; “Versucheiner Mathematischen Theorie der Koagulations Kinetic Kolloider Lousungen.” Z. Phys. Chem. 92: Pp 129-168. [11] Van Zanten, J.H., and Elimelech M., 1992; “Determination of Rate constants by multi angle light scattering.” Journal of colloid and interface Vol 154, pp 621 [12] Fridkhsberg, D.A., 1984; A course in Colloid Chemistry; Mir Publishers Moscow, Russia. pp 266-268  298 M.C. Menkiti and O.D. Onukwuli Vol.10, No.3 [13] Adebowale, Y.A., and Adebowale, K.A., 2007; “Evaluation of the Gelation characteristics of Mucuna Bean Flour and Protein isolate.” Electronic Journal of Environmental, Agricultural and Food Chemistry,Vol 6,2007,pp 2243-2262. [14] Water Specialist Technology (WST) 2003; About Coagulation and Flocculation: Information Bulletins, U.S.A. pp:1-10 [15] AWWA 2005; American Water Works Association;Standard Methods for the Examination of Water and Waste water Effluent, New York, U.S.A. [16] Ravina .L, 1993; Everything you need to know about coagulation and flocculation,4th Ed .Zeta Meter .Inc.Virginia USA. [17] Nelkon M.; 1981;Principles of physics 4th Edn .Collins International Textbook DepartmentLondon. [18] Yates, P., Yan, Y., Jamson, G. J., and Biggs, S., 2001; “Heteroaggregation of particle system: Aggregation Mechanisms and aggregate structure determination.”6th World Congress of Chemical Engineering,Melbourne,Australia,23-27 September,2001. pp: 1-10 [19] Holthof, H., Schmitt, A., Ferńandez-Barbero,M., Borkovec, M., Cabrerizo-Vilehez, P., Schurtenberger, P., and Hidalgo-Alvarez, R., 1997 ;“Measurement of Absolute Coagulation Rate Constants for Colloidal Particles: Comparison of Single and Multiparticle Light Scattering Techniques.”Journal of Colloid and Interface Science, Vol 192, Pp 463-470. [20] Holthof, H., Egelhaaf, S.U., Borkovec, M., Schurtenberger, P., and Sticher, H., 1996; “Coagulation Rate Measurement of Colloidal Particles by Simultaneous Static and Dynamic Light Scattering.”Langmuir Vol 12, Pp 5541. [21] Menkiti M.C., Nnaji P.C., Nwoye C.I., Onukwuli O.D, 2010; Coag-flocculation kinetics and functional parameters response of Mucuna seed coagulant to pH variation in organic rich coal effluent medium. Journal of minerals and material characterization and Engineering, Vol 9, no 2,Pp 89-103. |