Paper Menu >>
Journal Menu >>
 Journal of Minerals & Materials Characterization & Engineering, Vol. 10, No.2, pp.143-159, 2011 jmmce.org Printed in the USA. All rights reserved 143 The Influence of Creep on the Mechanical Properties of Calcium Carbonate Nanofiller Reinforced Polypropylene Chrisopher Chukwutoo Ihueze1*, Chinedum Ogonna Mgbemena2, Ugwu Sylveste3 1Department of Industrial / Production Engineering, Nnamdi Azikiwe University Awka 2Department of Mechanical Engineering, Nnamdi Azikiwe University Awka 3Department of Mechanical Engineering, University of Nigeria *Corresponding Author: ihuezechukwutoo@yahoo.com ABSTRACT The study focused on experimental and classical data to establish some mechanical properties for optimum design of new polypropylene components to serve under creep environment. The creep studies recorded stress limits that never exceeded 24.19MPa and maximum creep modulus that never exceeded 1.49GPa as against the predictions of classical equations that gave 2.0GPa for PPC0 and 2.46GPa for PPC2 at ambient conditions. The shear modulus and shear strength of the PPC0 and the PPC2 are predicted as 0.75GPa and 120MPa respectively and 0.92GPa and 150MPa respectively while the yield strengths found to be about 13.19MPa and 13.20MPa respectively for PPC0 and PPC2 at elastic strains 0.008 and 0.009 respectively. Further found are that as the material deforms the stiffness or modulus decrease, at low strains there is an elastic region, as temperature and applied stress increase the material becomes more flexible characterized with reduction in moduli. Plastic deformation at strains above 0.01 resulted to strain- hardening or strain-strengthening that manifested as the increasing area ratios and associated creep cold work. Also established by this study is a computational model for evaluating the elastic modulus of polypropylene matrix based material as expressed in equation (6). Both the Halphin-Tsai and the Birintrup equations for elastic modulus of unidirectional fibre composites were confirmed to be appropriate for prediction of elastic modulus of nanofiller composites with polyme r m a t ri x . Keywords: Influence of creep, Mechanical properties, Calcium carbonate nanofiller, Reinforced Polypropylene.  144 C.C. Ihueze, C.O. Mgbemena, U. Sylveste Vol.10, No.2 1. INTRODUCTION Polymeric materials exhibit properties which come somewhere between elastic and viscous properties and are controlled by elastic and viscous constants called modulus and viscosity respectively making the mechanical properties of plastics to be viscoelastic [1]. This means that they vary with time under load, the rate of loading and the temperature and the creep limits of plastic composites need to be established because of involvement of plastics in most recent designs such as in multi-layer moldings, design of snap fits, design of ribbed sections and in design of light weight structures in everyday use. Young’s modulus is low for plastics and never constant compared with metals; resistance to deflection (stiffness) is often a concern regarding the use of plastics and the stiffness of a structure is dependent on the elastic modulus of the material and the part geometry. Though many scholars such as [2-8] have worked extensively on the reinforcement of polypropylene with calcium carbonate nanofiller, studies are yet to advance on the limiting creep properties of polypropylene composites with calcium carbonate nanofiller. This study in order to address this pertinent issue used experimental and classical results to study the creep limiting properties of polypropylene and its calcium carbonate nanofiller composite. Most mechanical properties are structure –sensitive and are therefore affected by changes in either the lattice structure or the microstructure. However modulus of elasticity is one property that is structure insensitive. The modulus of elasticity of material is the same regardless of grain size, amount of cold work, or microstructure while the ductility and toughness that are structure sensitive vary with the amount of cold work and/or grain size. When a crystalline material is plastically deformed, there is an avalanche of dislocations called slip that terminates at the grain boundaries, leading to mass movement of a body of atoms along a crystallographic plane [9]. 2. METHODOLOGY The methods of this study used the experimental tensile and tensile creep test results conducted on calcium carbonate nanofiller reinforced polypropylene composite by [10] with classical data and relations to evaluate the limiting properties of polypropylene as a new material. 2.1. Use of Classical Relations of Composite Elastic Modulus The mass of a composite is the sum of the masses of the matrix (polymer) and the re-enforcing phase (filler). The properties of a composite material are then function of the starting materials [11] so that the following relations are found in literature for estimating the elastic modulus of  Vol.10, No.2 The Influence of Creep on the Mechanical Properties 145 particulate fillers [8] . The modulus of elasticity of the particle filled composite may be predicted using the following equations: φ φ φφ φ φ where E = Modulus of elasticity, φ = volume fractions, Subscripts c, f and p represent the composites, filler and polymer. 2.1.1 Estimation of elastic modulus of the composite The elastic modulus of the composite estimated with equations (1, 2 and 3) in [10] is as presented in Table 1. Table 1: Computed Composite Modulus with Existing Relations φp φf Eq.(1), E(GPa) Eq.(2), E(GPa) Eq.(3), E(GPa) 0.95 0.05 3.162 2.05500444 2.21191 0.9 0.01 2.024 2.17595518 2.00928 0.85 0.15 5.566 2.27560954 2.75718 0.8 0.2 6.768 2.40468101 3.05054 0.75 0.25 7.97 2.54927464 3.35773 0.7 0.3 9.172 2.7123696 3.67872 0.65 0.35 10.374 2.89775958 4.01354 0.6 0.4 11.576 3.11035156 4.36218 0.55 0.45 12.778 3.35660651 4.72463 0.5 0.5 13.98 3.64520744 5.1009 0.4 0.6 16.384 4.40221147 5.8949 This study further employed the Halphin-Tsai and Brintrup equations for composite modulus expressed in equation (4 and 5) respectively [12] to come up with simpler and if possible better approximation for composite elastic modulus. βφ βφ Where β 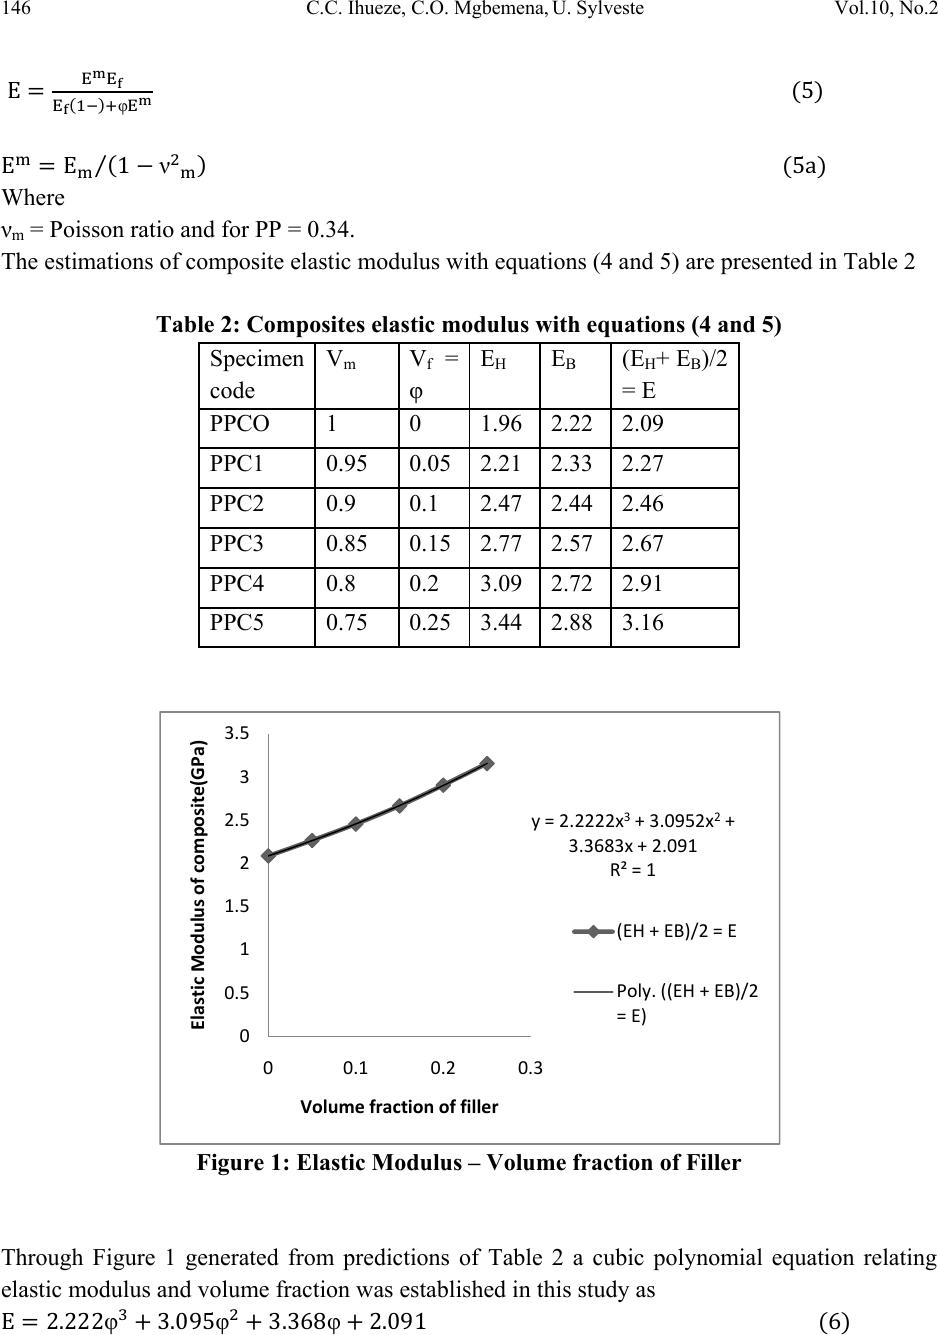 146 C.C. Ihueze, C.O. Mgbemena, U. Sylveste Vol.10, No.2 φ ν Where νm = Poisson ratio and for PP = 0.34. The estimations of composite elastic modulus with equations (4 and 5) are presented in Table 2 Table 2: Composites elastic modulus with equations (4 and 5) Specimen code Vm V f = φ EH E B (EH+ EB)/2 = E PPCO 1 0 1.96 2.22 2.09 PPC1 0.95 0.05 2.21 2.33 2.27 PPC2 0.9 0.1 2.47 2.44 2.46 PPC3 0.85 0.15 2.77 2.57 2.67 PPC4 0.8 0.2 3.09 2.72 2.91 PPC5 0.75 0.25 3.44 2.88 3.16 Figure 1: Elastic Modulus – Volume fraction of Filler Through Figure 1 generated from predictions of Table 2 a cubic polynomial equation relating elastic modulus and volume fraction was established in this study as φ φ φ y=2.2222x3+3.0952x2+ 3.3683x+2.091 R²=1 0 0.5 1 1.5 2 2.5 3 3.5 00.1 0.2 0.3 ElasticModulusofcomposite(GPa) Volumefractionoffiller (EH+EB)/2=E Poly.((EH+EB)/2 =E) 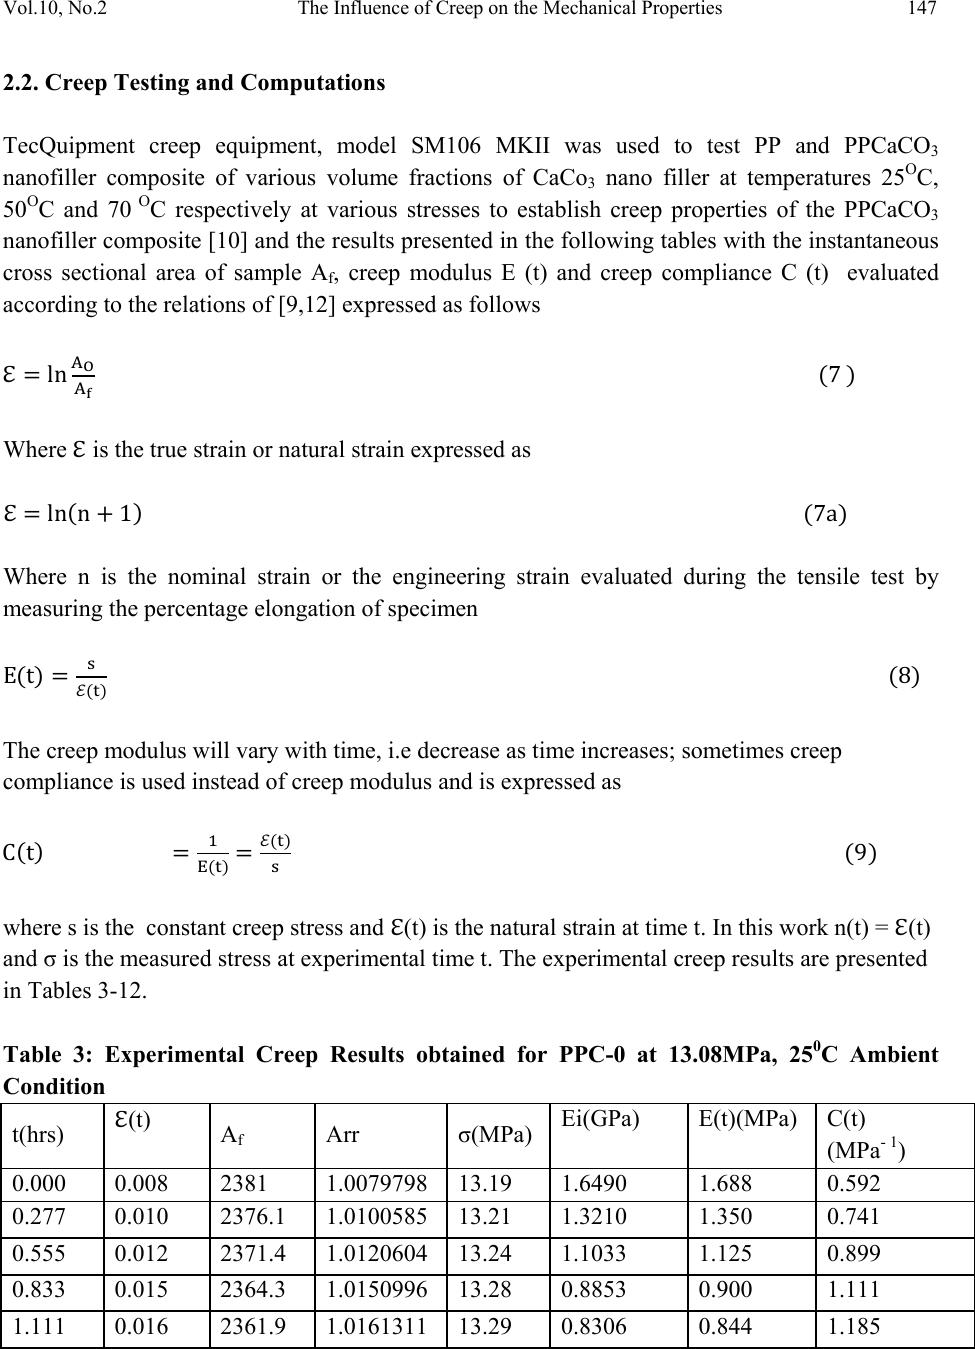 Vol.10, No.2 The Influence of Creep on the Mechanical Properties 147 2.2. Creep Testing and Computations TecQuipment creep equipment, model SM106 MKII was used to test PP and PPCaCO3 nanofiller composite of various volume fractions of CaCo3 nano filler at temperatures 25OC, 50OC and 70 O C respectively at various stresses to establish creep properties of the PPCaCO3 nanofiller composite [10] and the results presented in the following tables with the instantaneous cross sectional area of sample Af, creep modulus E (t) and creep compliance C (t) evaluated according to the relations of [9,12] expressed as follows Where is the true strain or natural strain expressed as Where n is the nominal strain or the engineering strain evaluated during the tensile test by measuring the percentage elongation of specimen The creep modulus will vary with time, i.e decrease as time increases; sometimes creep compliance is used instead of creep modulus and is expressed as where s is the constant creep stress and (t) is the natural strain at time t. In this work n(t) = (t) and σ is the measured stress at experimental time t. The experimental creep results are presented in Tables 3-12. Table 3: Experimental Creep Results obtained for PPC-0 at 13.08MPa, 250C Ambient Condition t(hrs) (t) Af Arr σ(MPa) Ei(GPa) E(t)(MPa) C(t) (MPa- 1) 0.000 0.008 2381 1.0079798 13.19 1.6490 1.688 0.592 0.277 0.010 2376.1 1.0100585 13.21 1.3210 1.350 0.741 0.555 0.012 2371.4 1.0120604 13.24 1.1033 1.125 0.899 0.833 0.015 2364.3 1.0150996 13.28 0.8853 0.900 1.111 1.111 0.016 2361.9 1.0161311 13.29 0.8306 0.844 1.185 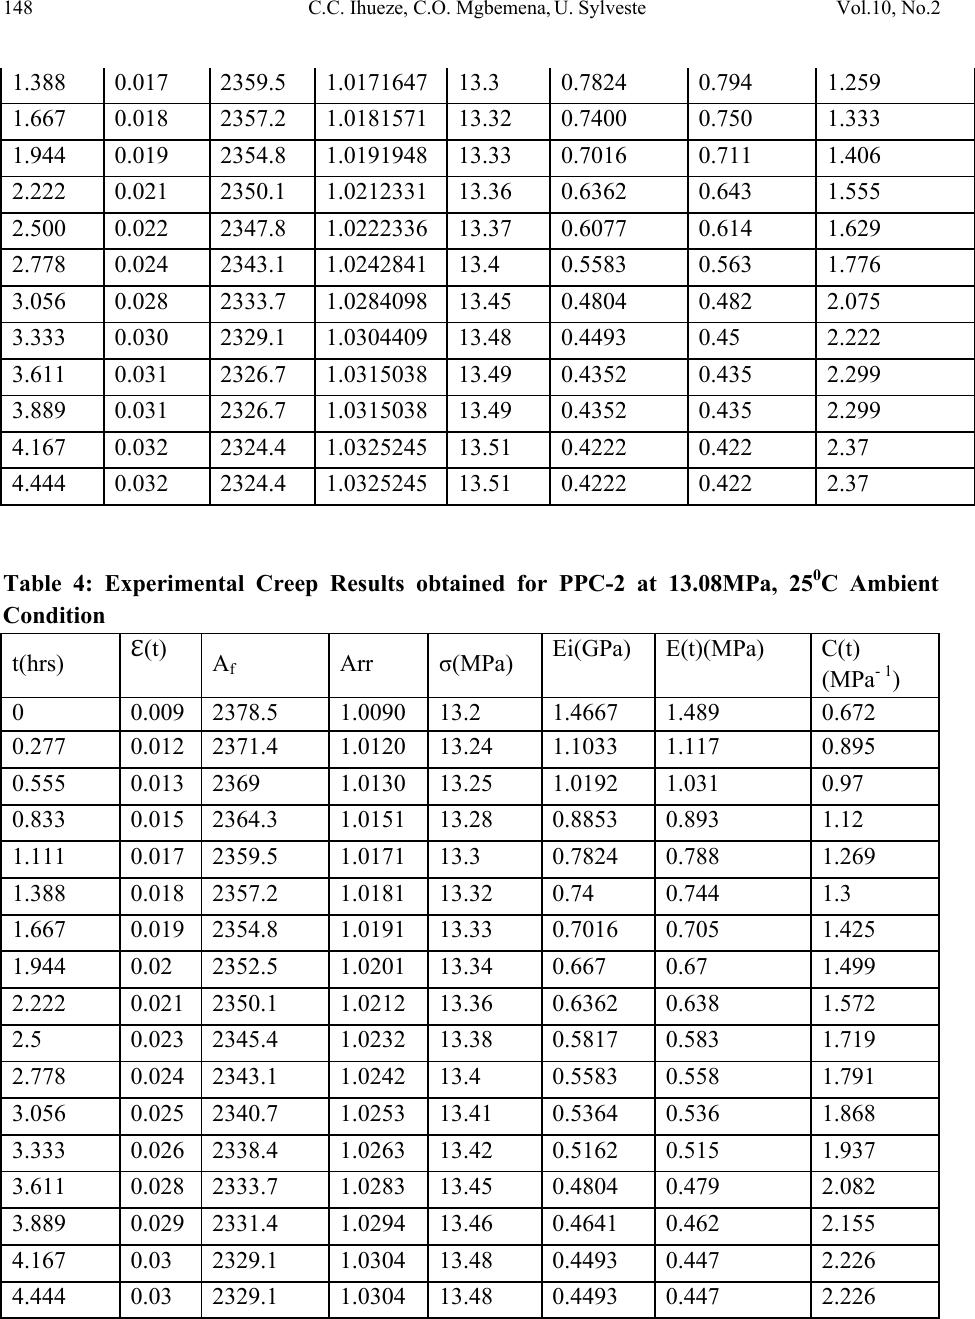 148 C.C. Ihueze, C.O. Mgbemena, U. Sylveste Vol.10, No.2 1.388 0.017 2359.5 1.0171647 13.3 0.7824 0.794 1.259 1.667 0.018 2357.2 1.0181571 13.32 0.7400 0.750 1.333 1.944 0.019 2354.8 1.0191948 13.33 0.7016 0.711 1.406 2.222 0.021 2350.1 1.0212331 13.36 0.6362 0.643 1.555 2.500 0.022 2347.8 1.0222336 13.37 0.6077 0.614 1.629 2.778 0.024 2343.1 1.0242841 13.4 0.5583 0.563 1.776 3.056 0.028 2333.7 1.0284098 13.45 0.4804 0.482 2.075 3.333 0.030 2329.1 1.0304409 13.48 0.4493 0.45 2.222 3.611 0.031 2326.7 1.0315038 13.49 0.4352 0.435 2.299 3.889 0.031 2326.7 1.0315038 13.49 0.4352 0.435 2.299 4.167 0.032 2324.4 1.0325245 13.51 0.4222 0.422 2.37 4.444 0.032 2324.4 1.0325245 13.51 0.4222 0.422 2.37 Table 4: Experimental Creep Results obtained for PPC-2 at 13.08MPa, 250C Ambient Condition t(hrs) (t) Af Arr σ(MPa) Ei(GPa) E(t)(MPa) C(t) (MPa- 1) 0 0.009 2378.5 1.0090 13.2 1.4667 1.489 0.672 0.277 0.012 2371.4 1.0120 13.24 1.1033 1.117 0.895 0.555 0.013 2369 1.0130 13.25 1.0192 1.031 0.97 0.833 0.015 2364.3 1.0151 13.28 0.8853 0.893 1.12 1.111 0.017 2359.5 1.0171 13.3 0.7824 0.788 1.269 1.388 0.018 2357.2 1.0181 13.32 0.74 0.744 1.3 1.667 0.019 2354.8 1.0191 13.33 0.7016 0.705 1.425 1.944 0.02 2352.5 1.0201 13.34 0.667 0.67 1.499 2.222 0.021 2350.1 1.0212 13.36 0.6362 0.638 1.572 2.5 0.023 2345.4 1.0232 13.38 0.5817 0.583 1.719 2.778 0.024 2343.1 1.0242 13.4 0.5583 0.558 1.791 3.056 0.025 2340.7 1.0253 13.41 0.5364 0.536 1.868 3.333 0.026 2338.4 1.0263 13.42 0.5162 0.515 1.937 3.611 0.028 2333.7 1.0283 13.45 0.4804 0.479 2.082 3.889 0.029 2331.4 1.0294 13.46 0.4641 0.462 2.155 4.167 0.03 2329.1 1.0304 13.48 0.4493 0.447 2.226 4.444 0.03 2329.1 1.0304 13.48 0.4493 0.447 2.226 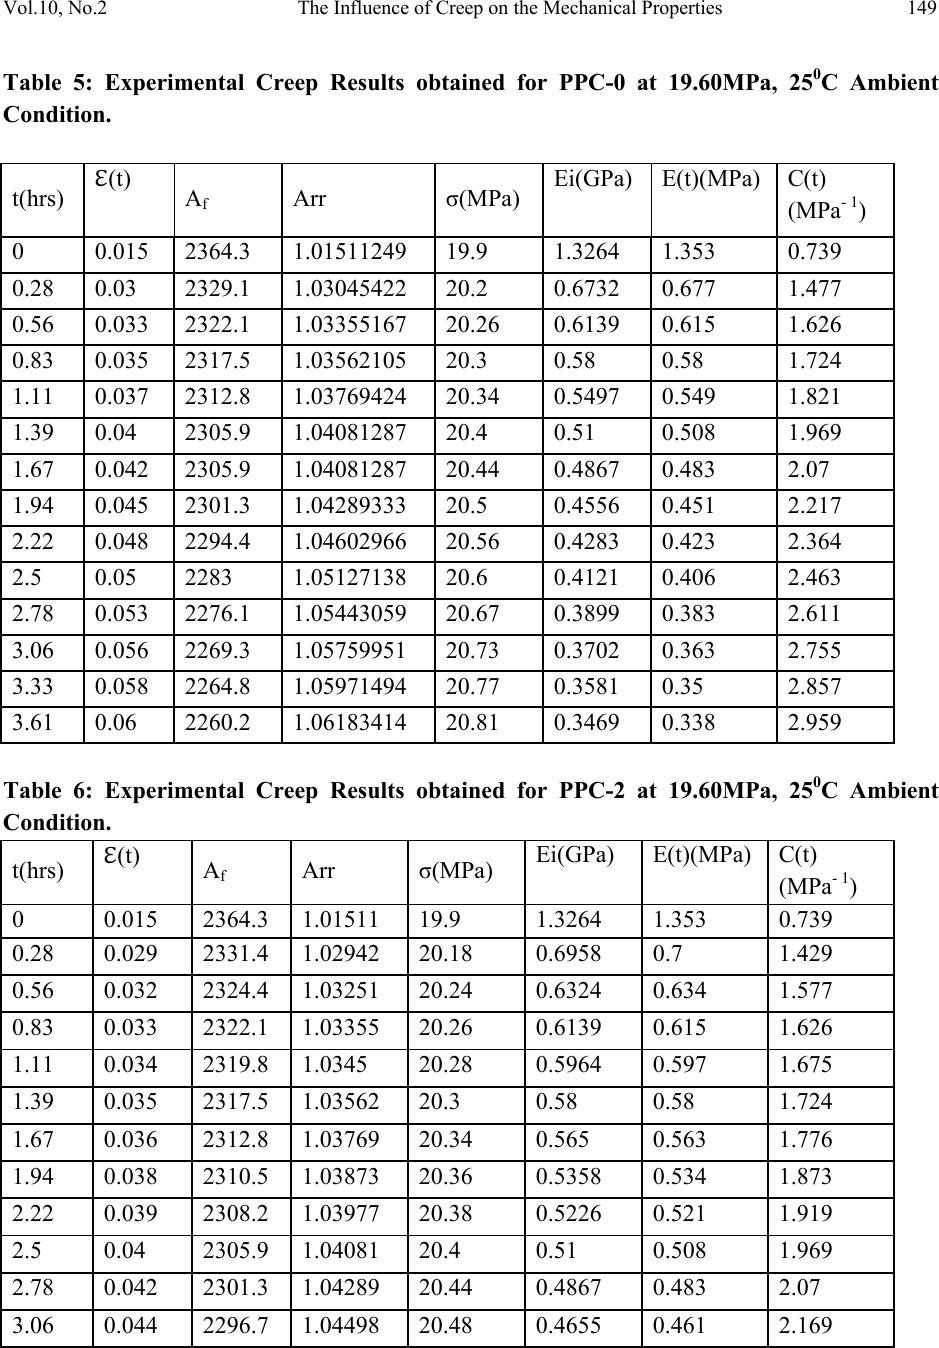 Vol.10, No.2 The Influence of Creep on the Mechanical Properties 149 Table 5: Experimental Creep Results obtained for PPC-0 at 19.60MPa, 250C Ambient Condition. t(hrs) (t) Af Arr σ(MPa) Ei(GPa) E(t)(MPa) C(t) (MPa- 1) 0 0.015 2364.3 1.01511249 19.9 1.3264 1.353 0.739 0.28 0.03 2329.1 1.03045422 20.2 0.6732 0.677 1.477 0.56 0.033 2322.1 1.03355167 20.26 0.6139 0.615 1.626 0.83 0.035 2317.5 1.03562105 20.3 0.58 0.58 1.724 1.11 0.037 2312.8 1.03769424 20.34 0.5497 0.549 1.821 1.39 0.04 2305.9 1.04081287 20.4 0.51 0.508 1.969 1.67 0.042 2305.9 1.04081287 20.44 0.4867 0.483 2.07 1.94 0.045 2301.3 1.04289333 20.5 0.4556 0.451 2.217 2.22 0.048 2294.4 1.04602966 20.56 0.4283 0.423 2.364 2.5 0.05 2283 1.05127138 20.6 0.4121 0.406 2.463 2.78 0.053 2276.1 1.05443059 20.67 0.3899 0.383 2.611 3.06 0.056 2269.3 1.05759951 20.73 0.3702 0.363 2.755 3.33 0.058 2264.8 1.05971494 20.77 0.3581 0.35 2.857 3.61 0.06 2260.2 1.06183414 20.81 0.3469 0.338 2.959 Table 6: Experimental Creep Results obtained for PPC-2 at 19.60MPa, 250C Ambient Condition. t(hrs) (t) Af Arr σ(MPa) Ei(GPa) E(t)(MPa) C(t) (MPa- 1) 0 0.015 2364.3 1.01511 19.9 1.3264 1.353 0.739 0.28 0.029 2331.4 1.02942 20.18 0.6958 0.7 1.429 0.56 0.032 2324.4 1.03251 20.24 0.6324 0.634 1.577 0.83 0.033 2322.1 1.03355 20.26 0.6139 0.615 1.626 1.11 0.034 2319.8 1.0345 20.28 0.5964 0.597 1.675 1.39 0.035 2317.5 1.03562 20.3 0.58 0.58 1.724 1.67 0.036 2312.8 1.03769 20.34 0.565 0.563 1.776 1.94 0.038 2310.5 1.03873 20.36 0.5358 0.534 1.873 2.22 0.039 2308.2 1.03977 20.38 0.5226 0.521 1.919 2.5 0.04 2305.9 1.04081 20.4 0.51 0.508 1.969 2.78 0.042 2301.3 1.04289 20.44 0.4867 0.483 2.07 3.06 0.044 2296.7 1.04498 20.48 0.4655 0.461 2.169  150 C.C. Ihueze, C.O. Mgbemena, U. Sylveste Vol.10, No.2 3.33 0.046 2292.1 1.04707 20.52 0.4461 0.441 2.268 3.61 0.05 2283 1.05127 20.6 0.4121 0.406 2.463 Table 7: Experimental Creep Results obtained for PPC-0 at 22.87MPa, 250C Ambient Condition t(hrs) (t) Af Arr σ(MPa) Ei(GPa) E(t)(MPa) C(t) (MPa- 1) 0 0.019 2354.8 1.01918185 23.31 1.2268 1.263 0.792 0.056 0.02 2352.5 1.02019996 23.33 1.1167 1.2 0.833 0.083 0.021 2350.1 1.0212201 23.36 1.1122 1.143 0.875 0.139 0.03 2329.1 1.03045422 23.57 0.7856 0.8 1.25 0.222 0.033 2322.1 1.03355167 23.64 0.7163 0.727 1.376 0.278 0.04 2305.9 1.04081287 23.8 0.5951 0.6 1.667 0.417 0.046 2296.7 1.04498213 23.9 0.5195 0.522 1.916 0.556 0.05 2283 1.05127138 24.04 0.4809 0.48 2.083 0.694 0.052 2278.4 1.05337541 24.09 0.4633 0.462 2.165 0.833 0.056 2269.3 1.05759951 24.19 0.4319 0.429 2.331 Table 8: Experimental Creep Results obtained for PPC-2 at 22.87MPa, 250C Ambient Condition t(hrs) (t) Af Arr σ(MPa) Ei(GPa) E(t)(MPa) C(t) (MPa- 1) 0 0.019 2354.8 1.01918185 23.31 1.2268 1.263 0.792 0.056 0.02 2352.5 1.02019996 23.33 1.1167 1.2 0.833 0.083 0.021 2350.1 1.0212201 23.36 1.1122 1.091 0.917 0.139 0.03 2329.1 1.03045422 23.57 0.7856 0.615 1.626 0.222 0.033 2322.1 1.03355167 23.64 0.7163 0.571 1.751 0.278 0.04 2305.9 1.04081287 23.8 0.5951 0.522 1.916 0.417 0.046 2296.7 1.04498213 23.9 0.5195 0.5 2 0.556 0.05 2283 1.05127138 24.04 0.4809 0.48 2.083 0.694 0.052 2278.4 1.05337541 24.09 0.4633 0.462 2.165 0.833 0.056 2269.3 1.05759951 24.19 0.4319 0.429 2.331 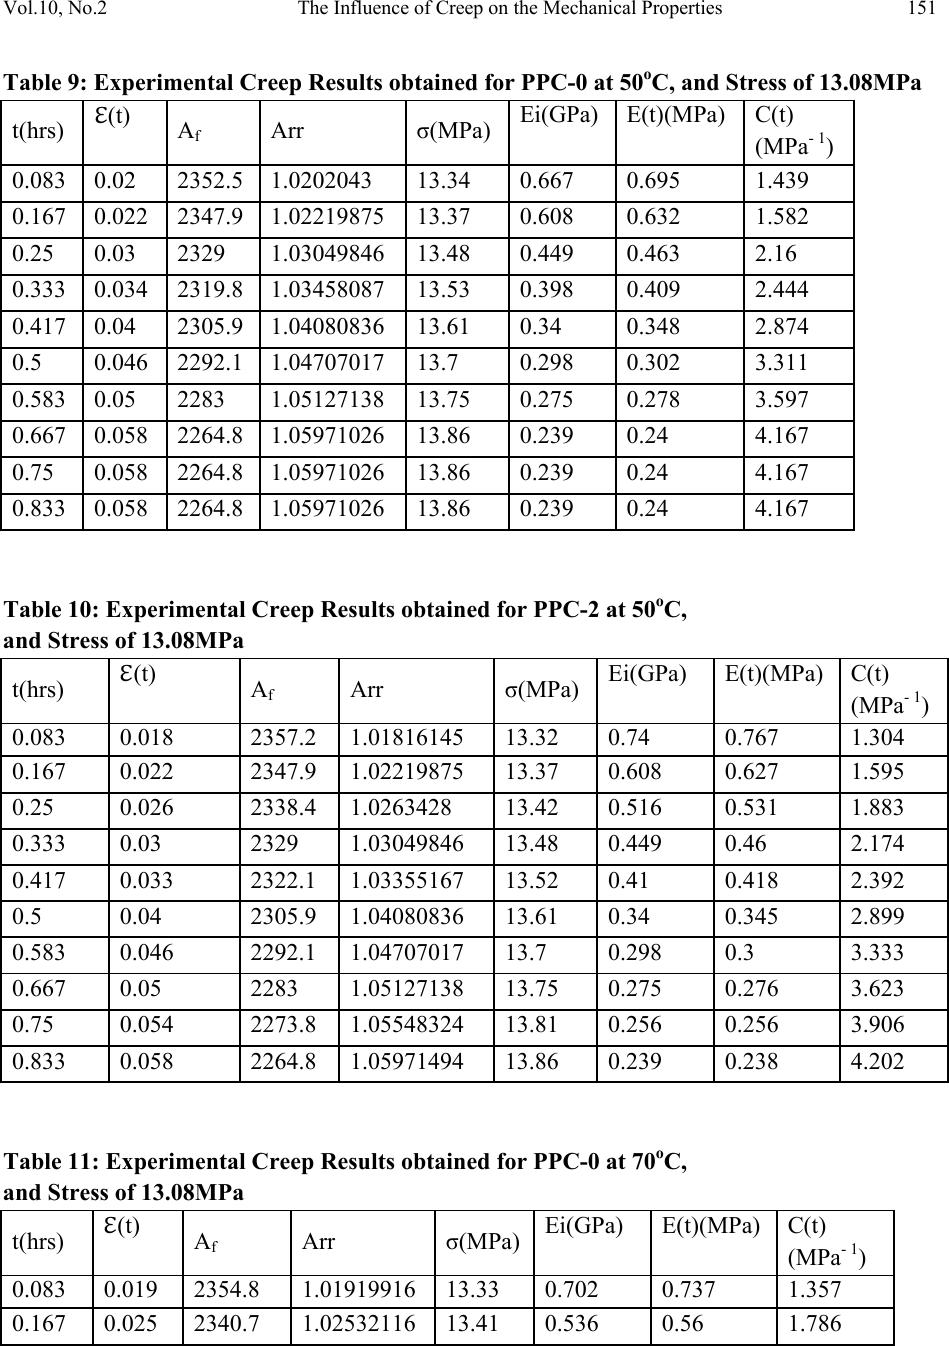 Vol.10, No.2 The Influence of Creep on the Mechanical Properties 151 Table 9: Experimental Creep Results obtained for PPC-0 at 50oC, and Stress of 13.08MPa t(hrs) (t) Af Arr σ(MPa) Ei(GPa) E(t)(MPa) C(t) (MPa- 1) 0.083 0.02 2352.5 1.0202043 13.34 0.667 0.695 1.439 0.167 0.022 2347.9 1.02219875 13.37 0.608 0.632 1.582 0.25 0.03 2329 1.03049846 13.48 0.449 0.463 2.16 0.333 0.034 2319.8 1.03458087 13.53 0.398 0.409 2.444 0.417 0.04 2305.9 1.04080836 13.61 0.34 0.348 2.874 0.5 0.046 2292.1 1.04707017 13.7 0.298 0.302 3.311 0.583 0.05 2283 1.05127138 13.75 0.275 0.278 3.597 0.667 0.058 2264.8 1.05971026 13.86 0.239 0.24 4.167 0.75 0.058 2264.8 1.05971026 13.86 0.239 0.24 4.167 0.833 0.058 2264.8 1.05971026 13.86 0.239 0.24 4.167 Table 10: Experimental Creep Results obtained for PPC-2 at 50oC, and Stress of 13.08MPa t(hrs) (t) Af Arr σ(MPa) Ei(GPa) E(t)(MPa) C(t) (MPa- 1) 0.083 0.018 2357.2 1.01816145 13.32 0.74 0.767 1.304 0.167 0.022 2347.9 1.02219875 13.37 0.608 0.627 1.595 0.25 0.026 2338.4 1.0263428 13.42 0.516 0.531 1.883 0.333 0.03 2329 1.03049846 13.48 0.449 0.46 2.174 0.417 0.033 2322.1 1.03355167 13.52 0.41 0.418 2.392 0.5 0.04 2305.9 1.04080836 13.61 0.34 0.345 2.899 0.583 0.046 2292.1 1.04707017 13.7 0.298 0.3 3.333 0.667 0.05 2283 1.05127138 13.75 0.275 0.276 3.623 0.75 0.054 2273.8 1.05548324 13.81 0.256 0.256 3.906 0.833 0.058 2264.8 1.05971494 13.86 0.239 0.238 4.202 Table 11: Experimental Creep Results obtained for PPC-0 at 70oC, and Stress of 13.08MPa t(hrs) (t) Af Arr σ(MPa) Ei(GPa) E(t)(MPa) C(t) (MPa- 1) 0.083 0.019 2354.8 1.01919916 13.33 0.702 0.737 1.357 0.167 0.025 2340.7 1.02532116 13.41 0.536 0.56 1.786 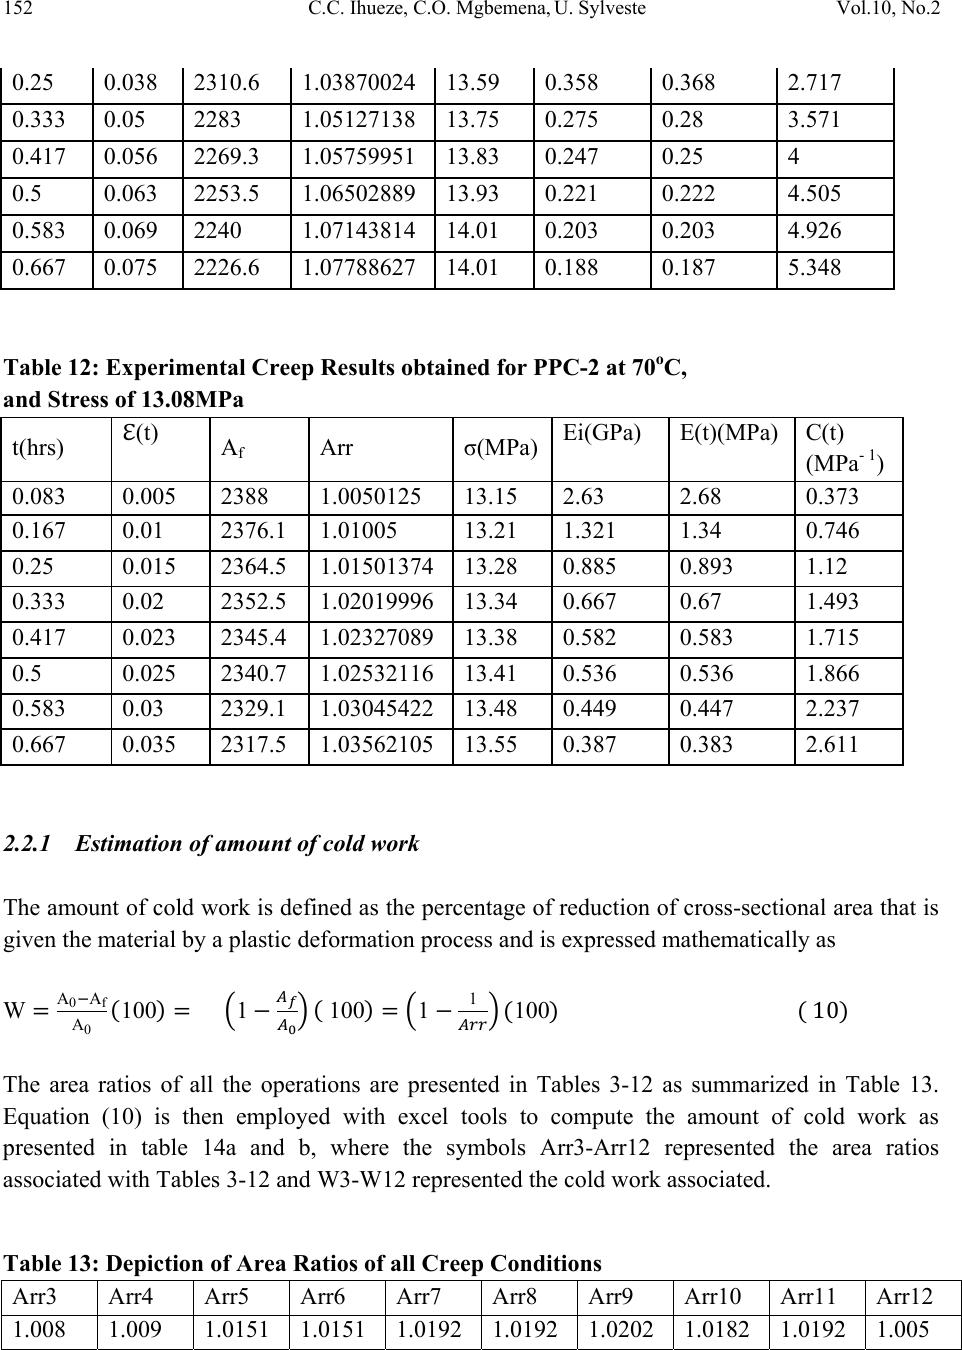 152 C.C. Ihueze, C.O. Mgbemena, U. Sylveste Vol.10, No.2 0.25 0.038 2310.6 1.03870024 13.59 0.358 0.368 2.717 0.333 0.05 2283 1.05127138 13.75 0.275 0.28 3.571 0.417 0.056 2269.3 1.05759951 13.83 0.247 0.25 4 0.5 0.063 2253.5 1.06502889 13.93 0.221 0.222 4.505 0.583 0.069 2240 1.07143814 14.01 0.203 0.203 4.926 0.667 0.075 2226.6 1.07788627 14.01 0.188 0.187 5.348 Table 12: Experimental Creep Results obtained for PPC-2 at 70oC, and Stress of 13.08MPa t(hrs) (t) Af Arr σ(MPa) Ei(GPa) E(t)(MPa) C(t) (MPa- 1) 0.083 0.005 2388 1.0050125 13.15 2.63 2.68 0.373 0.167 0.01 2376.1 1.01005 13.21 1.321 1.34 0.746 0.25 0.015 2364.5 1.01501374 13.28 0.885 0.893 1.12 0.333 0.02 2352.5 1.02019996 13.34 0.667 0.67 1.493 0.417 0.023 2345.4 1.02327089 13.38 0.582 0.583 1.715 0.5 0.025 2340.7 1.02532116 13.41 0.536 0.536 1.866 0.583 0.03 2329.1 1.03045422 13.48 0.449 0.447 2.237 0.667 0.035 2317.5 1.03562105 13.55 0.387 0.383 2.611 2.2.1 Estimation of amount of cold work The amount of cold work is defined as the percentage of reduction of cross-sectional area that is given the material by a plastic deformation process and is expressed mathematically as WA0Af A01001 10011 100 The area ratios of all the operations are presented in Tables 3-12 as summarized in Table 13. Equation (10) is then employed with excel tools to compute the amount of cold work as presented in table 14a and b, where the symbols Arr3-Arr12 represented the area ratios associated with Tables 3-12 and W3-W12 represented the cold work associated. Table 13: Depiction of Area Ratios of all Creep Conditions Arr3 Arr4 Arr5 Arr6 Arr7 Arr8 Arr9 Arr10 Arr11 Arr12 1.008 1.009 1.0151 1.0151 1.0192 1.0192 1.0202 1.0182 1.0192 1.005 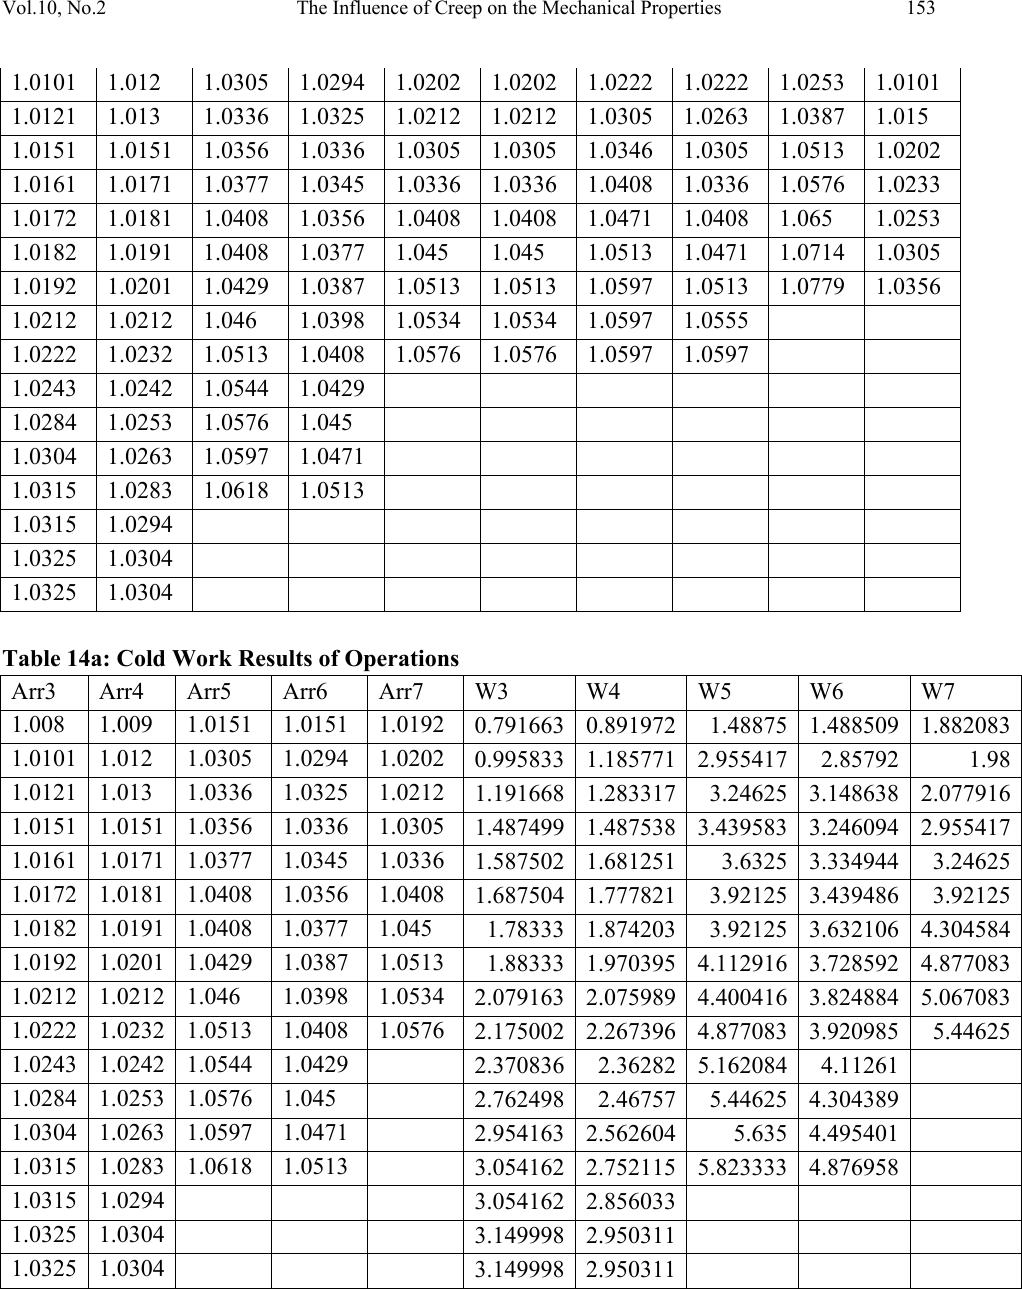 Vol.10, No.2 The Influence of Creep on the Mechanical Properties 153 1.0101 1.012 1.0305 1.0294 1.0202 1.0202 1.0222 1.0222 1.0253 1.0101 1.0121 1.013 1.0336 1.0325 1.0212 1.0212 1.0305 1.0263 1.0387 1.015 1.0151 1.0151 1.0356 1.0336 1.0305 1.0305 1.0346 1.0305 1.0513 1.0202 1.0161 1.0171 1.0377 1.0345 1.0336 1.0336 1.0408 1.0336 1.0576 1.0233 1.0172 1.0181 1.0408 1.0356 1.0408 1.0408 1.0471 1.0408 1.065 1.0253 1.0182 1.0191 1.0408 1.0377 1.045 1.045 1.0513 1.0471 1.0714 1.0305 1.0192 1.0201 1.0429 1.0387 1.0513 1.0513 1.0597 1.0513 1.0779 1.0356 1.0212 1.0212 1.046 1.0398 1.0534 1.0534 1.0597 1.0555 1.0222 1.0232 1.0513 1.0408 1.0576 1.0576 1.0597 1.0597 1.0243 1.0242 1.0544 1.0429 1.0284 1.0253 1.0576 1.045 1.0304 1.0263 1.0597 1.0471 1.0315 1.0283 1.0618 1.0513 1.0315 1.0294 1.0325 1.0304 1.0325 1.0304 Table 14a: Cold Work Results of Operations Arr3 Arr4 Arr5 Arr6 Arr7 W3 W4 W5 W6 W7 1.008 1.009 1.0151 1.0151 1.0192 0.791663 0.8919721.48875 1.488509 1.882083 1.0101 1.012 1.0305 1.0294 1.0202 0.9958331.1857712.955417 2.857921.98 1.0121 1.013 1.0336 1.0325 1.0212 1.191668 1.2833173.24625 3.148638 2.077916 1.0151 1.0151 1.0356 1.0336 1.0305 1.487499 1.487538 3.439583 3.246094 2.955417 1.0161 1.0171 1.0377 1.0345 1.0336 1.587502 1.6812513.6325 3.3349443.24625 1.0172 1.0181 1.0408 1.0356 1.0408 1.687504 1.7778213.92125 3.4394863.92125 1.0182 1.0191 1.0408 1.0377 1.045 1.783331.8742033.92125 3.632106 4.304584 1.0192 1.0201 1.0429 1.0387 1.0513 1.88333 1.970395 4.112916 3.728592 4.877083 1.0212 1.0212 1.046 1.0398 1.0534 2.0791632.075989 4.400416 3.824884 5.067083 1.0222 1.0232 1.0513 1.0408 1.0576 2.175002 2.267396 4.877083 3.9209855.44625 1.0243 1.0242 1.0544 1.0429 2.3708362.362825.162084 4.11261 1.0284 1.0253 1.0576 1.045 2.7624982.467575.44625 4.304389 1.0304 1.0263 1.0597 1.0471 2.9541632.5626045.635 4.495401 1.0315 1.0283 1.0618 1.0513 3.0541622.7521155.823333 4.876958 1.0315 1.0294 3.0541622.856033 1.0325 1.0304 3.1499982.950311 1.0325 1.0304 3.1499982.950311 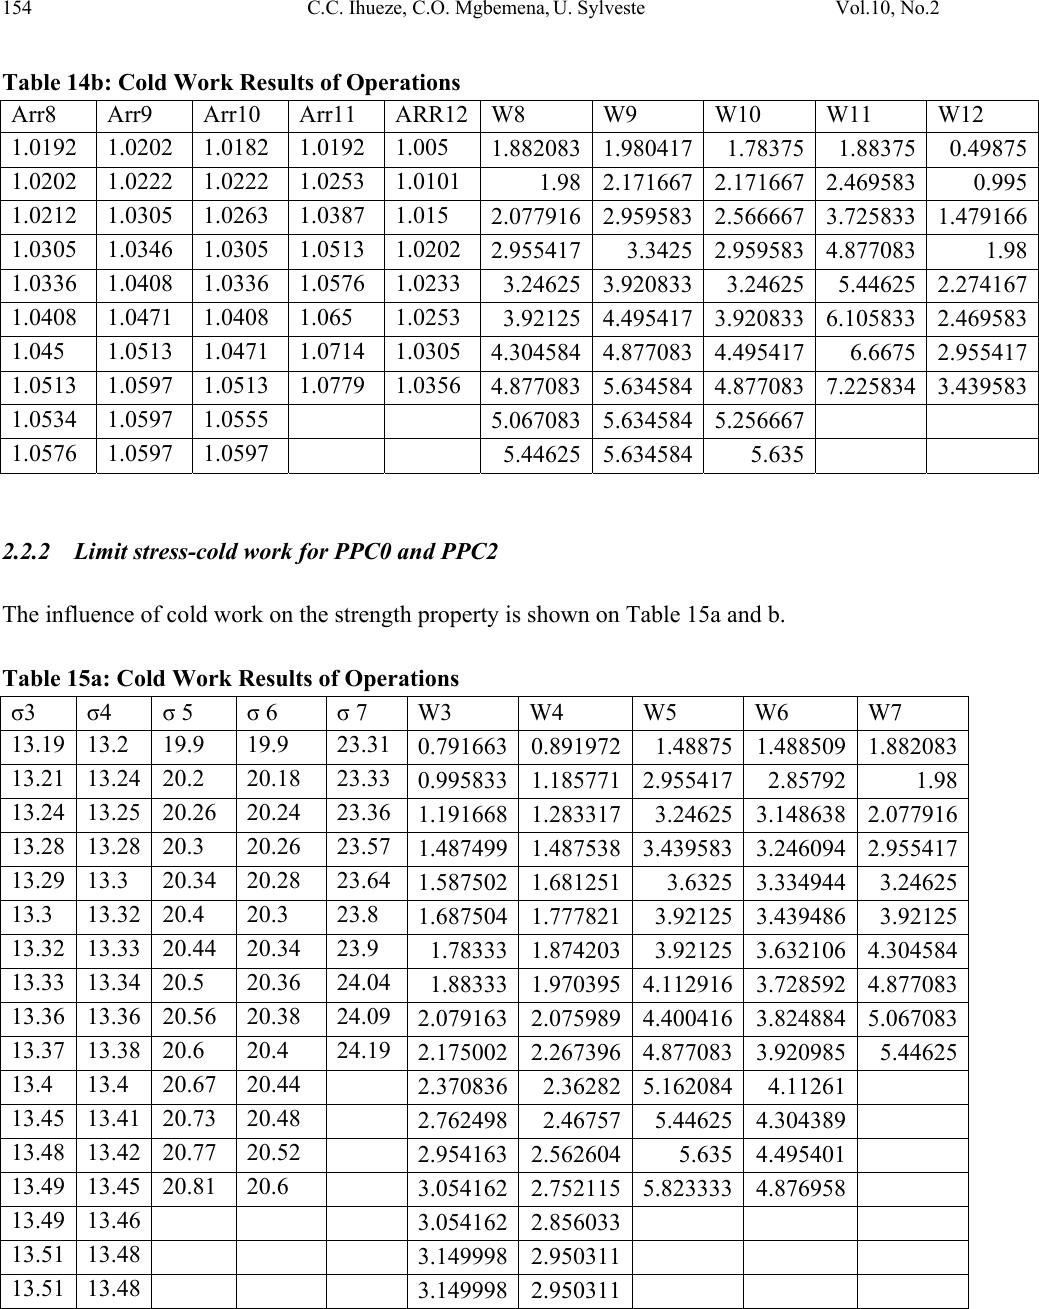 154 C.C. Ihueze, C.O. Mgbemena, U. Sylveste Vol.10, No.2 Table 14b: Cold Work Results of Operations Arr8 Arr9 Arr10 Arr11 ARR12W8 W9 W10 W11 W12 1.0192 1.0202 1.0182 1.0192 1.005 1.8820831.980417 1.78375 1.883750.49875 1.0202 1.0222 1.0222 1.0253 1.0101 1.98 2.1716672.171667 2.4695830.995 1.0212 1.0305 1.0263 1.0387 1.015 2.077916 2.959583 2.566667 3.725833 1.479166 1.0305 1.0346 1.0305 1.0513 1.0202 2.9554173.3425 2.959583 4.8770831.98 1.0336 1.0408 1.0336 1.0576 1.0233 3.246253.920833 3.24625 5.446252.274167 1.0408 1.0471 1.0408 1.065 1.0253 3.92125 4.495417 3.920833 6.105833 2.469583 1.045 1.0513 1.0471 1.0714 1.0305 4.3045844.8770834.495417 6.66752.955417 1.0513 1.0597 1.0513 1.0779 1.0356 4.877083 5.634584 4.877083 7.225834 3.439583 1.0534 1.0597 1.0555 5.0670835.6345845.256667 1.0576 1.0597 1.0597 5.446255.6345845.635 2.2.2 Limit stress-cold work for PPC0 and PPC2 The influence of cold work on the strength property is shown on Table 15a and b. Table 15a: Cold Work Results of Operations σ3 σ4 σ 5 σ 6 σ 7 W3 W4 W5 W6 W7 13.19 13.2 19.9 19.9 23.31 0.791663 0.8919721.48875 1.4885091.882083 13.21 13.24 20.2 20.18 23.33 0.9958331.1857712.955417 2.857921.98 13.24 13.25 20.26 20.24 23.36 1.191668 1.2833173.24625 3.1486382.077916 13.28 13.28 20.3 20.26 23.57 1.487499 1.4875383.439583 3.2460942.955417 13.29 13.3 20.34 20.28 23.64 1.587502 1.6812513.6325 3.3349443.24625 13.3 13.32 20.4 20.3 23.8 1.687504 1.7778213.92125 3.4394863.92125 13.32 13.33 20.44 20.34 23.9 1.78333 1.8742033.92125 3.6321064.304584 13.33 13.34 20.5 20.36 24.04 1.88333 1.9703954.112916 3.7285924.877083 13.36 13.36 20.56 20.38 24.09 2.079163 2.0759894.400416 3.8248845.067083 13.37 13.38 20.6 20.4 24.19 2.175002 2.2673964.877083 3.9209855.44625 13.4 13.4 20.67 20.44 2.3708362.362825.162084 4.11261 13.45 13.41 20.73 20.48 2.7624982.467575.44625 4.304389 13.48 13.42 20.77 20.52 2.954163 2.5626045.635 4.495401 13.49 13.45 20.81 20.6 3.054162 2.7521155.823333 4.876958 13.49 13.46 3.0541622.856033 13.51 13.48 3.1499982.950311 13.51 13.48 3.1499982.950311  Vol.10, No.2 The Influence of Creep on the Mechanical Properties 155 Table 15b: Cold Work Results of Operations σ 8 σ 9 σ 10 σ 11 σ 12 W8 W9 W10 W11 W12 23.31 13.34 13.32 13.33 13.15 1.8820831.9804171.78375 1.883750.49875 23.33 13.37 13.37 13.41 13.21 1.98 2.1716672.171667 2.4695830.995 23.36 13.48 13.42 13.59 13.28 2.077916 2.9595832.566667 3.7258331.479166 23.57 13.53 13.48 13.75 13.34 2.9554173.34252.959583 4.8770831.98 23.64 13.61 13.52 13.83 13.38 3.246253.9208333.24625 5.446252.274167 23.8 13.7 13.61 13.93 13.41 3.92125 4.4954173.920833 6.1058332.469583 23.9 13.75 13.7 14.01 13.48 4.3045844.8770834.495417 6.66752.955417 24.04 13.86 13.75 14.01 13.55 4.877083 5.6345844.877083 7.2258343.439583 24.09 13.86 13.81 5.0670835.6345845.256667 24.19 13.86 13.86 5.446255.6345845.635 3. ESTIMATION OF SLIP IN POLYPROPYLENE MATERIALS Slip will occur in polypropylene component when the yield strength is exceeded. The yield strength of polypropylene is in the range 12-43MPa [13]. Tables 3-12 showing creep stresses indicate the occurrence of lip due to low yield strength associated with creep. The shear strength of material is estimated with the classical relation where G is the shear modulus estimated with the relation So that by using the values E= 2GPa and ν = 0.34 the shear modulus and shear strength is evaluated for PPCO as 750MPa and 120MPa respectively and for PPC2 are 920MPa and 150MPa respectively. 4. DISCUSSION OF RESULTS Table 1 and 2 show that the new PP (PPC2) has elastic modulus of 2-2.46GPa at optimum volume fraction of 0.10(10%) while table 2 distinctively show that neat PP(PPC0) has elastic modulus of about 2GPa at optimum volume fraction of 0.10. Table 3 and 4 at 13.08MPa applied static stress and ambient condition 25OC show the presence of primary creep stage, creep limit 13.51MPa, elastic modulus 1.35GPa at 0.01 natural strain, modulus at fracture 0.422GPa and fracture strain of 0.032 for neat PP (PPC0) and for PPC2 show  156 C.C. Ihueze, C.O. Mgbemena, U. Sylveste Vol.10, No.2 the presence of primary creep stage, creep limit 13.48MPa, elastic modulus 1.49GPa at 0.01 natural strain, modulus at fracture 0.447GPa and fracture strain of 0.03. Table 5 and 6 at 19.60MPa applied static stress and ambient condition 25OC show the presence of primary creep stage with elastic strain 0.015 and modulus 1.353GPa, creep limit 20.81MPa, modulus at fracture 0.3338GPa and fracture strain of 0.06 for neat PP (PPC0) and for PPC2 show the presence of primary creep stage with elastic strain 0.015 and modulus 1.353GPa, creep limit 20.06MPa, modulus at fracture 0.406GPa and fracture strain of 0.05. Table 7 and 8 at 22.88MPa applied static stress and ambient condition 25OC show the presence of primary creep stage with elastic strain 0.015 and modulus 1.263GPa, creep limit 24.19MPa, modulus at fracture 0.429GPa and fracture strain of 0.056 for neat PP (PPC0) and for PPC2 show the presence of primary creep stage with elastic strain 0.019 and modulus 1.263GPa, creep limit 24.19MPa, modulus at fracture 0.429GPa and fracture strain of 0.056 also. Table 9 and 10 at 13.08MPa applied static stress and ambient condition 50OC show the absence of primary creep stage and presence of creep limit 13.86MPa, modulus at fracture 0.24GPa and fracture strain of 0.06 for neat PP (PPC0) and for PPC2 show the absence of primary creep stage and presence of creep limit 13.86MPa, modulus at fracture 0.24GPa and fracture strain of 0.06 also. Table 11 and 12 at 13.08MPa applied static stress and ambient condition 70OC show the absence of primary creep stage and presence of creep limit 14.01MPa, modulus at fracture 0.187GPa and fracture strain of 0.08 for neat PP (PPC0) and for PPC2 show the absence of primary creep stage and presence of creep limit 13.55MPa, modulus at fracture 0.383GPa and fracture strain of 0.035 The tensile strength of polypropylene is in the range 19.7-80MPa [12] by classical report and by experimental results of our previous report the tensile strength is 123MPa [10]. For the new material PPC2 our previous report gave the value of tensile strength as 45MPa [10]. From tables 3-12 the values of the recorded stress limits never exceeded 24.19MPa which is below the tensile limit obtained from classical reports showing the reducing influence of creep on the strength properties of PP. Further still on tables 3-12, notice that the maximum estimated elastic creep modulus at 1% natural strain approximately never exceeded 1.49GPa as against the predictions of classical equations that gave 2.0GPa for PPCO and 2.46GPa for PPC2. Creep therefore reduces the strength and stiffness properties of polypropylene and its nanofiller composites. Tables 3-12 clearly show that as the material deforms the stiffness or modulus decrease, at low strains there is an elastic region, as temperature and applied stress increase the material becomes more flexible characterized with reduction in moduli. Plastic deformation at strains above 0.01 resulted to strain- hardening or stain-strengthening that manifested as the increasing area ratios and associated creep cold work as found in tables 3-12.  Vol.10, No.2 The Influence of Creep on the Mechanical Properties 157 The stress-strain plots of tables 3-12 are linear graphs giving the strain-strengthening equation of plastic deformation when plotted on logarithmic graph [9] as σcm m is called the strain-strengthening exponent showing that strength increases with plastic strain operation increases. Figures 2 and 3 also show that the creep limit increases with increasing amount of cold work. 13.15 13.2 13.25 13.3 13.35 13.4 13.45 13.5 13.55 0 0.5 1 1.5 2 2.5 33.5 σ3 W3 23.2 23.3 23.4 23.5 23.6 23.7 23.8 23.9 24 24.1 24.2 24.3 0123456 σ8 W8  158 C.C. Ihueze, C.O. Mgbemena, U. Sylveste Vol.10, No.2 Figure 2a, b, and c: Depiction showing stress-cold work relationship in creep analysis Table 3 and 4 established the shear strength of PPCO and PPC2 13.19MPa and 13.20MPa respectively at elastic strains of 0.008 and 0.009 while their shear moduli were estimated with equations (11,12) as 0.75GPa and 0.92GPa respectively while their shear strengths were 120MPa and 150MPa. These materials are then seen to be stronger in shear than in tension as the yield strength of this material under creep is about 13MPa compared to the classical range of 12- 43MPa) for this material[13]. The creep failure of these materials is therefore due to slip owing to mass movement of body of atoms that may form slip jog within the crystallographic plane since the yield strength of these materials was exceeded. 5. CONCLUSION This study established the mechanical properties of polypropylene and that reinforced with calcium carbonate nanofiller as a new material under various serving creep conditions. Also established was that creep process may be a strengthening process slip occurring when the material yield strength is exceeded causes creep failure of polypropylene matrix composites. Plastic deformation at strains above 0.01 resulted to strain- hardening or strain-strengthening that manifested as the increased area ratios and associated creep cold work. Also established by this study is a computational model for evaluating the elastic modulus of polypropylene matrix based material and expressed in equation (6) as φφ φ 13.3 13.4 13.5 13.6 13.7 13.8 13.9 0123456 σ9 W9  Vol.10, No.2 The Influence of Creep on the Mechanical Properties 159 Both the Halphin-Tsai and the Birintrup equations for elastic modulus of unidirectional fibre composites were confirmed to be appropriate for prediction of elastic modulus of nanofiller composites with polymer matrix. REFERENCES [1] Dieter, G.E. Engineering Design: A Material and Processing Approach, McGraw-Hill publishing, 3ed, pp.360-366, 2000. [2] Zhang, Q.X., Z.Z., Yu, X.L., Xie and Mai, Y.W. Crystallization and Impact Energy of Polypropylene/CaCO3 Nanocomposites with Nonionic Modifier, Polymer, 45, pp.5985-5994. [3] Hanim. H, Zarina, R.,Ahmad Fuad,M.Y.,Ishak.Z.A.M.,and Hassan, A . The Effect of Calcium carbonate Nano-filler on the mechanical properties and crystallization behaviour of Polypropylene, Malaysian Polymer Journal (MPJ), 2008, Vol 3, No. 12, pp. 38-49. [4] Xie X.L, Q.X. Liu, R.K.Y.Li, X.P. Zhou, Q.X. Zhang, Z. Z. Yu and Y.Mai,(2004) “Rheological and Mechanical properties of PVC/ CaCO3 Nanocomposites prepared by In-situ polymerization, Polymer, 45, p.6665-6673. [5] Di Lorenzo M. L, Enrico M. E, and Avell M. Thermal and morphological Characterization of Poly(ethylene terepthalate)/ Calcium Carbonate Nano composites, Journal of material service, 37, 2351-2358,2002. [6] Chan C.M, Wu J, Li J.X, and Cheung Y.K. Polypropylene /Calcium Carbonate Nano composites, Polymer, 43, p.2981-2992, 2000. [7] Eiras, D and Pessan, L.A. Crystallization behaviour of Polypropylene/Calcium carbonate nanocomposites, Technical paper presented on the 11th International Conference on Advanced materials at Rio de Janeiro Brazil September pp.20-25, 2009. [8] Guth E.J. Theory of Filler Reinforcement, Journal of Applied Physics, 1945, 16, pp.20 [9] Shigley, E.S and Mishchke, C. R. Mechanical Designers Work Book: Corrosion and Wear, McGraw-Hill Publishing, Tokyo, 1989, pp.16-40. [10] Ihueze,C.C. and Mgbemena, C.O,. Effects of Reinforcement Combinations of Calcium carbonate nanofiller on the Mechanical and Creep properties of polypropylene (awaiting publication in JMMCE, Ref2220504), 2010. [11] Mickell P. Groover, Fundamentals of Modern manufacturing Engineering, John Wiley and Sons Inc, USA , pp.182-184, 2007. [12] Crawford, R.J. Plastics Engineering, 3ed, BUTTERWORTH, HEINMANN, Oxford, 1998, pp.18-21, 41-52,168-180, 1998. [13] http//:en.wikipedia.org/wiki/yield. |