Paper Menu >>
Journal Menu >>
 Journal of Minerals & Materials Characterization & Engineering, Vol. 9, No.10, pp.919-928, 2010 jmmce.org Printed in the USA. All rights reserved 919 Chemical Solubilization of Coal using HF a nd C ha ra ct er ization of Products by FTIR, FT Raman, SEM and Elemental Analysis B. Manoj* and A.G. Kunjomana Department of Physics, Christ University, Bangalore, Karnataka, India 560029 Research and development Cell, Bharathiar University, Coimbatore, Tamil Nadu, India *Corresponding Author: manoj.b@christuniversity.in ABSTRACT An examination of the structural features of sub-bituminous coal samples from Godavari coal field, India were carried out by Scanning Electron Microscopy (SEM), FTIR, FT Raman, and elemental analysis. SEM micrograph analysis of virgin coal revealed the features of lithophiles like aluminium, silicates and calcium. To remove minerals and enhance the carbon content, the sample was leached with HF of different concentrations. FT Raman spectra in the range 100 to 3500 cm-1 region were obtained for coal samples. The same sample was recorded with FTIR for comparison purpose. The spectrums were found to have similar broad characteristics. Certain bands were found to be both Raman and IR active. Variation in band intensity and position was found to be sample dependent. Graphite and defect band was observed on the Raman spectrum. The absence of the features corresponding to inorganic elements in HF leached residual samples was an indication of demineralization. The CHNS analysis showed that the oxygen content decreased by 63% when treated with HF (20%) where as carbon content increased by about 29.63%. The calorific value a remarkable increase of 37% with HF (10%) leaching. In the SEM micrograph of leached sample cracks and devolatization holes were observed. Proximate analysis showed a systematic decrease in ash content from 12.87 wt% to 3.06 wt% with leaching. It was evident from the results that Hydrofluoric acid had significant effect in removing the mineral matter and oxygenated functional groups from the coal. Key words: FT Raman; SEM; FTIR; chemical leaching; elemental analysis. 1. INTRODUCTION In the study of hydrocarbons, the characterization and leaching of coal is of prime importance. The heavy minerals present in coal liberate to environment leading to pollution. This main draw back and low calorific value prevent the utilization of huge reserve of coal in an efficient way.  920 B. Manoj and A.G. Kunjomana Vol.9, No.10 Present study investigates the efficiency of hydrofluoric acid on leaching and characterization of the product by FT Raman, FTIR, SEM, ultimate and proximate analysis. Vibrational spectroscopy in particular has been widely used for the study of clay mineral structure for a very long time [1-2]. It was found that definitive analysis of the IR spectra enabled structural analysis to take place. The use of FT Raman spectroscopy offers the advantages of reduced fluorescence, improved signal to noise by co adding of scans and the longer wavelength of light reduces sample degradation. It also helps us to study about the IR inactive functional group. The use of Scanning Electron Microscopy (SEM) and FTIR has many current and potential applications for coal and mineral processing industries. It is used to investigate the formation and deposition of unwanted ash by- products and in analyzing substances of environmental concern. 2. EXPERIMENTAL TECHNIQUES 2.1 Extraction Procedure Five grams portion of the coal sample under study was extracted separately with HF of concentrations 30%, 20% and 10%. The specified amount of coal was slurried in 50 ml of extracting solution in a beaker and stirred for 60 minutes at 30oC. After being treated for the specified time, the slurry was allowed to settle down and then precipitate was removed. The slurry was filtered using filter paper to remove the capture solution and later washed in a column of distilled water for a day and filtered again. The filtrates were dried at of 80oC and allowed to cool slowly in a dessicator. Ahead of Raman and infrared spectroscopic analysis, samples were analysed using SEM techniques. Ultimate and proximate analysis of the sample was conducted and recorded in table.1 2.2 Elemental & Proximate Analysis Elemental analysis was carried out using Vario EL III CHNS analyzer. The analysis was able to determine CHNS on dried samples. Oxygen content was obtained subtracting the total weight of Carbon, Hydrogen, Nitrogen and Sulphur from the total. Proximate analysis was conducted using a muffle furnace by standard procedure. 2.3 Infrared and Raman Spectroscopy The FTIR spectrum was recorded by using Shimadzu FTIR -8400 spectrometer in the region 3500 - 500 cm-1. This spectrometer had the resolution of 4 cm-1. To obtain consistent records the FT-IR spectra was recorded in 20 scan mode. The Raman spectra were obtained using a Bruker RFS 100/S spectrometer equipped with a Raman accessory. This comprised a Spectron Laser 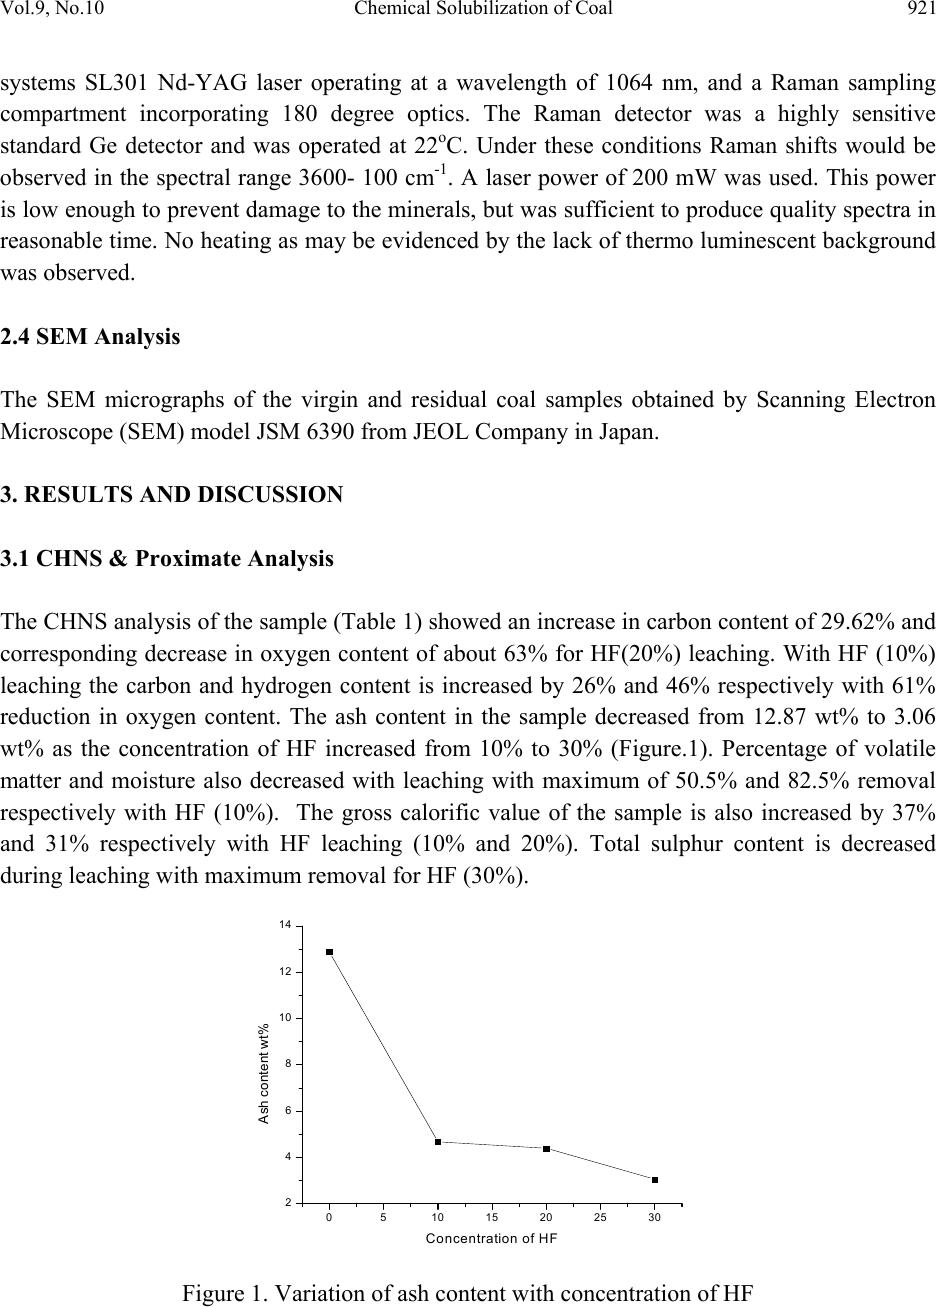 Vol.9, No.10 Chemical Solubilization of Coal 921 systems SL301 Nd-YAG laser operating at a wavelength of 1064 nm, and a Raman sampling compartment incorporating 180 degree optics. The Raman detector was a highly sensitive standard Ge detector and was operated at 22oC. Under these conditions Raman shifts would be observed in the spectral range 3600- 100 cm-1. A laser power of 200 mW was used. This power is low enough to prevent damage to the minerals, but was sufficient to produce quality spectra in reasonable time. No heating as may be evidenced by the lack of thermo luminescent background was observed. 2.4 SEM Analysis The SEM micrographs of the virgin and residual coal samples obtained by Scanning Electron Microscope (SEM) model JSM 6390 from JEOL Company in Japan. 3. RESULTS AND DISCUSSION 3.1 CHNS & Proximate Analysis The CHNS analysis of the sample (Table 1) showed an increase in carbon content of 29.62% and corresponding decrease in oxygen content of about 63% for HF(20%) leaching. With HF (10%) leaching the carbon and hydrogen content is increased by 26% and 46% respectively with 61% reduction in oxygen content. The ash content in the sample decreased from 12.87 wt% to 3.06 wt% as the concentration of HF increased from 10% to 30% (Figure.1). Percentage of volatile matter and moisture also decreased with leaching with maximum of 50.5% and 82.5% removal respectively with HF (10%). The gross calorific value of the sample is also increased by 37% and 31% respectively with HF leaching (10% and 20%). Total sulphur content is decreased during leaching with maximum removal for HF (30%). 0510 15 20 25 30 2 4 6 8 10 12 14 Ash content wt% Concentration of HF Figure 1. Variation of ash content with concentration of HF 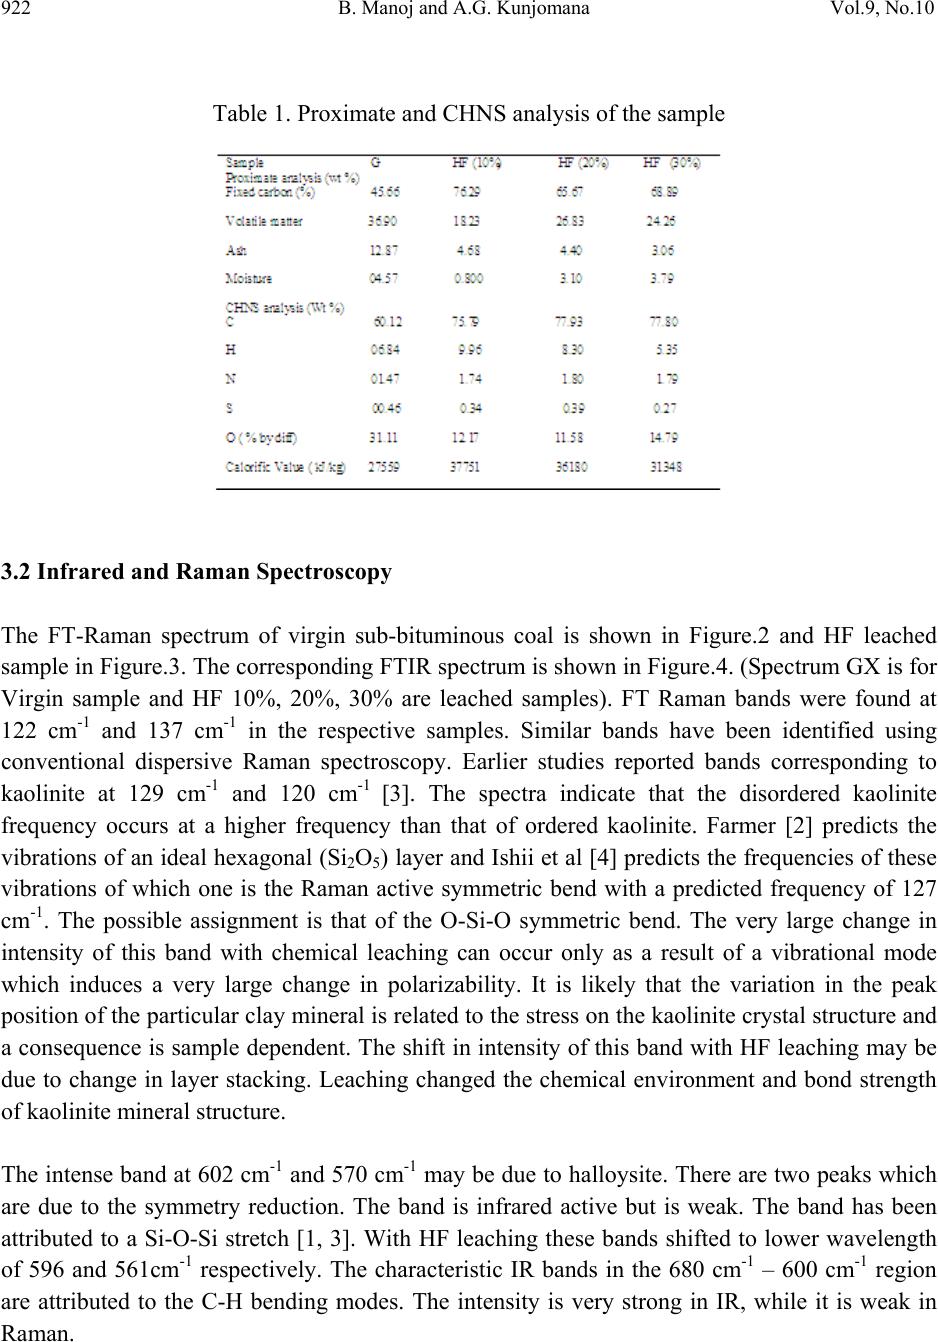 922 B. Manoj and A.G. Kunjomana Vol.9, No.10 Table 1. Proximate and CHNS analysis of the sample 3.2 Infrared and Raman Spectroscopy The FT-Raman spectrum of virgin sub-bituminous coal is shown in Figure.2 and HF leached sample in Figure.3. The corresponding FTIR spectrum is shown in Figure.4. (Spectrum GX is for Virgin sample and HF 10%, 20%, 30% are leached samples). FT Raman bands were found at 122 cm-1 and 137 cm-1 in the respective samples. Similar bands have been identified using conventional dispersive Raman spectroscopy. Earlier studies reported bands corresponding to kaolinite at 129 cm-1 and 120 cm-1 [3]. The spectra indicate that the disordered kaolinite frequency occurs at a higher frequency than that of ordered kaolinite. Farmer [2] predicts the vibrations of an ideal hexagonal (Si2O5) layer and Ishii et al [4] predicts the frequencies of these vibrations of which one is the Raman active symmetric bend with a predicted frequency of 127 cm-1. The possible assignment is that of the O-Si-O symmetric bend. The very large change in intensity of this band with chemical leaching can occur only as a result of a vibrational mode which induces a very large change in polarizability. It is likely that the variation in the peak position of the particular clay mineral is related to the stress on the kaolinite crystal structure and a consequence is sample dependent. The shift in intensity of this band with HF leaching may be due to change in layer stacking. Leaching changed the chemical environment and bond strength of kaolinite mineral structure. The intense band at 602 cm-1 and 570 cm-1 may be due to halloysite. There are two peaks which are due to the symmetry reduction. The band is infrared active but is weak. The band has been attributed to a Si-O-Si stretch [1, 3]. With HF leaching these bands shifted to lower wavelength of 596 and 561cm-1 respectively. The characteristic IR bands in the 680 cm-1 – 600 cm-1 region are attributed to the C-H bending modes. The intensity is very strong in IR, while it is weak in Raman.  Vol.9, No.10 Chemical Solubilization of Coal 923 The intense infrared bands at 1014 cm-1, 1036 cm-1 and 1108 cm-1 are attributed to silicate minerals are observable as small three peaks [5-6]. These peaks disappeared or decreased its intensity when treated with HF. This confirms demineralization of silicate minerals with HF. The Raman spectra give less information in the 900 cm-1 to 1200 cm-1 of the spectrum and the peaks are of very low intensity. This is due to the fact that Raman depends on the changes in the polarizability of the bonds and consequently is applicable to symmetric vibrations and vibrations that involve atoms of similar size; infrared on the other hand is a function of the change in bond dipole and thus is more useful for looking at asymmetric vibrations and vibrations that involve atoms of different sizes [7]. The C-C stretching bands (1161-758 cm-1) are weak in IR and not simple characteristic frequencies in Raman. The identification of these vibrational bands is more difficult because other types of C-C stretching vibrations also occur in the same region and can interact with each other. The weak band at 3243 cm-1 and 3213 cm-1 observed in sub bituminous coal sample is due to the -OH stretching of coordinated water. Further with leaching the band is shifted to lower wavelength of 3136cm-1. This band is not active in the IR spectrum. Manoj et al (8) assigned the bands at 1580 cm-1 to graphite structure and band at 1350 cm-1 to defect band on earlier studies. Presence of D-band was an indication of condensed benzene rings in amorphous carbon and is stronger with HF leaching. There are many small Raman absorptions in the region 1500 cm-1 to 1800 cm-1. The strong, highly polarized nature of this vibrational mode makes it a very useful Raman band. This may be due to C=O ketone group and carboxylic group. Much change in Raman absorption is not observed in leached sample. This region of the spectrum is sample independent. In the IR spectrum strong absorption at 1600 cm-1 is observed. With HF leaching IR absorption becomes stronger in all the leached samples. Nishide et al [9] observed strong Raman bands in the region 2000-2200 cm-1 in single wall carbon nano tubes and identified as due to axial- stretching fundamentals of the linear carbon molecules. The band at 2100-2300 cm-1 is moderate in virgin and leached samples. This is attributed to C≡C bond as well as combination of band arising from 1400 cm-1 and 800 cm-1. With HF leaching there is no major change in intensity is observed for this band. This band is absent in the infrared spectra. The asymmetric and symmetric CH3 bending occurs at 1470-1430 cm-1. The intensity of asymmetric bend near the 1460 cm-1 is medium in IR and weak in Raman. The asymmetric and symmetric CH2 stretching appears strongly at about 2926 cm-1 and 2853 cm-1 in IR but is weak in Raman. The four bending vibrations of CH2 groups are scissoring, rocking, wagging, and twisting. The scissoring mode of the CH2 group gives rise to a characteristic weak band near 1465 cm-1 in IR and Raman. This band overlaps with CH3 asymmetrical bending. This band  924 B. Manoj and A.G. Kunjomana Vol.9, No.10 normally appears in low rank coals. Manoj et al earlier reported this in the case of sub- bituminous coal [10-11]. With HF leaching this band disappears in both IR and Raman spectrum. This confirms that demineralization with HF increased the quality of coal by removing lignin content. Figure 2. FT Raman spectrum of virgin sample Figure 3. FT Raman spectrum of HF leached sample  Vol.9, No.10 Chemical Solubilization of Coal 925 3500 3000 2500 2000 1500 1000500 0 10 20 30 40 50 60 70 80 90 100 GX HF 20% HF 10% HF 30% Transmittance % wavenmber cm-1 Figure 4. FTIR spectrum of virgin and HF leached sample. 3.3 SEM Analysis of Sample The SEM micrographs of the virgin and HF leached sample were provided in Figures.5-6. Figure.5 represents the SEM image of the virgin coal sample. A bulk microstructure composed of homogeneously distributed network of small crystallites showed the presence of minerals. In the matrix, luminous as well as non luminous features could be seen. These features indicate the presence of minerals distributed in the organic matrix. Many fissures, cleats, cracks and veins were also observed. The bright luminosity was due to the presence of aluminium,potassium or sodium. The dark luminosity was mainly due to the presence of chalcophiles [6, 10-11]. Etiched pits, layers, some islands and hills & valleys could also be seen randomly distributed throughoutt the micrograph.These might haveresulted from the calcinations of dolomite and calcites or their assemblages due to thermal shock during metamorphism. It was inferred that the coal under study contains large proportins of silica, calcium carbonates ,dolomite and some proportions of elements such as aluminium, potassium and sulphur. With HF leaching (Figure.6) the surface underwent a drastic change. Cracks and devolatization holes observed on the surface confirms demineralization. The size of the mineral grains is reduced. With HF(10%) leaching all the minerals were removed and only trace amount of sulphur content was present in the demineralized coal. These findings are already reported by manoj et al. [10] in the sub-bituminous coal.  926 B. Manoj and A.G. Kunjomana Vol.9, No.10 Figure 5. SEM micrograph of Virgin coal sample. Figure 6. SEM micrograph of HF leached coal sample.  Vol.9, No.10 Chemical Solubilization of Coal 927 4. CONCLUSIONS It is found that the kaolinite mineral band at 122 cm-1 is sample dependent. This band is shifted to higher wave number with HF leaching. It is found that the silicate mineral bands are IR active but Raman inactive. With HF leaching these bands decreased its intensity. The C=C and C-C stretching bands are active in IR but weak in Raman spectra. Presence of graphite and defect bands are observed in the coal. The C≡C band is IR inactive but present in Raman spectrum. The asymmetric and symmetric bending bands of methylene groups disappeared with HF leaching which in turn increases the quality of coal. The ultimate analysis of the sample showed an increase of 29.63% in carbon content 37% in calorific value with HF leaching. Correspondingly the sample showed a decrease in oxygen content of about 63%. Proximate analysis revealed a systematic reduction in ash content with HF leaching with least value of 3.06% for HF (30%). The SEM micrograph showed the presence of mineral grains on the surface of virgin sample and the leached sample shows devolatization holes and cracks which is an indication of demineralization. It is inferred from the study that leaching with hydrofluoric acid especially 10% and 20% could increase the calorific value of the sub bituminous sample along with decrease of mineral and ash content. ACKNOWLEDGEMENT The author wishes to thank the research and development centre, Bharathiar University for allowing registering for PhD work. The author is highly indebted to Christ University, Bangalore for providing financial assistance to carry out this work. The help rendered by the school of chemical science, M.G. University, Kottayam is also gratefully acknowledged in connection with SEM, CHNS and FTIR analysis. REFERENCES [1] Lazarev, A.N., 1972. “Vibrational Spectra and Structure of Silicates”. Newyork: Plenum Press, pp.123-124 [2] Farmer,V.C. 1974. “The layer silicates: Ch 15. In Infrared spectra of Minerals”.Farmer, V.C. (Eds.), London: Mineralogical Society, pp. 331-363. [3] Frost, R.L., 1995. “Fourier Transform Raman Spectroscopy of Kaolinite, Dickite and Halloysite”. Clays and Clay Minerals, Vol.43(2), pp.191-195. [4] Ishii, M., Shimanouchi, T., Nakahira, M., 1967. “Far infrared absorption of layer silicates”. Inorg.Chim. Acta.Vol. 1, pp.387-392. [5] Oztas, N.A., Yurum, Y., 2000. “Pyrolysis of Turkish Zonguldak bituminous coal. Part 1. Effecct of mineral matter”. Fuel Vol.79, pp. 1221-1227.  928 B. Manoj and A.G. Kunjomana Vol.9, No.10 [6] Zhiheng, Wu, Karen M.Steel., 2007. “Demineralization of a UK bituminous coal using HF and ferric ions”. Fuel. Vol.86, pp. 2194-2200. [7] Frost, R.L., Bartlett, J.R., Fredericks, P.M., 1993. “Fourier Transform Raman spectra of kandite clays”. Spectro-chimica Acta. Vol. 49A, pp. 667-674. [8] Manoj.B., Kunjomana, A.G., 2010. “FT- Raman Spectoscopic study of Indian Bituminous and Sub-bituminous coal” Asian Journal of Materials Science, Vol.2(4), pp. 204-210. [9] D.Nishide., T.Wakahayashi., T. Sugai., 2007. “Raman spectroscopy of size-stretched Linear polyyne molecules C2nH2 (n = 4-6) Encapsulated in single-wall Carbon Nanotubes.” J.Phys.chem.C, Vol.111(13) pp. 5178-5183. [10] Manoj.B., Kunjomana, A.G., Chandrasekharan, K.A., 2009. “Chemical leaching of Low rank coal and its characterization using SEM/EDAX and FTIR”. Journal of Minerals & Materials Characterization & Engineering, Vol.8, No.10, pp.821-832. [11] Manoj.B., Kunjomana, A.G., Mansoor Ahmad., 2010. “Leaching of Minerals in Sub- Bituminous Indian Coal and Characterization of the products”, IUP Journal of Science and Technology, Vol.6, No.1, pp. 72-77. |