Paper Menu >>
Journal Menu >>
 Journal of Mi nerals & Materials Characterization & Engineering, Vol. 9, No.10, pp.855-865, 2010 jmmce.org Printed in the USA. All rights reserved 855 Effect of Silicon on the Corrosion Behavior of Powder-Processed Phosphoric Irons Yashwant Mehta*, Shefali Trivedi, K. Chandra, P.S. Mishra Indian Institute of Technology, Roorkee- 247667, Uttarakhand, India * Corresponding Author: yashwant.mehta@gmail.com ABSTRACT The corrosion behaviour of phosphoric irons (i.e. Fe-P alloys containing low phosphorous in the range 0.1 to 0.7 wt. % ) containing chromium with/without addition of silicon, prepared by powder forging route was studied in different environments. The various environments chosen were acidic (0.25 M H2SO4 solution of pH 0.6), neutral/marine (3.5 % NaCl solution of pH 6.8) and alkaline (0.5M Na2CO3 + 1.0 M NaHCO3 solution of pH 9.4). The corrosion studies were conducted using Tafel Extrapolation and Linear Polarization techniques. The studies compare electrolytic Armco iron with phosphoric irons. It was observed that silicon improved the resistance to corrosion in all the environments. Corrosion rates were higher in acid medium, minimal in alkaline medium and low in neutral solution. Key words: Phosphoric Iron, Corrosion, Powder Metallurgy, Forging, Ancient iron. 1. INTRODUCTION Corrosion of iron or steel is affected by exposed environment [1]. Corrosion depends on the composition of the metal/alloy and the environmental conditions. Important electrolyte variables affecting corrosion of iron are pH, concentration, fluid flow, temperature and oxidizing power of the solution [2]. The diffusion controlled oxygen reduction predominates in weak acid and neutral solutions. The corrosion rate is dependent on hydrogen ion concentration in case of acidic solutions [2]. Plain carbon steel is subjected to more severe corrosion attack in a marine environment than in urban and rural media [3]. Segregation of phosphorus to grain boundaries can strongly affect intergranular stress corrosion cracking (SCC) of irons [4] and steels [5] in carbonate/bicarbonate solutions. The deleterious effect of carbon can be attributed to the deterioration of the passive film along grain boundaries [6]. The steel containing 2.0 wt. % Si showed high corrosion resistance compared to carbon steel (Si-Mn) in the wet/dry cyclic corrosion test with chloride ions. The corrosion of Si-bearing  856 Y. Mehta, S. Trivedi, K. Chandra, P.S. Mishra Vol.9, No.10 steel could be reduced by the formation of the nano-scale complex oxide containing Si in inner rust layer to prevent the penetration of Cl ions [7]. In wet/dry cyclic corrosion test, Si– Al-bearing ultra fine grained weathering steel had excellent corrosion resistance compared with carbon steel [8]. By comparing quenched and tempered structures of 4340 and 300-M steels (in 3.5 wt % NaCl) at equivalent strength levels and at their respective optimum and commercially-used heat-treated conditions, the beneficial role of silicon addition on SCC resistance is observed in decreased Region II growth rates, with no change in K ISCC [9]. In contrast to carbon steel, ancient phosphoric irons that were used for constructing large beams and located at Konark and Puri in India, have revealed excellent atmospheric corrosion resistance in saline seashore environments for several hundred years. The 1600-year-old Delhi Iron Pillar is a living testimony to the remarkable atmospheric corrosion resistance of phosphoric irons. The presence of relatively high phosphorus 0.25 wt-% in the Pillar plays a major role in its excellent corrosion resistance by facilitating the formation of a protective passive film on the surface [10, 11]. Cr and Cu containing low alloy steel will be suitable for application in an acidic environment while alloying steel with phosphorus is not beneficial in such an environment [12]. When carbon and phosphorous both are present (in relatively large quantities), the steel becomes brittle. An attempt therefore needs to be made to understand the role of silicon in carbon-free phosphoric irons especially when chromium is present. In this paper, the corrosion behavior of three P/M phosphoric irons with 0.00 wt % C alloyed with chromium with/without silicon has been investigated in three different solutions. 2. EXPERIMENTAL For making iron–phosphorous–chromium and iron–phosphorous–chromium–silicon alloys by powder metallurgical technique, iron powder (Fe-99.99 wt%, C-0.00 wt%; −200 mesh) was mixed with iron-phosphide (C-0.00 wt %; −200 mesh), low carbon ferro-chromium (C < 0.01 wt %; −200 mesh) and ferro-silicon powder (in two alloys only; C < 0.01 wt %; −200 mesh). Whereas, iron and low carbon ferro-chromium powders were of commercial purity, iron- phosphide powder was prepared by mixing iron powders with ortho-phosphoric acid. The procedure of preparing iron-phosphide powder is described elsewhere [13]. Four powder metallurgical alloys were made in the present investigation. Their compositions are given in Table 1. The compositions of these alloys are based on the powder mixture. The process of making slabs by hot powder forging technique is explained elsewhere [14]. All the samples prepared this way were characterized in terms of density, microstructure, hardness, and tensile properties as detailed elsewhere [15].  Vol.9, No.10 Effect of Silicon on the Corrosion Behavior 857 Table 1: Composition of phosphoric irons developed in the study: Sample P (wt%) Cr (wt%) Si (wt%) Mn (wt%) Al (wt %) Ni (wt %) Cu (wt %) S (wt %) Fe 1 0.35 0.35 - - - - - - 99.3% 2 0.35 0.35 1.0 - - - - - 98.3% 3 0.7 0.7 - - - - - - 98.6% 4 0.7 0.7 1.0 - - - - - 97.6% 5(Armco) - 0.04 - 0.1 0.01 0.02 0.06 0.01 99.76% The samples (15 mm length, 15 mm width, and 2 mm thickness) for electrochemical testing were cut along the rolling direction. The surfaces were finished using SiC abrasive paper (upto 800 grit) and samples were degreased with acetone. Several samples were prepared from the starting materials for conducting reproducible experiments. One side of the samples was soldered with a copper wire. Then the soldered sample was covered with enamel exposing 1 cm2 area. The samples were mounted in a K0047 Corrosion Cell (used in ASTM standard G-5, supplied by Ametek, USA) for conducting Tafel polarization studies at a scan rate of 0.166 mV/ s. The Tafel extrapolation method (conducted as per ASTM Standard G3- 89 [16]) was utilized for determining icorr of the phosphoric irons and Armco electrolytic iron in 3.5 % NaCl having pH 6.8. Since the cathodic reaction was primarily diffusion controlled in the case of 3.5 % NaCl solution having pH 6.8, the activation-controlled anodic Tafel region was extrapolated to intersect the horizontal drawn at zero current potential to obtain the corrosion rate [17]. Corrosion rate in penetration units (like mils/year, mpy), was calculated from icorr using the following equation [18, 19]: mpy = icorr × Λ × 1/ρ × ε ……………………………….(1) Where Λ =1.2866×10⁵ (equivalents.s.mil)/(Coulombs.cm.years) icorr=the corrosion current density in Amps/cm2 (Amp=1 Coulomb/ s) ρ =density (7.86 g/cm3, for iron) ε=equivalent weight (27.56 g/ equivalent, for iron) Linear Polarization technique was used to evaluate the corrosion rates of the phosphoric irons in the following solutions: 0.25 M H2SO4 of pH 0.6, 3.5 % NaCl of pH 6.8 and 0.5M Na2CO3 + 1.0 M NaHCO3 solution of pH 9.4. A scan rate of 0.166 mV/s was used. The instantaneous corrosion rate (icorr) of the specimens was obtained from the measured linear polarization resistance (LPR) using the Stern–Geary equation [20] as follows: icorr=1 2.303 × βaβc Rp × (βa +βc) =Z Rp……………………………(2) In the above equation, βa = anodic Tafel slope, βc = cathodic Tafel slope, Rp = polarization resistance and, Z is a function of the Tafel slopes. The corrosion rate in mpy was calculated by using equation (1).  858 Y. Mehta, S. Trivedi, K. Chandra, P.S. Mishra Vol.9, No.10 The solutions were prepared using chemicals of analytical grade reagent and single distilled water. A digital pH meter (Phillips, model 9045) was used for recording pH of the solutions at room temperature. The pH meter was calibrated using three different standard pH solutions before recording pH. An EG&G PARSTAT 273A Potentiostat (Ametek, USA) and a saturated calomel reference electrode (SCE) were used in all electrochemical experiments. The open circuit potential (OCP) was stabilized for 1 hr before the start of each experiment. All the experiments were repeated three times. 3. RESULTS AND DISCUSSION The corrosion rates determined by the Tafel extrapolation method in aerated solution of 3.5 % NaCl of pH 6.8 and those determined by the linear polarization method in aerated solutions of 0.25 M H2SO4 of pH 0.6, 3.5 % NaCl of pH 6.8 and 0.5M Na2CO3 + 1.0 M NaHCO3 of pH 9.4 are discussed separately below. The cathodic reaction for the samples obtained in all the three solutions discussed above consists of a composite reaction of [21] hydrogen evolution: 2H++2e−→H2, 2H2O+2e-→H2+2OH− and oxygen reduction: 1/2O2+H2O+2e−→2OH− This is also evident from Pourbaix diagram of the Fe-H2O system. 3.1 Tafel Extrapolation Method 3.1.1 3.5 % NaCl solution (pH 6.8) The Tafel plots obtained in aerated 3.5 % NaCl solution are shown in Fig. 1. Tafel polarization curves showed diffusion controlled cathodic reaction in all cases. In this case, the diffusion-controlled oxygen reduction reaction is the dominant reaction at Ecorr [21].The Ecorr, icorr and corrosion rate (mpy) obtained from the Tafel polarization curves of samples (Fig. 1) are tabulated in Table 2. The corrosion rate was obtained from the Tafel extrapolation method matched with literature data, as discussed below. The corrosion rate of iron is 12 mpy as obtained by the Tafel extrapolation method after 24 hours of immersion in unstirred, air saturated 3.5 % NaCl solution [22]. The actual corrosion rate of plain carbon steel (AISI 1020 steel) in quiet surface water is up to 15 mpy in the first year and then decreases to 5 mpy after 1000 days [23]. The Ecorr of the samples lies between −600 mVSCE and −690 mVSCE. The corrosion rate of samples 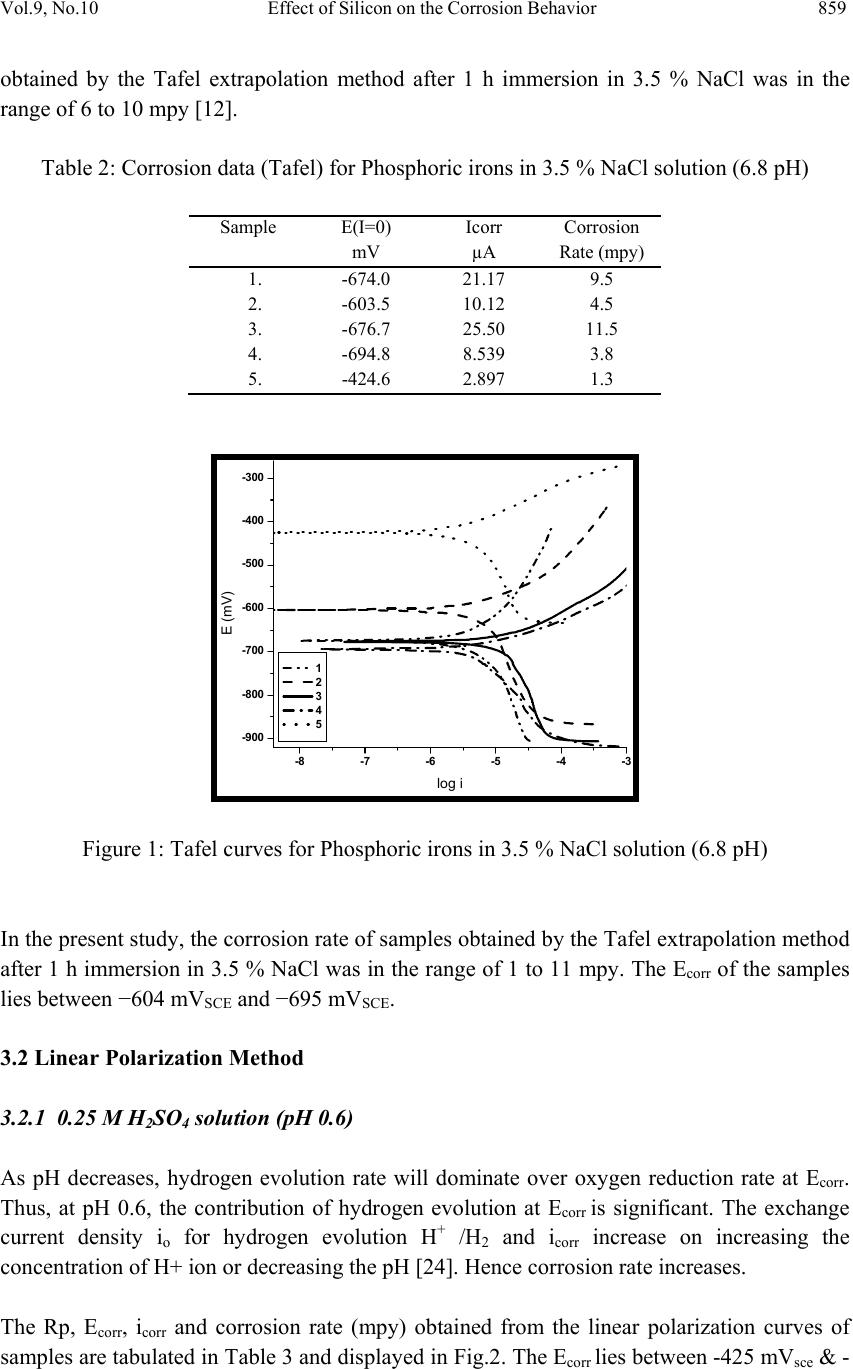 Vol.9, No.10 Effect of Silicon on the Corrosion Behavior 859 obtained by the Tafel extrapolation method after 1 h immersion in 3.5 % NaCl was in the range of 6 to 10 mpy [12]. Table 2: Corrosion data (Tafel) for Phosphoric irons in 3.5 % NaCl solution (6.8 pH) Sample E(I=0) mV Icorr µA Corrosion Rate (mpy) 1. -674.0 21.17 9.5 2. -603.5 10.12 4.5 3. -676.7 25.50 11.5 4. -694.8 8.539 3.8 5. -424.6 2.897 1.3 -900 -800 -700 -600 -500 -400 -300 -8 -7 -6 -5 -4 -3 log i E (mV) 1 2 3 4 5 Figure 1: Tafel curves for Phosphoric irons in 3.5 % NaCl solution (6.8 pH) In the present study, the corrosion rate of samples obtained by the Tafel extrapolation method after 1 h immersion in 3.5 % NaCl was in the range of 1 to 11 mpy. The Ecorr of the samples lies between −604 mVSCE and −695 mVSCE. 3.2 Linear Polarization Method 3.2.1 0.25 M H2SO4 solution (pH 0.6) As pH decreases, hydrogen evolution rate will dominate over oxygen reduction rate at Ecorr. Thus, at pH 0.6, the contribution of hydrogen evolution at Ecorr is significant. The exchange current density io for hydrogen evolution H+ /H2 and icorr increase on increasing the concentration of H+ ion or decreasing the pH [24]. Hence corrosion rate increases. The Rp, Ecor r, icorr and corrosion rate (mpy) obtained from the linear polarization curves of samples are tabulated in Table 3 and displayed in Fig.2. The Ecorr lies between -425 mVsce & - 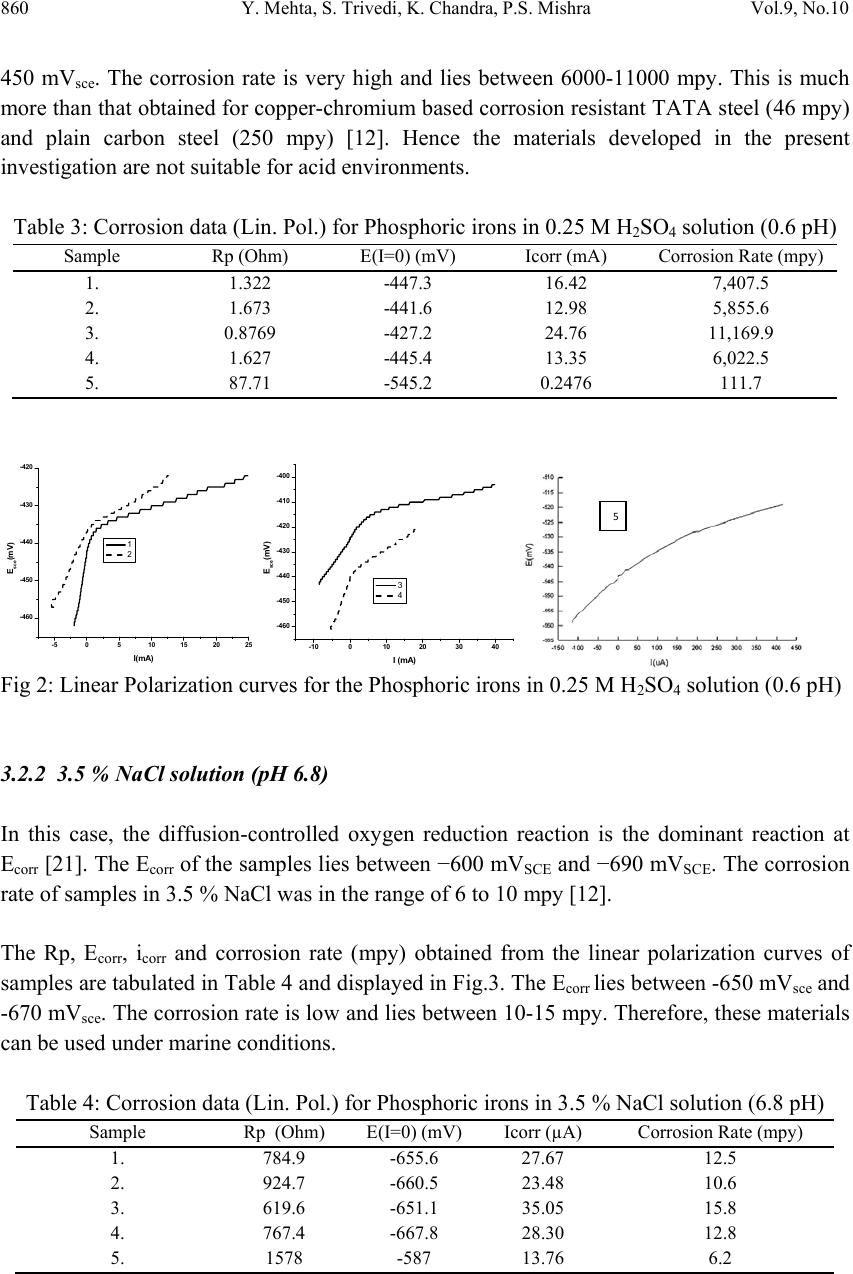 860 Y. Mehta, S. Trivedi, K. Chandra, P.S. Mishra Vol.9, No.10 450 mVsce. The corrosion rate is very high and lies between 6000-11000 mpy. This is much more than that obtained for copper-chromium based corrosion resistant TATA steel (46 mpy) and plain carbon steel (250 mpy) [12]. Hence the materials developed in the present investigation are not suitable for acid environments. Table 3: Corrosion data (Lin. Pol.) for Phosphoric irons in 0.25 M H2SO4 solution (0.6 pH) Sample Rp (Ohm) E(I=0) (mV) Icorr (mA) Corrosion Rate (mpy) 1. 1.322 -447.3 16.42 7,407.5 2. 1.673 -441.6 12.98 5,855.6 3. 0.8769 -427.2 24.76 11,169.9 4. 1.627 -445.4 13.35 6,022.5 5. 87.71 -545.2 0.2476 111.7 -460 -450 -440 -430 -420 -5051015 20 25 I(mA) E sce (mV) 1 2 -460 -450 -440 -430 -420 -410 -400 -10010 20 30 40 3 4 I (mA) Esce(mV) Fig 2: Linear Polarization curves for the Phosphoric irons in 0.25 M H2SO4 solution (0.6 pH) 3.2.2 3.5 % NaCl solution (pH 6.8) In this case, the diffusion-controlled oxygen reduction reaction is the dominant reaction at Ecorr [21]. The Ecor r of the samples lies between −600 mVSCE and −690 mVSCE. The corrosion rate of samples in 3.5 % NaCl was in the range of 6 to 10 mpy [12]. The Rp, Ecorr, icorr and corrosion rate (mpy) obtained from the linear polarization curves of samples are tabulated in Table 4 and displayed in Fig.3. The Ecorr lies between -650 mVsce and -670 mVsce. The corrosion rate is low and lies between 10-15 mpy. Therefore, these materials can be used under marine conditions. Table 4: Corrosion data (Lin. Pol.) for Phosphoric irons in 3.5 % NaCl solution (6.8 pH) Sample Rp (Ohm) E(I=0) (mV) Icorr (µA) Corrosion Rate (mpy) 1. 784.9 -655.6 27.67 12.5 2. 924.7 -660.5 23.48 10.6 3. 619.6 -651.1 35.05 15.8 4. 767.4 -667.8 28.30 12.8 5. 1578 -587 13.76 6.2 5 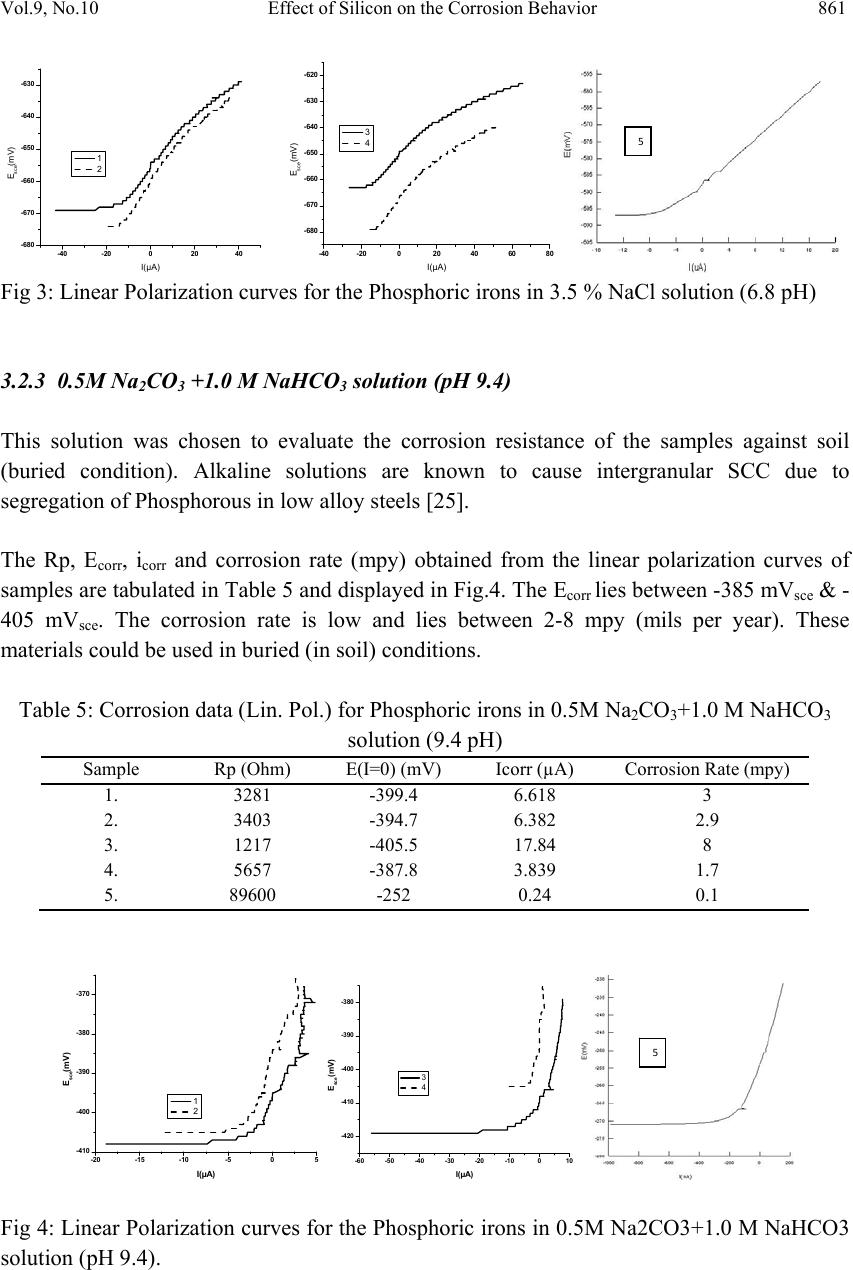 Vol.9, No.10 Effect of Silicon on the Corrosion Behavior 861 -680 -670 -660 -650 -640 -630 -40 -2002040 1 2 I(µA) E sce (mV) -680 -670 -660 -650 -640 -630 -620 -40-200 20406080 I(µA) E sce (mV) 3 4 Fig 3: Linear Polarization curves for the Phosphoric irons in 3.5 % NaCl solution (6.8 pH) 3.2.3 0.5M Na2CO3 +1.0 M NaHCO3 solution (pH 9.4) This solution was chosen to evaluate the corrosion resistance of the samples against soil (buried condition). Alkaline solutions are known to cause intergranular SCC due to segregation of Phosphorous in low alloy steels [25]. The Rp, Ecorr, icorr and corrosion rate (mpy) obtained from the linear polarization curves of samples are tabulated in Table 5 and displayed in Fig.4. The Ecorr lies between -385 mVsce & - 405 mVsce. The corrosion rate is low and lies between 2-8 mpy (mils per year). These materials could be used in buried (in soil) conditions. Table 5: Corrosion data (Lin. Pol.) for Phosphoric irons in 0.5M Na2CO3+1.0 M NaHCO3 solution (9.4 pH) Sample Rp (Ohm) E(I=0) (mV) Icorr (µA) Corrosion Rate (mpy) 1. 3281 -399.4 6.618 3 2. 3403 -394.7 6.382 2.9 3. 1217 -405.5 17.84 8 4. 5657 -387.8 3.839 1.7 5. 89600 -252 0.24 0.1 -410 -400 -390 -380 -370 -20 -15 -10-505 I(µA) E sce (mV) 1 2 -420 -410 -400 -390 -380 -60 -50 -40 -30 -20 -10010 I(µA) E sce (mV) 3 4 Fig 4: Linear Polarization curves for the Phosphoric irons in 0.5M Na2CO3+1.0 M NaHCO3 solution (pH 9.4). 5 5  862 Y. Mehta, S. Trivedi, K. Chandra, P.S. Mishra Vol.9, No.10 3.3 Segregation of Alloying Elements Powder metallurgical phosphoric alloys developed in the present investigation are free of any phosphorous segregation along the grain boundaries. They get distributed uniformly in the entire structure. This has been confirmed by: (i) Optical Microscope [15], (ii) Surface Morphology (SEM) and EDAX Pattern from different locations (Fig 5), (iii) Composition Image [Secondary Image] and X- Ray Mapping (Fig 6). The SEM microstructures reveal that the grains are of a single phase. There is no second phase. The pores are away from the grain boundaries which is good for the mechanical properties and corrosion resistance. The microstructures are very similar. This is because the two compositions differ from each other marginally i.e. by 1% Si. The analysis of surface morphology and EDAX pattern from different spots reveals that the elements are distributed more or less evenly in the grain interiors and at the grain boundaries. This data should not be interpreted in the absolute sense. They can be utilized for comparison purposes, at best. Cr, Si and P are ferrite stabilizers. When the mixture of powders is subjected to consolidation, employing high temperature and pressure, it will undergo phase transformation. Fe powder particles would first convert to gamma (FCC) iron and as ferrite stabilizers diffuse inside, they would gradually convert into alpha (BCC) iron as per the Fe-P phase diagram proposed by Kubaschewski [26]. In this way, transfer of all the ferrite stabilizers would proceed from Fe particle surfaces towards the interior of the particles. This has been confirmed qualitatively by EDAX analysis (Fig. 5). Fig 5: Surface morphology and EDAX pattern from different locations on samples 1, 2, 3 & 4 20µm 20 µ m 3 2 4 1 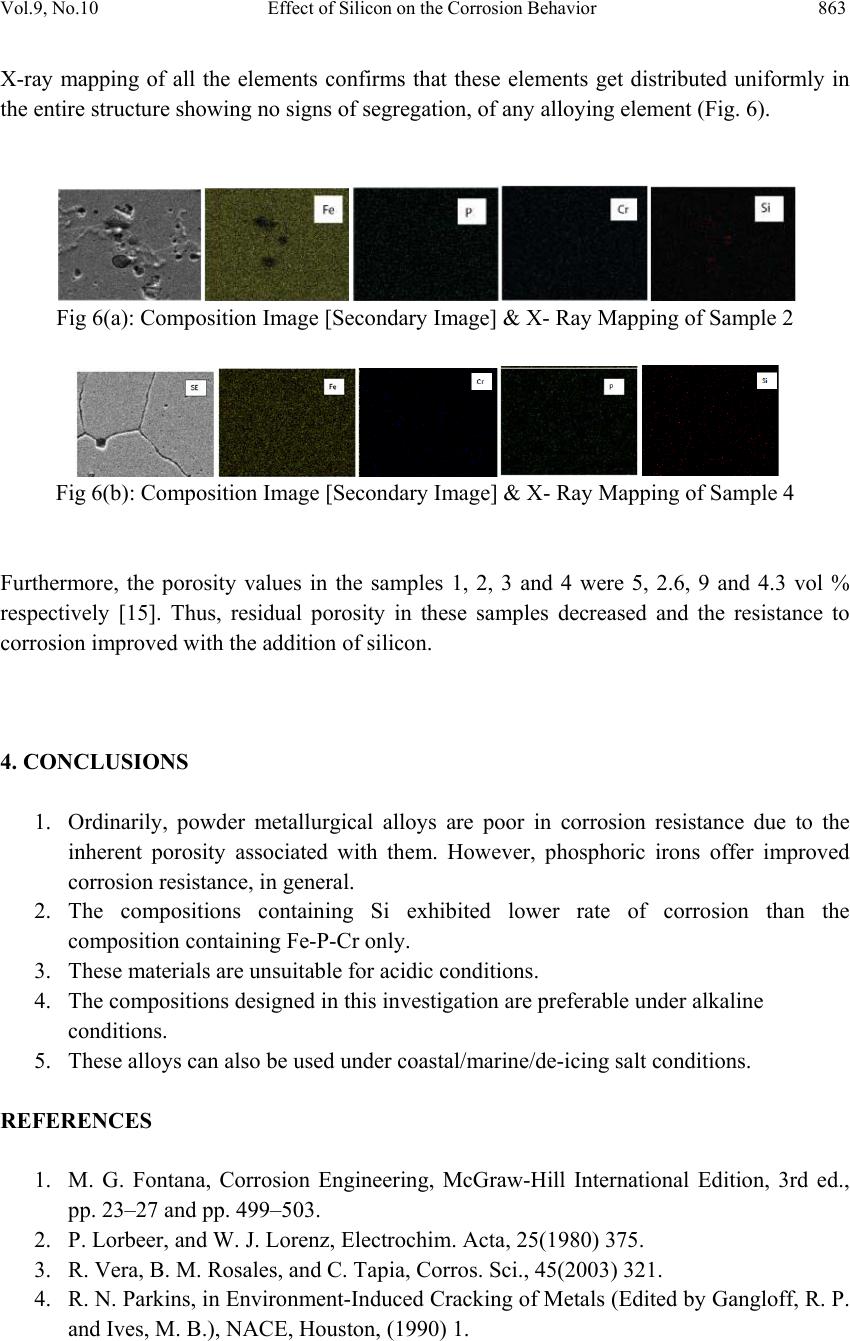 Vol.9, No.10 Effect of Silicon on the Corrosion Behavior 863 X-ray mapping of all the elements confirms that these elements get distributed uniformly in the entire structure showing no signs of segregation, of any alloying element (Fig. 6). Fig 6(a): Composition Image [Secondary Image] & X- Ray Mapping of Sample 2 Fig 6(b): Composition Image [Secondary Image] & X- Ray Mapping of Sample 4 Furthermore, the porosity values in the samples 1, 2, 3 and 4 were 5, 2.6, 9 and 4.3 vol % respectively [15]. Thus, residual porosity in these samples decreased and the resistance to corrosion improved with the addition of silicon. 4. CONCLUSIONS 1. Ordinarily, powder metallurgical alloys are poor in corrosion resistance due to the inherent porosity associated with them. However, phosphoric irons offer improved corrosion resistance, in general. 2. The compositions containing Si exhibited lower rate of corrosion than the composition containing Fe-P-Cr only. 3. These materials are unsuitable for acidic conditions. 4. The compositions designed in this investigation are preferable under alkaline conditions. 5. These alloys can also be used under coastal/marine/de-icing salt conditions. REFERENCES 1. M. G. Fontana, Corrosion Engineering, McGraw-Hill International Edition, 3rd ed., pp. 23–27 and pp. 499–503. 2. P. Lorbeer, and W. J. Lorenz, Electrochim. Acta, 25(1980) 375. 3. R. Vera, B. M. Rosales, and C. Tapia, Corros. Sci., 45(2003) 321. 4. R. N. Parkins, in Environment-Induced Cracking of Metals (Edited by Gangloff, R. P. and Ives, M. B.), NACE, Houston, (1990) 1.  864 Y. Mehta, S. Trivedi, K. Chandra, P.S. Mishra Vol.9, No.10 5. H. Stencel, H. Vehoff, and P. Neumann, in Chemistry and Physics of Fracture (Edited by Latanision, R. M. and Jones, R. H.), Martinus Nijhoff, Dordrecht (1987) 652. 6. Flis, J., Corrosion of Metals and Hydrogen-Related Phenomena (Edited by Flis J.), PWN and Elsevier, Amsterdam (1991) 50. 7. T. Nishimura, Materials Transactions, No. 6, 48 (2007) 1438. 8. T. Nishimura, Sci. Technol. Adv. Mater. 9 (2008) 1. 9. R. O. Ritchie, M. H. Cedeno, V. F. Zackay Castro, and E. R. Parker, Metallurgical and Materials Transactions A, Number 1, 9 (1978) 35. 10. R. Balasubramaniam, Corros. Sci., 42 (2000) 2103. 11. R. Balasubramaniam, and A. V. Ramesh Kumar, Corros. Sci., 42 (2000) 2085. 12. G. Sahoo, and R.Balasubramaniam, Journal of ASTM International No. 5, 5 (2008) 1. 13. Y. Mehta, S. Trivedi, K. Chandra, P.S. Mishra, The Journal of Minerals and Materials Characterization and Engineering, No. 7, 8 (2009) 501 14. S. Trivedi, Y. Mehta, K. Chandra, P.S. Mishra 2009, J. Mater. Process. Technol., Issue 1, 210 ( 2010) 85 15. J. Das, K. Chandra, P.S. Misra, B. Sarma, Mater. Sci. and Engg. A 479 (2008) 164 16. ASTM Standard G3-89, Standard Practice for Conventions Applicable to Electrochemical Measurements in Corrosion Testing. Annual Book of ASTM Standards, ASTM International, West Conshohocken, PA, Vol. 3.02, 2006. 17. ASTM Standard G102-89, Standard Practice for Calculation of Corrosion Rates and Related Information from Electrochemical Measurements. Annual Book of ASTM Standards, ASTM International, West Conshohocken, PA, Vol. 3.02, 2006. 18. F. P. Ijsseling, Br. Corros. J., London, 21 (1986) 95. 19. W. S. Tait,, An Introduction to Electrochemical Corrosion Testing for Practicing Engineers and Scientists, PairODocs Publications, Racine, WI, 1994. 20. Jone D.A., Principles and Prevention of Corrosion, Macmillan Publishing Company, New York, (1992)145. 21. H. J. Flitt, and D. Schweinsberg, Corros. Sci., 47 (2005) 3034. 22. E. McCafferty, Corros. Sci., 47 (2005) 3202. 23. S. C. Dexter, Handbook of Oceanographic Engineering Materials, John Wiley & Sons, New York, (1979) 111. 24. A. Davydov, V. Rybalka, L. Beketaeva, G. Engelhardt, P. Jayaweera, and D. Macdonald, Corros. Sci., 47(2005) 195. 25. E. Sikora, A. Sadkowski, and J. Flis, Electrochimica Acta, No. 16, 38 (1993) 2443. 26. O. Kubaschewski, Iron—Binary phase diagrams, Berlin: Springer Verlag, (1982) 84. |