Paper Menu >>
Journal Menu >>
 Journal of Minerals & Materials Characterization & Engineering, Vol. 9, No.6, pp.547-557, 2010 jmmce.org Printed in the USA. All rights reserved 547 Annealing Heat Treatment Effects on Steel Welds *A.V. Adedayo 1,2 , S.A. Ibitoye 2 and O.A. Oyetoyan 3 1 Department of Metallurgical Engineering, Kwara State Polytechnic, Ilorin, Nigeria 2 Materials Science and Engineering Department, Obafemi Awolowo University, Ile-Ife, Nigeria 3 Department of Metallurgical Engineering, Nigerian Naval Engineering School, Sapele, Nigeria *Corresponding author: adelekeadedayo58@yahoo.com ABSTRACT This paper reports investigations made on the annealing heat treatment effects on steel welds. The properties of the weld investigated were hardness value and toughness. Micro examination of the samples was also done with optical microscopy. Four (4) different grades of steel rods (10mm) in diameter were obtained. The range of the carbon contents of the steel rods was from 0.16 wt pct C to 0.33 wt pct C. From each grade of the steel materials, grooved specimen of about 150mm were prepared. The groves were then filled to create welds using arc welding. The resulting welds were then subjected to annealing heat treatment. The hardness values and toughness of the welds were determined. The microstructural analyses of the welds were carried out as well. The results show that hardness and toughness were dependent on the carbon content. There was also significant microstructural modification due to heat treatment. Keywords: Welding, Annealing, Heat treatment, Hardness, Toughness, Microstructure 1. INTRODUCTION In equipment manufacturing, there are occasions that the steel welds need to be heat treated after welding. This is because that steel weld metallurgy differs significantly from the base metal metallurgy in several respects: heating and cooling rates of a weld are much faster than those of a steel base metal during its manufacturing process. The microstructure of the weld metal is columnar and as melted and it was not subjected to any subsequent thermo-mechanical treatment.  548 A.V. Adedayo, S.A. Ibitoye and O.A. Oyetoyan Vol.9, No.6 Generally, steel weld metal microstructure is a complex mixture of two or more constituents, such as proeutectoid ferrite, polygonal ferrite, aligned and non-aligned side plate ferrite, ferrite carbide aggregates and acicular ferrite [1, 2] . Sometimes, upper and lower bainites, martensites and the A-M (austenite with martensite) microconstituents may be formed [3, 4]. This complex microstructure mixture can lead to highly varied properties of the weld. Generally, the properties of steels are related to its structural make-up [5]. A way to unify the structure of the welds is by heat treatment. Heat treatment involves heating and cooling of a metal or alloy in its solid state with the objects of changing the characteristics of the material. Heat treatment processes include: normalizing, hardening (age hardening, surface hardening, case hardening, flame hardening, induction hardening etc), tempering, annealing, etc. The objects of annealing are to soften the metal, improve machinability, refine grain size due to phase recrystalization, increase ductility of metal, prepare steel for subsequent treatment, modify electrical and magnetic properties, relieve internal stresses, remove gases, and produce a definite microstructure [5, 6]. 2. METHODOLOGY Materials used are 10mm steel rods supplied as-rolled from Universal Steel Rolling Mill, Ogba- Ikeja, Lagos, Nigeria. There are four (4) different steel samples which are essentially different in carbon content. The compositions of the steel rods are given in Table 1.  Vol.9, No.6 Annealing Heat Treatment Effects on Steel Welds 549 Table 1: Composition of steel rods used. Element (wt pct) Sample 1 Sample 2 Sample 3 Sample 4 C 0.2529 0.1576 0.2756 0.3320 Si 0.1468 0.1821 0.1769 0.3116 S 0.0510 0.0598 0.0523 0.0520 P 0.0419 0.0288 0.0275 0.0274 Mn 0.3658 0.6440 0.6247 0.7523 Ni 0.1034 0.1030 0.1170 0.1110 Cr 0.889 0.1224 0.1306 0.1750 Mo 0.0177 0.0114 0.0141 0.0170 V 0.0003 0.001 0.0013 0.003 Cu 0.3213 0.3380 0.3949 0.2773 W 0.0023 0.0007 0.0007 0.0043 As 0.0053 0.0033 0.0033 0.0045 Sn 0.0278 0.0797 0.0797 0.0268 Co 0.0098 0.0086 0.0086 0.0094 Al 0.0049 0.0025 0.0025 0.0025 Pb 0.0012 0.0003 0.0003 0.0017 Ca 0.0004 0.0001 0.0001 0.0005 Zn 0.0033 0.0069 0.0069 0.0061 Fe 98.5550 98.2505 98.2505 97.8859 150mm long pieces were cut from all grades of the steel rods. The middle of each piece was grooved 6mm deep and wide using a grinding wheel as illustrated in Fig. 1. 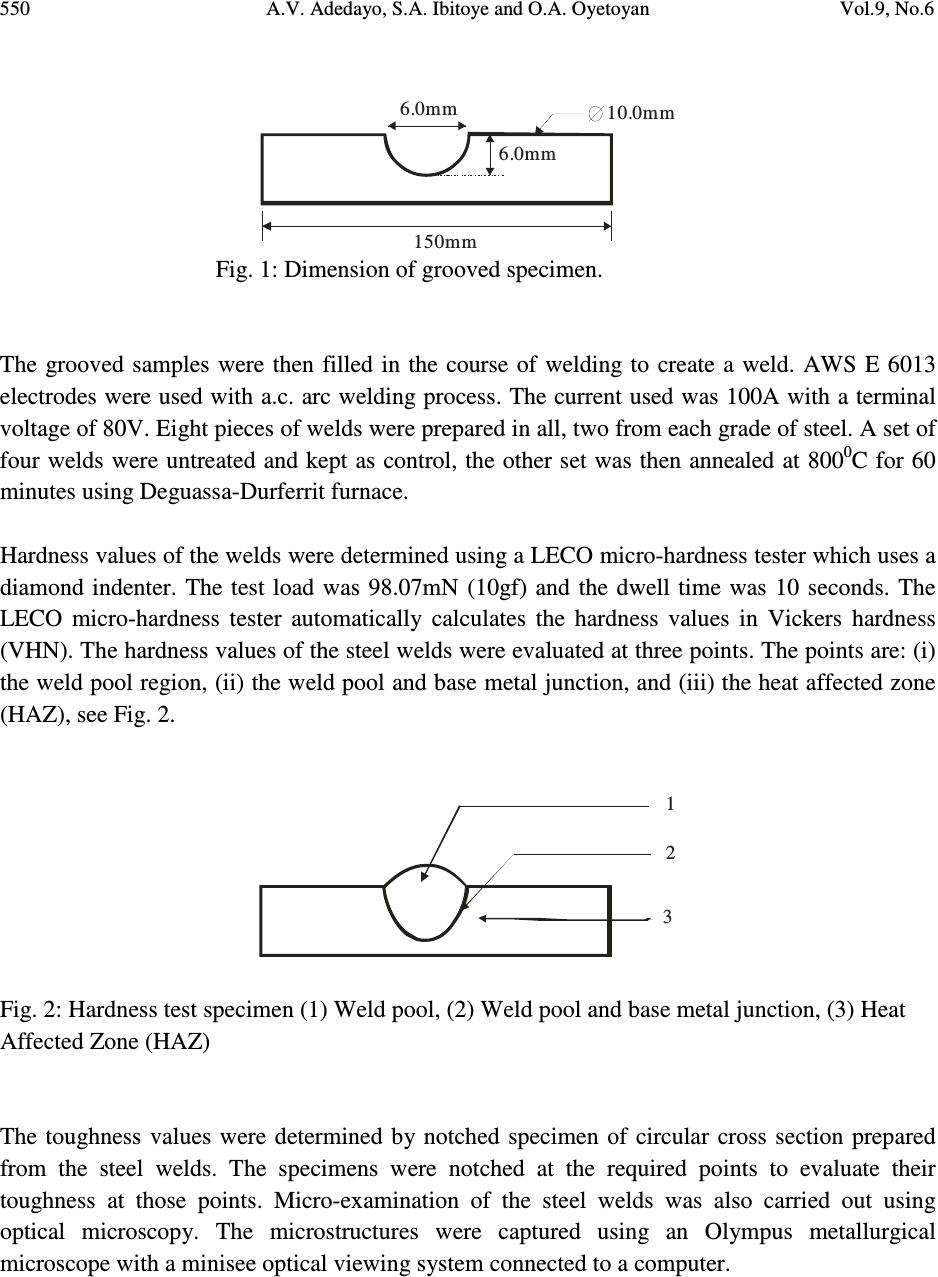 550 A.V. Adedayo, S.A. Ibitoye and O.A. Oyetoyan Vol.9, No.6 6.0mm 6.0mm 150mm 10.0mm Fig. 1: Dimension of grooved specimen. The grooved samples were then filled in the course of welding to create a weld. AWS E 6013 electrodes were used with a.c. arc welding process. The current used was 100A with a terminal voltage of 80V. Eight pieces of welds were prepared in all, two from each grade of steel. A set of four welds were untreated and kept as control, the other set was then annealed at 800 0 C for 60 minutes using Deguassa-Durferrit furnace. Hardness values of the welds were determined using a LECO micro-hardness tester which uses a diamond indenter. The test load was 98.07mN (10gf) and the dwell time was 10 seconds. The LECO micro-hardness tester automatically calculates the hardness values in Vickers hardness (VHN). The hardness values of the steel welds were evaluated at three points. The points are: (i) the weld pool region, (ii) the weld pool and base metal junction, and (iii) the heat affected zone (HAZ), see Fig. 2. 1 2 3 Fig. 2: Hardness test specimen (1) Weld pool, (2) Weld pool and base metal junction, (3) Heat Affected Zone (HAZ) The toughness values were determined by notched specimen of circular cross section prepared from the steel welds. The specimens were notched at the required points to evaluate their toughness at those points. Micro-examination of the steel welds was also carried out using optical microscopy. The microstructures were captured using an Olympus metallurgical microscope with a minisee optical viewing system connected to a computer. 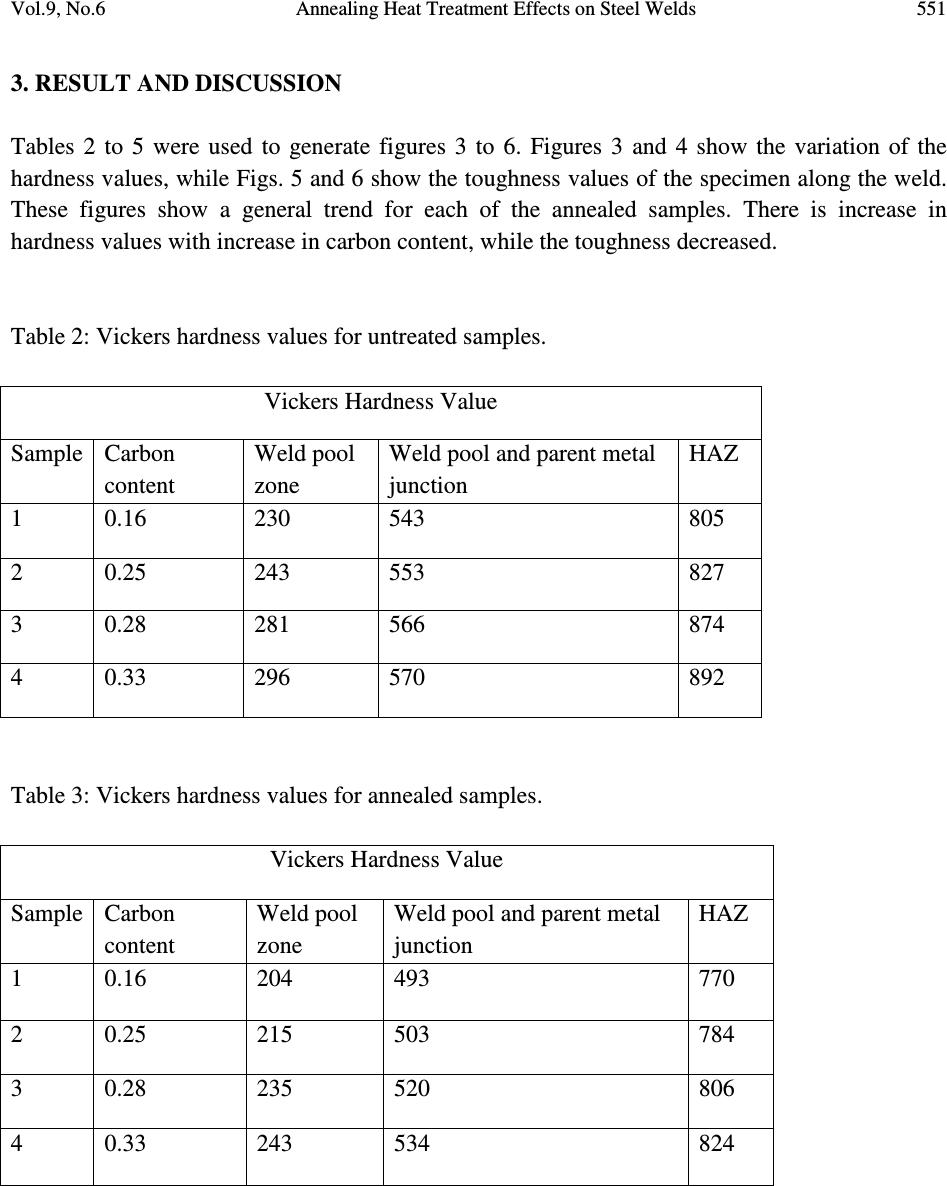 Vol.9, No.6 Annealing Heat Treatment Effects on Steel Welds 551 3. RESULT AND DISCUSSION Tables 2 to 5 were used to generate figures 3 to 6. Figures 3 and 4 show the variation of the hardness values, while Figs. 5 and 6 show the toughness values of the specimen along the weld. These figures show a general trend for each of the annealed samples. There is increase in hardness values with increase in carbon content, while the toughness decreased. Table 2: Vickers hardness values for untreated samples. Vickers Hardness Value Sample Carbon content Weld pool zone Weld pool and parent metal junction HAZ 1 0.16 230 543 805 2 0.25 243 553 827 3 0.28 281 566 874 4 0.33 296 570 892 Table 3: Vickers hardness values for annealed samples. Vickers Hardness Value Sample Carbon content Weld pool zone Weld pool and parent metal junction HAZ 1 0.16 204 493 770 2 0.25 215 503 784 3 0.28 235 520 806 4 0.33 243 534 824 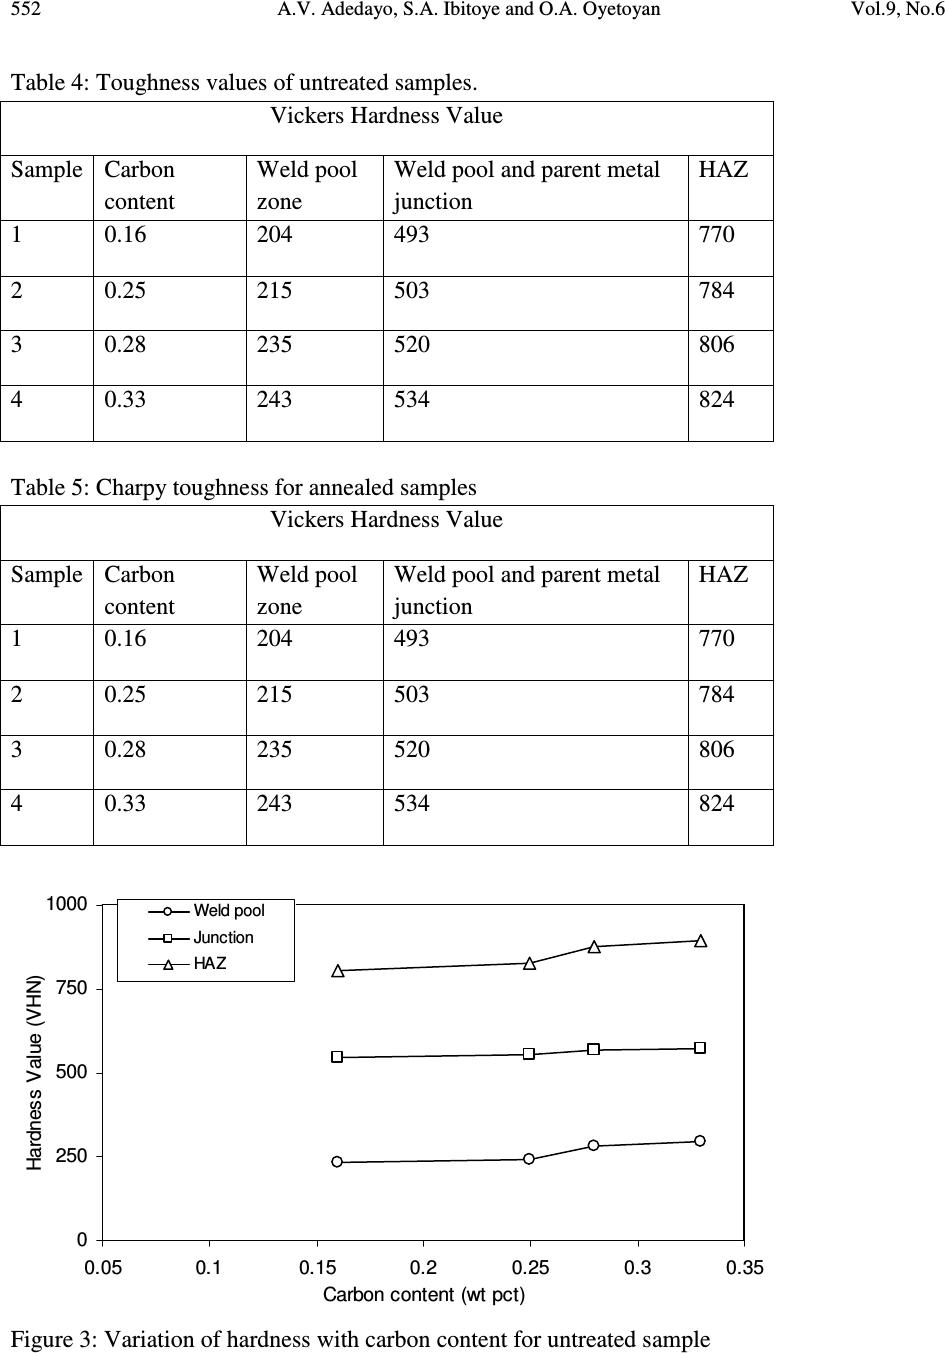 552 A.V. Adedayo, S.A. Ibitoye and O.A. Oyetoyan Vol.9, No.6 Table 4: Toughness values of untreated samples. Vickers Hardness Value Sample Carbon content Weld pool zone Weld pool and parent metal junction HAZ 1 0.16 204 493 770 2 0.25 215 503 784 3 0.28 235 520 806 4 0.33 243 534 824 Table 5: Charpy toughness for annealed samples Vickers Hardness Value Sample Carbon content Weld pool zone Weld pool and parent metal junction HAZ 1 0.16 204 493 770 2 0.25 215 503 784 3 0.28 235 520 806 4 0.33 243 534 824 0 250 500 750 1000 0.050.10.150.2 0.25 0.3 0.35 Carbon content (wt pct) Hardness Value (VHN) Weld pool Junction HAZ Figure 3: Variation of hardness with carbon content for untreated sample 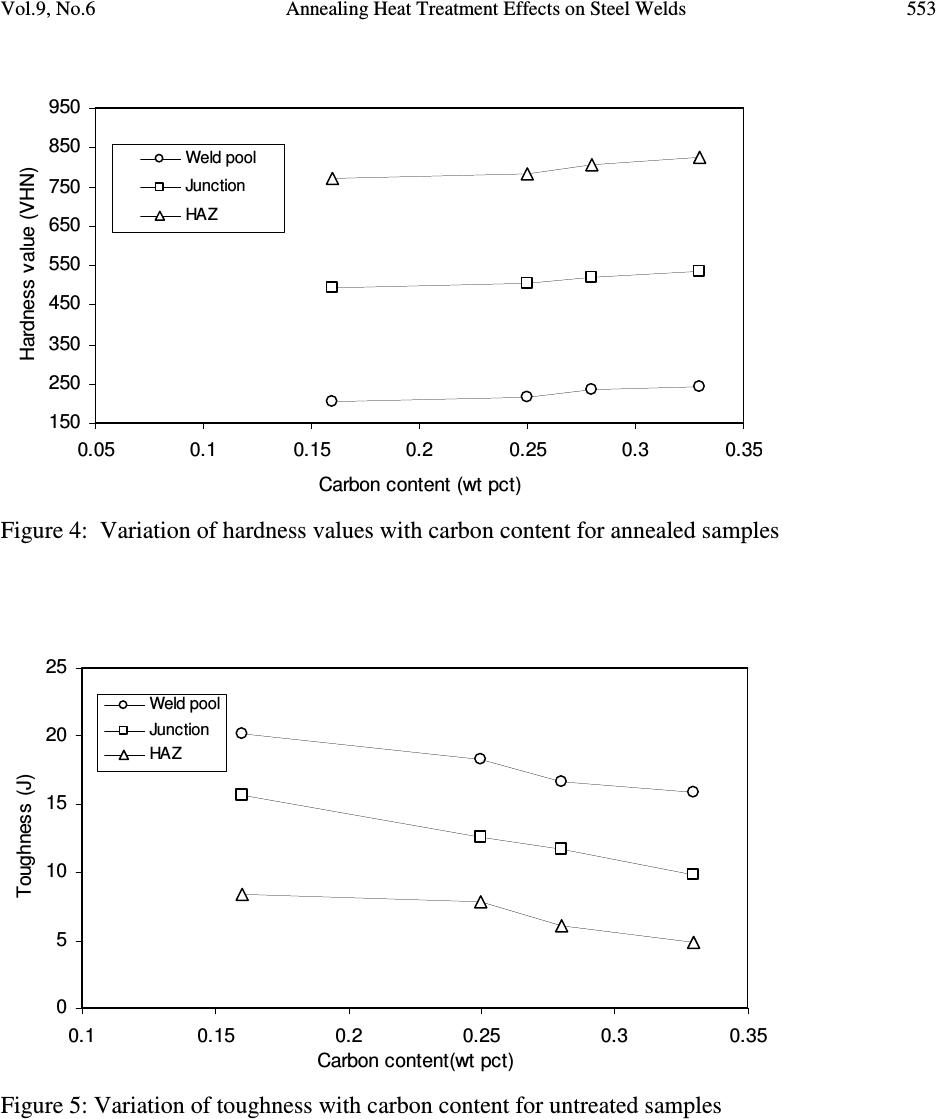 Vol.9, No.6 Annealing Heat Treatment Effects on Steel Welds 553 150 250 350 450 550 650 750 850 950 0.05 0.10.15 0.20.25 0.30.35 Carbon content (wt pct) Hardness value (VHN) Weld pool Junction HAZ Figure 4: Variation of hardness values with carbon content for annealed samples 0 5 10 15 20 25 0.10.15 0.2 0.25 0.30.35 Carbon content(wt pct) Toughness (J) Weld pool Junction HAZ Figure 5: Variation of toughness with carbon content for untreated samples  554 A.V. Adedayo, S.A. Ibitoye and O.A. Oyetoyan Vol.9, No.6 0 5 10 15 20 25 30 35 0.10.15 0.20.25 0.30.35 Carbon content (wt pct) Toughness (J) Weld pool Junction HAZ Figure 6: Variation of toughness with carbon content for annealed samples This is also the trend for the untreated samples. Normally, the structure of the steels investigated, viz: 0.16wt%C, 0.25wt%C, 0.28wt%C and 0.33wt%C are essentially ferritic. Ferritic structures could be: proeutectoide ferrite, polygonal ferrite, aligned and non-aligned side plate ferrite, ferrite carbide aggregates, acicular ferrite, bainitic etc [1,2]. IIW DOC IX-1533-88 gives a detailed classification of weld metal microstructures [1]. The maximum solubility of carbon in ferrite is 0.025wt%C [7, 8]. This suggests that the ferritic structures in the investigated steels were supersaturated with carbon. This saturation leads to straining of the ferrite matrix and thus consequently leading to increase in hardness values with increase in carbon content. The higher the carbon content, the higher the straining. The straining of the ferritic structure is actually evidenced by Figs. 7C and 7D which show bainitic structures. Bainitic structures are actually fine dispersion of iron carbide in a strained ferrite matrix [8]. The lower toughness of the weld metal with increase in carbon content is also a result of this straining. 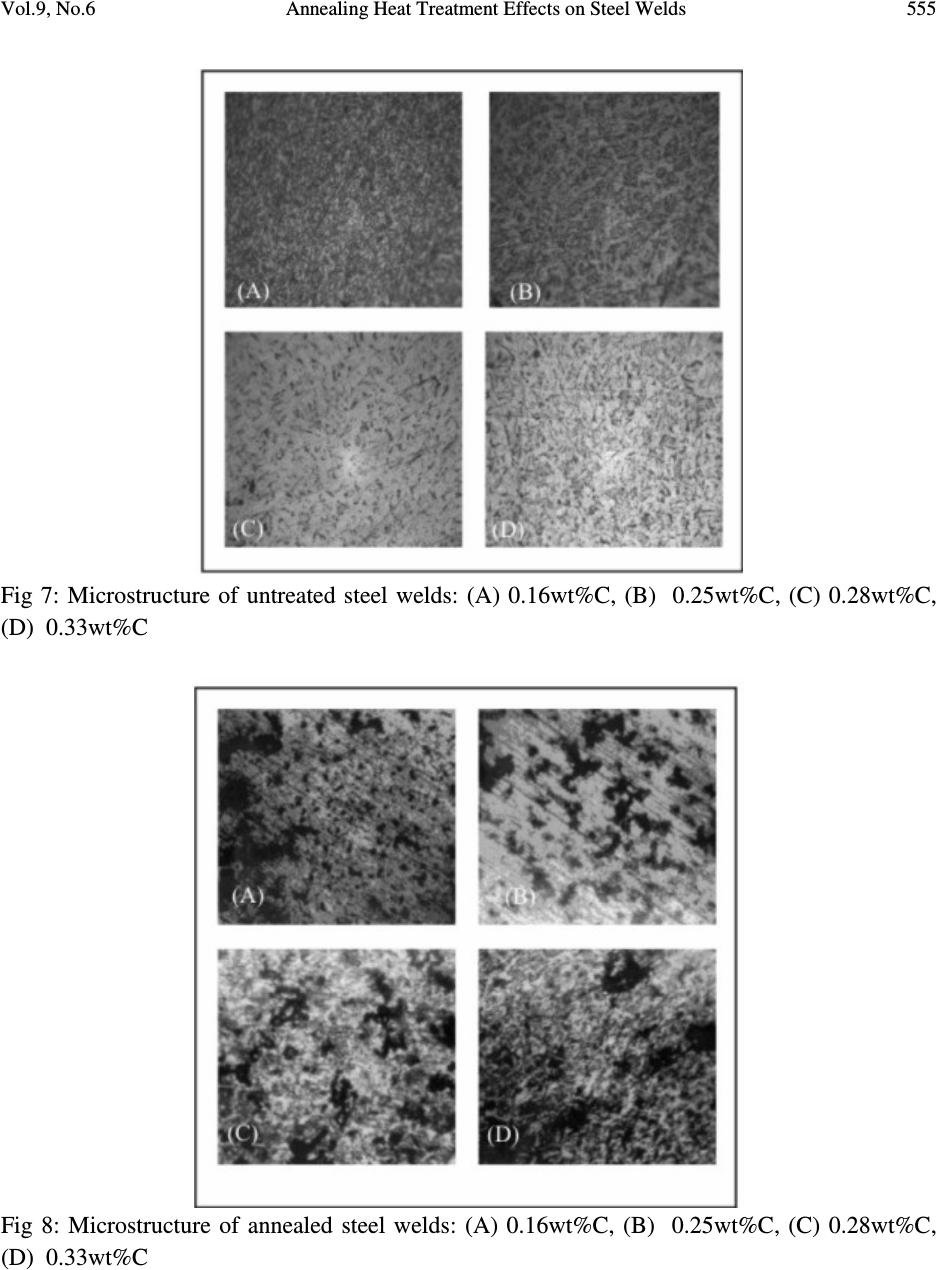 Vol.9, No.6 Annealing Heat Treatment Effects on Steel Welds 555 Fig 7: Microstructure of untreated steel welds: (A) 0.16wt%C, (B) 0.25wt%C, (C) 0.28wt%C, (D) 0.33wt%C Fig 8: Microstructure of annealed steel welds: (A) 0.16wt%C, (B) 0.25wt%C, (C) 0.28wt%C, (D) 0.33wt%C 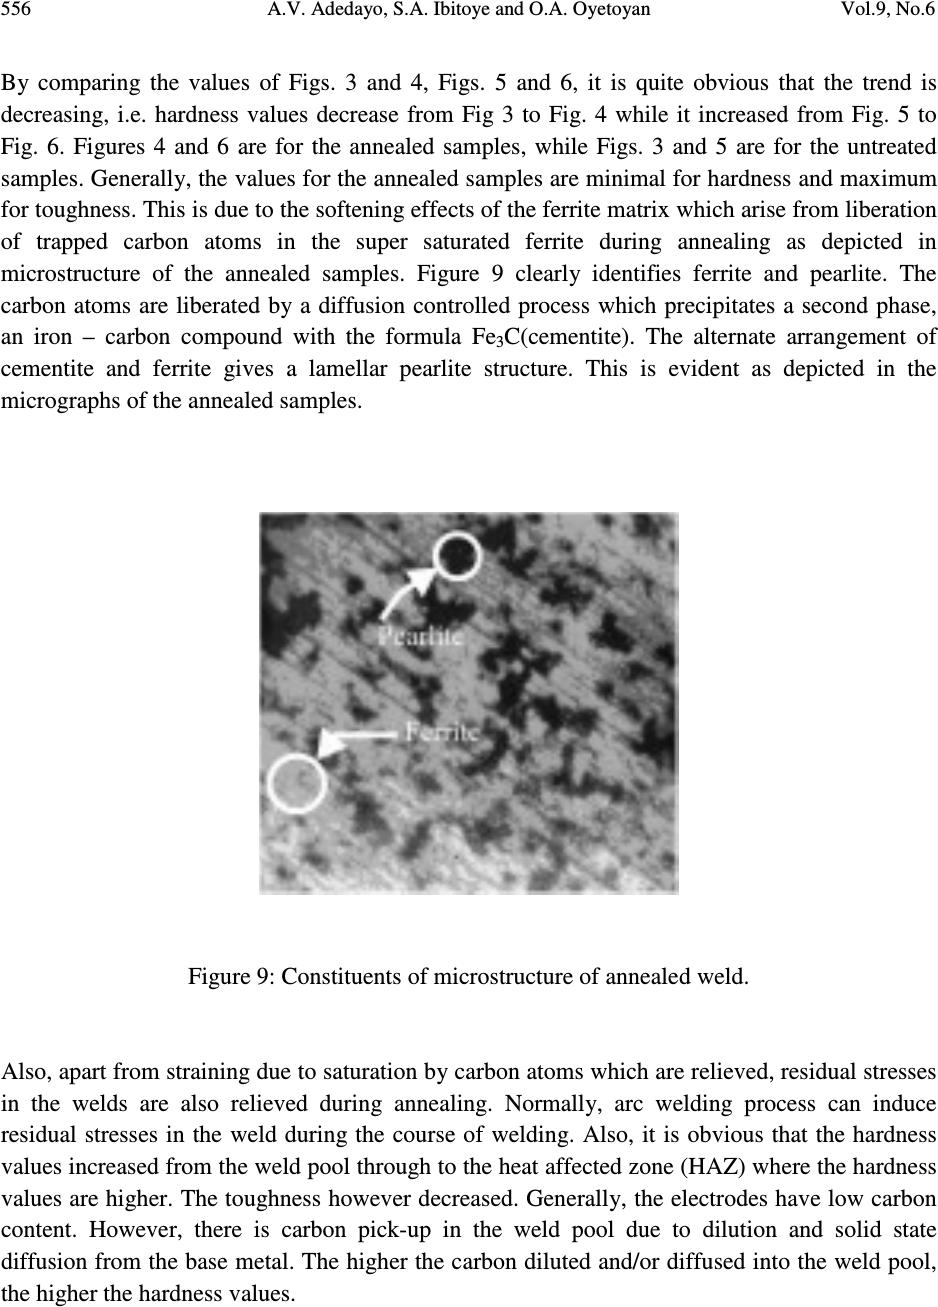 556 A.V. Adedayo, S.A. Ibitoye and O.A. Oyetoyan Vol.9, No.6 By comparing the values of Figs. 3 and 4, Figs. 5 and 6, it is quite obvious that the trend is decreasing, i.e. hardness values decrease from Fig 3 to Fig. 4 while it increased from Fig. 5 to Fig. 6. Figures 4 and 6 are for the annealed samples, while Figs. 3 and 5 are for the untreated samples. Generally, the values for the annealed samples are minimal for hardness and maximum for toughness. This is due to the softening effects of the ferrite matrix which arise from liberation of trapped carbon atoms in the super saturated ferrite during annealing as depicted in microstructure of the annealed samples. Figure 9 clearly identifies ferrite and pearlite. The carbon atoms are liberated by a diffusion controlled process which precipitates a second phase, an iron – carbon compound with the formula Fe 3 C(cementite). The alternate arrangement of cementite and ferrite gives a lamellar pearlite structure. This is evident as depicted in the micrographs of the annealed samples. Figure 9: Constituents of microstructure of annealed weld. Also, apart from straining due to saturation by carbon atoms which are relieved, residual stresses in the welds are also relieved during annealing. Normally, arc welding process can induce residual stresses in the weld during the course of welding. Also, it is obvious that the hardness values increased from the weld pool through to the heat affected zone (HAZ) where the hardness values are higher. The toughness however decreased. Generally, the electrodes have low carbon content. However, there is carbon pick-up in the weld pool due to dilution and solid state diffusion from the base metal. The higher the carbon diluted and/or diffused into the weld pool, the higher the hardness values. 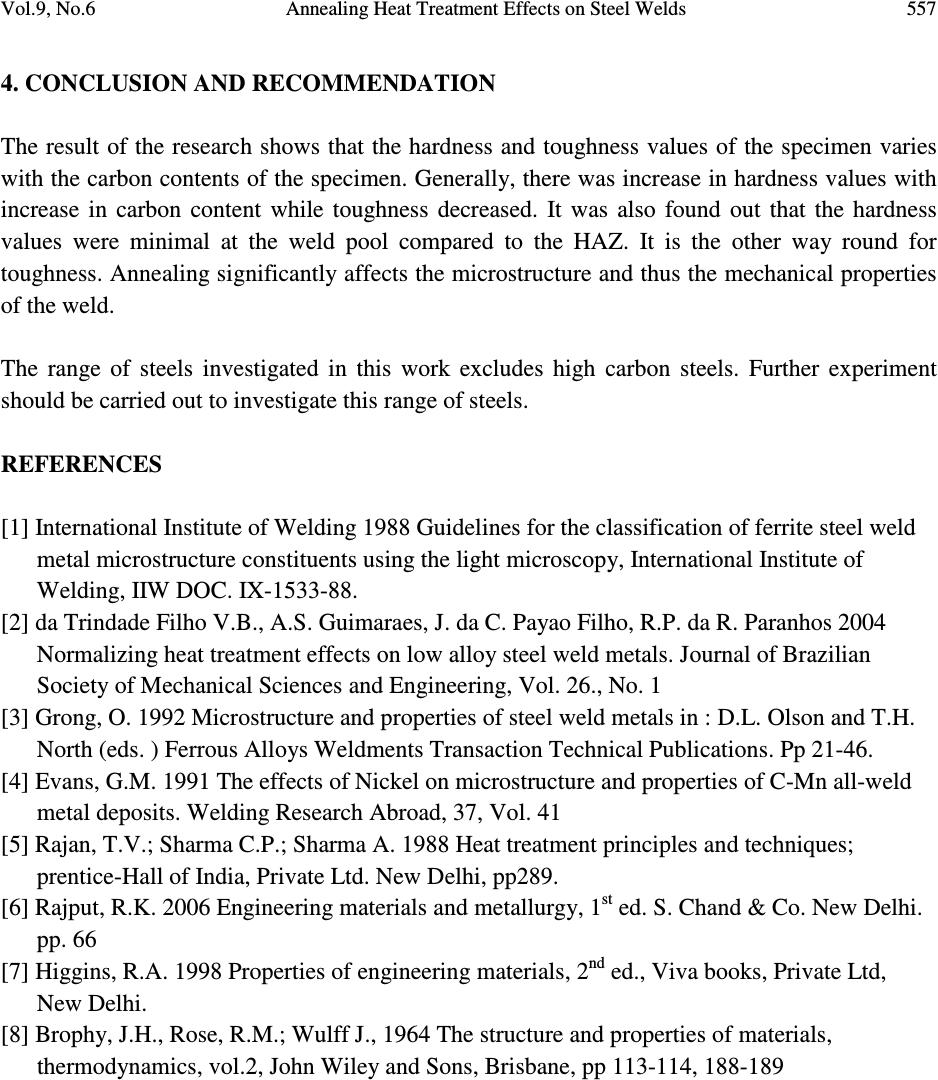 Vol.9, No.6 Annealing Heat Treatment Effects on Steel Welds 557 4. CONCLUSION AND RECOMMENDATION The result of the research shows that the hardness and toughness values of the specimen varies with the carbon contents of the specimen. Generally, there was increase in hardness values with increase in carbon content while toughness decreased. It was also found out that the hardness values were minimal at the weld pool compared to the HAZ. It is the other way round for toughness. Annealing significantly affects the microstructure and thus the mechanical properties of the weld. The range of steels investigated in this work excludes high carbon steels. Further experiment should be carried out to investigate this range of steels. REFERENCES [1] International Institute of Welding 1988 Guidelines for the classification of ferrite steel weld metal microstructure constituents using the light microscopy, International Institute of Welding, IIW DOC. IX-1533-88. [2] da Trindade Filho V.B., A.S. Guimaraes, J. da C. Payao Filho, R.P. da R. Paranhos 2004 Normalizing heat treatment effects on low alloy steel weld metals. Journal of Brazilian Society of Mechanical Sciences and Engineering, Vol. 26., No. 1 [3] Grong, O. 1992 Microstructure and properties of steel weld metals in : D.L. Olson and T.H. North (eds. ) Ferrous Alloys Weldments Transaction Technical Publications. Pp 21-46. [4] Evans, G.M. 1991 The effects of Nickel on microstructure and properties of C-Mn all-weld metal deposits. Welding Research Abroad, 37, Vol. 41 [5] Rajan, T.V.; Sharma C.P.; Sharma A. 1988 Heat treatment principles and techniques; prentice-Hall of India, Private Ltd. New Delhi, pp289. [6] Rajput, R.K. 2006 Engineering materials and metallurgy, 1 st ed. S. Chand & Co. New Delhi. pp. 66 [7] Higgins, R.A. 1998 Properties of engineering materials, 2 nd ed., Viva books, Private Ltd, New Delhi. [8] Brophy, J.H., Rose, R.M.; Wulff J., 1964 The structure and properties of materials, thermodynamics, vol.2, John Wiley and Sons, Brisbane, pp 113-114, 188-189 |