Paper Menu >>
Journal Menu >>
 Journal of Minerals & Materials Characterization & Engineering, Vol. 9, No.4, pp.365-387, 2010 jmmce.org Printed in the USA. All rights reserved 365 Effect of Fly Ash Content on Friction and Dry Sliding Wear Behavior of Glass Fiber Reinforced Polymer Composites - A Taguchi Approach S.R. Chauhan* a, Anoop Kumara, I. Singhb, and Prashant Kumara a Department of Mechanical Engineering, National Institute of Technology, Hamirpur (H.P.)-177005, India b Department of Mechanical and Industrial Engineering, I.I.T Roorkee, India *Corresponding author: santramchauhan@gmail.com ABSTRACT The tribological behavior of glass fiber reinforced vinylester composites filled with fly ash particulates were studied using a pin-on-disc wear apparatus under dry sliding conditions. The influence of friction and wear parameters like (pv) factor, sliding distance and percentage of filler content, on the friction and sliding wear rate were investigated. A plan of experiments, based on the Taguchi technique, was performed to acquire data in a controlled way. An orthogonal array and analysis of variance (ANOVA) were applied to investigate the influence of process parameters on the coefficient of friction and sliding wear behaviour of these composites. The Taguchi design of experiment approach eliminates the need for repeated experiments and thus saves time, material and cost. Taguchi approach identifies not only the significant control factors but also their interactions influencing the coefficient of friction and specific wear rate predominantly. The results showed that the inclusion of fly ash as filler materials in glass vinylester composites decreases the coefficient of friction and increases the wear resistance of the glass vinylester composites significantly. Key Words: Composites; Fillers; Orthogonal Array; Taguchi Technique 1. INTRODUCTION The important features of fiber composites that make them attractive as engineering materials are the capability to tailor the materials properties through the control of fiber, matrix combinations  366 S.R. Chauhan, Anoop Kumar, I. Singh, and Prashant Kumar Vol.9, No.4 and the selection of processing techniques. A proper selection of matrix and the reinforcing phase can lead to a composite with a combination of high strength and modulus comparable to or even better than that conventional metallic material [1-3]. On account of their good combination of properties, fiber reinforced polymer composites are used particularly in the automotive and aircraft industries, the manufacturing of space ships and sea vehicles [1, 4–5]. There are two main characteristics which make these materials attractive compared with conventional metallic systems. These are relatively low density and ability to be tailored to have stacking sequences that provide high strength and stiffness in directions of high loading [6]. Polymer composites consist of resin and a reinforcement chosen according to the desired mechanical properties and the application . The thermoset resins polyester, epoxy, phenolic, silicone and polyamide resins are widely employed in many structural and engineering applications [1,5,7-9]. One such matrix is vinylester, which was introduced commercially in early 1960s. Today vinylester resins have become one of the most important thermosetting materials due to its excellent mechanical properties with good chemical/corrosion resistance to wide variety of commonly encounter chemical environment [3]. Vinylester is a hybrid form of polyester resin which has been toughened with epoxy molecules within the main molecular structure. These resins offer better resistance to moisture absorption than polyester resins used to fabricate variety of reinforced structure including pipes, scrubber and ducts. They are the prime candidates for use in composites for transportation and/or infrastructure. Vinylester resins are stronger than polyester resins and cheaper than epoxy resins [3, 6]. Physical, mechanical and wear characteristics of glass fiber polymer composites can be modified further by adding a solid filler phase to the matrix during the composite preparation. This has been suggested the kind of multi-phase composite technique for improving the matrix dominated properties and in this technique a supplementary reinforcement such as particulates, whisker, or micro fibers are added to the matrix prior to resin impregnation. It has been found that there is a significant improvement in impact energy of hybrid composites incorporating either particulates or ceramic whiskers. Hard particulate fillers consisting of ceramic or metal particles and fiber fillers made of glass are being used these days to improve the wear resistance of the composites [10, 11]. The improved performance of polymers and their composites in industrial and structural applications by addition of filler materials have shown great promises. Various kinds of polymers and polymer matrix composites reinforced with metal particles have a wide range of industrial applications such as heaters, electrode and composite with thermal durability at high temperature etc. These engineering composites are preferred due to their low density, high corrosion resistance, ease of fabrication and low cost [12-15]. Similarly, ceramic filler polymer 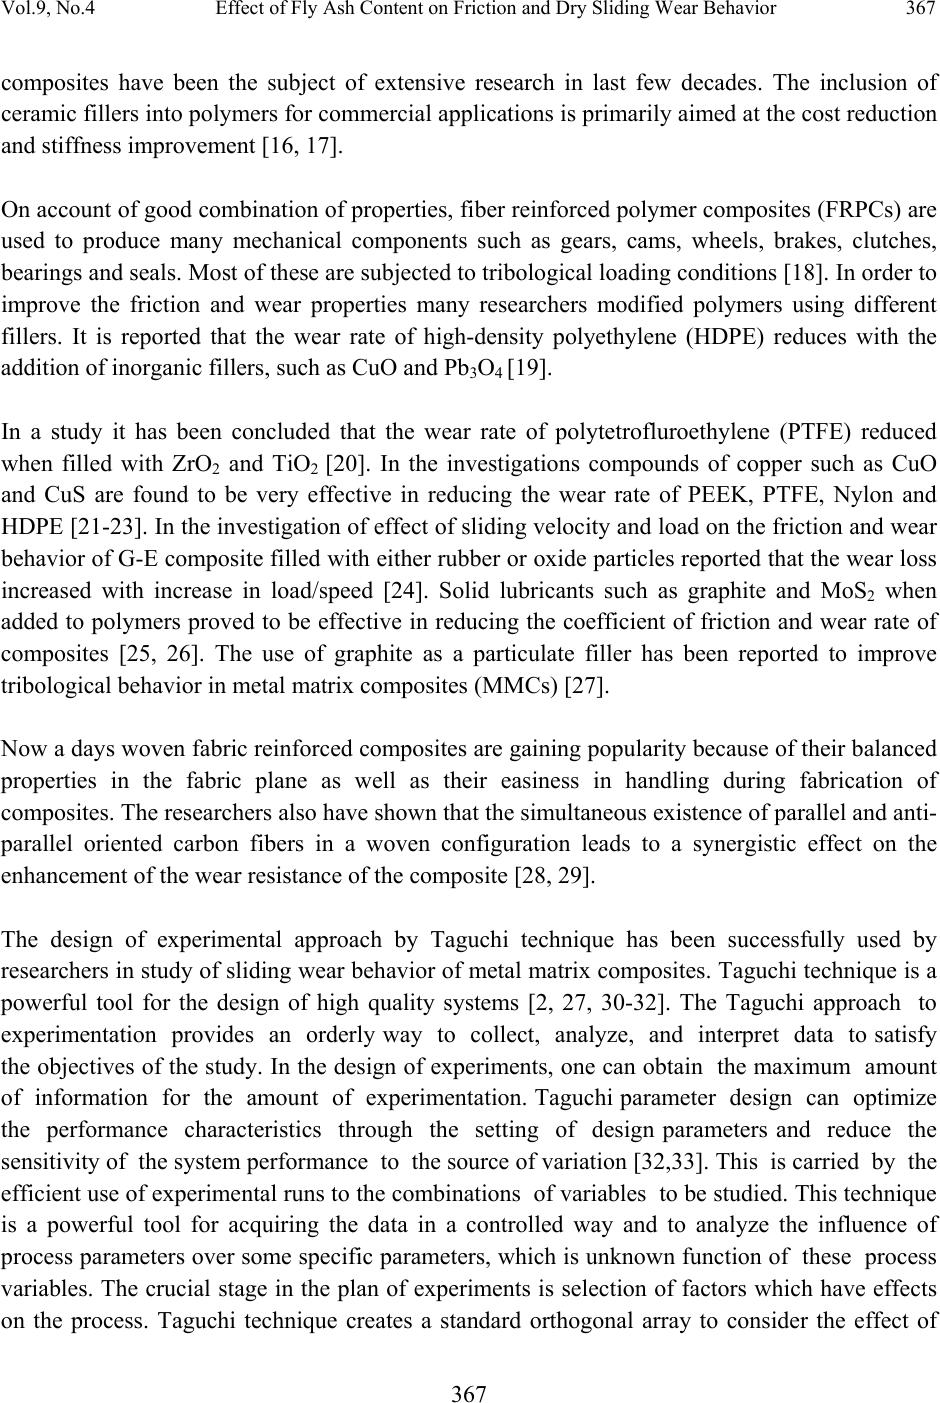 Vol.9, No.4 Effect of Fly Ash Content on Friction and Dry Sliding Wear Behavior 367 367 composites have been the subject of extensive research in last few decades. The inclusion of ceramic fillers into polymers for commercial applications is primarily aimed at the cost reduction and stiffness improvement [16, 17]. On account of good combination of properties, fiber reinforced polymer composites (FRPCs) are used to produce many mechanical components such as gears, cams, wheels, brakes, clutches, bearings and seals. Most of these are subjected to tribological loading conditions [18]. In order to improve the friction and wear properties many researchers modified polymers using different fillers. It is reported that the wear rate of high-density polyethylene (HDPE) reduces with the addition of inorganic fillers, such as CuO and Pb3O4 [19]. In a study it has been concluded that the wear rate of polytetrofluroethylene (PTFE) reduced when filled with ZrO2 and TiO2 [20]. In the investigations compounds of copper such as CuO and CuS are found to be very effective in reducing the wear rate of PEEK, PTFE, Nylon and HDPE [21-23]. In the investigation of effect of sliding velocity and load on the friction and wear behavior of G-E composite filled with either rubber or oxide particles reported that the wear loss increased with increase in load/speed [24]. Solid lubricants such as graphite and MoS2 when added to polymers proved to be effective in reducing the coefficient of friction and wear rate of composites [25, 26]. The use of graphite as a particulate filler has been reported to improve tribological behavior in metal matrix composites (MMCs) [27]. Now a days woven fabric reinforced composites are gaining popularity because of their balanced properties in the fabric plane as well as their easiness in handling during fabrication of composites. The researchers also have shown that the simultaneous existence of parallel and anti- parallel oriented carbon fibers in a woven configuration leads to a synergistic effect on the enhancement of the wear resistance of the composite [28, 29]. The design of experimental approach by Taguchi technique has been successfully used by researchers in study of sliding wear behavior of metal matrix composites. Taguchi technique is a powerful tool for the design of high quality systems [2, 27, 30-32]. The Taguchi approach to experimentation provides an orderly way to collect, analyze, and interpret data to satisfy the objectives of the study. In the design of experiments, one can obtain the maximum amount of information for the amount of experimentation. Taguchi parameter design can optimize the performance characteristics through the setting of design parameters and reduce the sensitivity of the system performance to the source of variation [32,33]. This is carried by the efficient use of experimental runs to the combinations of variables to be studied. This technique is a powerful tool for acquiring the data in a controlled way and to analyze the influence of process parameters over some specific parameters, which is unknown function of these process variables. The crucial stage in the plan of experiments is selection of factors which have effects on the process. Taguchi technique creates a standard orthogonal array to consider the effect of 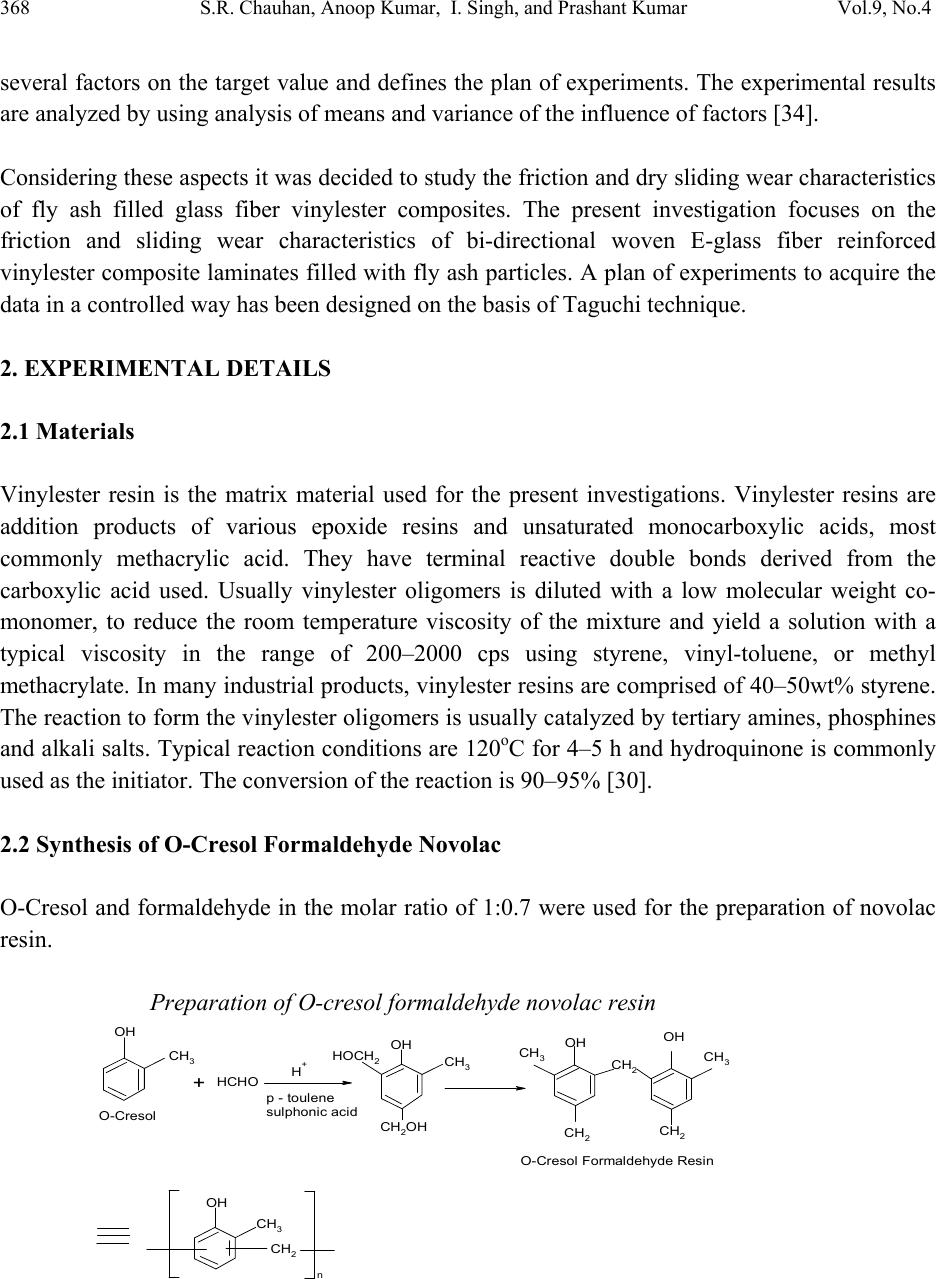 368 S.R. Chauhan, Anoop Kumar, I. Singh, and Prashant Kumar Vol.9, No.4 OH CH 3 HCHO OH CH 3 HOCH 2 CH 2 OH OH CH 2 OH CH 3 CH 2 CH 2 CH 3 H + n OH CH 3 CH 2 + p - toulene sulphonic a cid O-Cresol Formaldehyde Resin O-Cresol several factors on the target value and defines the plan of experiments. The experimental results are analyzed by using analysis of means and variance of the influence of factors [34]. Considering these aspects it was decided to study the friction and dry sliding wear characteristics of fly ash filled glass fiber vinylester composites. The present investigation focuses on the friction and sliding wear characteristics of bi-directional woven E-glass fiber reinforced vinylester composite laminates filled with fly ash particles. A plan of experiments to acquire the data in a controlled way has been designed on the basis of Taguchi technique. 2. EXPERIMENTAL DETAILS 2.1 Materials Vinylester resin is the matrix material used for the present investigations. Vinylester resins are addition products of various epoxide resins and unsaturated monocarboxylic acids, most commonly methacrylic acid. They have terminal reactive double bonds derived from the carboxylic acid used. Usually vinylester oligomers is diluted with a low molecular weight co- monomer, to reduce the room temperature viscosity of the mixture and yield a solution with a typical viscosity in the range of 200–2000 cps using styrene, vinyl-toluene, or methyl methacrylate. In many industrial products, vinylester resins are comprised of 40–50wt% styrene. The reaction to form the vinylester oligomers is usually catalyzed by tertiary amines, phosphines and alkali salts. Typical reaction conditions are 120oC for 4–5 h and hydroquinone is commonly used as the initiator. The conversion of the reaction is 90–95% [30]. 2.2 Synthesis of O-Cresol Formaldehyde Novolac O-Cresol and formaldehyde in the molar ratio of 1:0.7 were used for the preparation of novolac resin. Preparation of O-cresol formaldehyde novolac resin 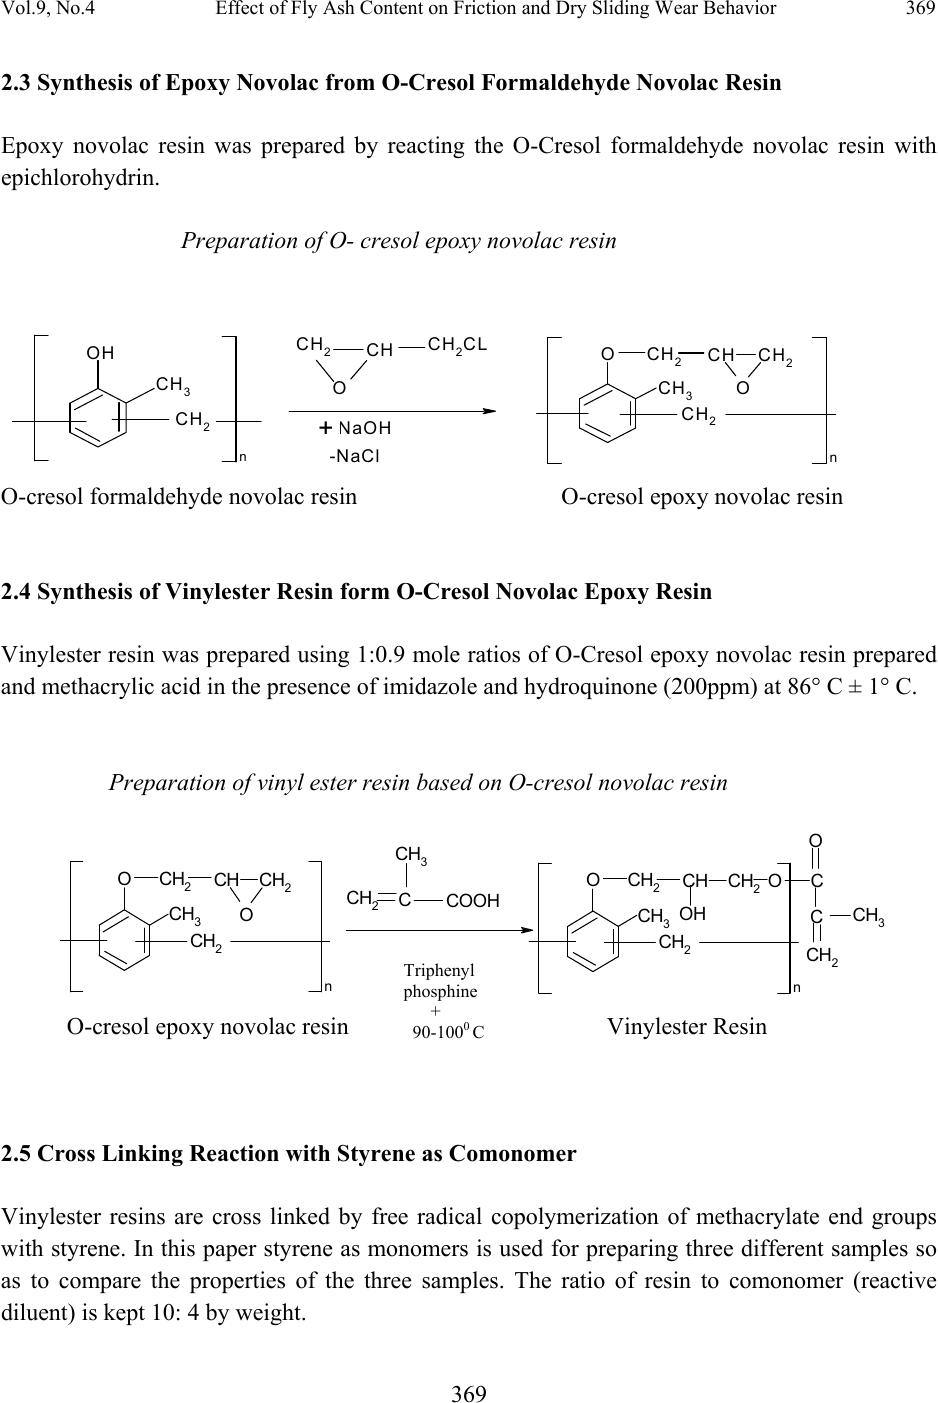 Vol.9, No.4 Effect of Fly Ash Content on Friction and Dry Sliding Wear Behavior 369 369 2.3 Synthesis of Epoxy Novolac from O-Cresol Formaldehyde Novolac Resin Epoxy novolac resin was prepared by reacting the O-Cresol formaldehyde novolac resin with epichlorohydrin. Preparation of O- cresol epoxy novolac resin n OH CH3 CH2 CH2CH CH2CL O NaOH OCH2CH O CH3 CH2 CH2 n +-NaCl O-cresol formaldehyde novolac resin O-cresol epoxy novolac resin 2.4 Synthesis of Vinylester Resin form O-Cresol Novolac Epoxy Resin Vinylester resin was prepared using 1:0.9 mole ratios of O-Cresol epoxy novolac resin prepared and methacrylic acid in the presence of imidazole and hydroquinone (200ppm) at 86° C ± 1° C. Preparation of vinyl ester resin based on O-cresol novolac resin OCH2CH O CH3 CH2 CH2 n CH2CCOOH CH3OCH2CH CH3 CH2 CH2 n OH O O C CH3 CH2 C O-cresol epoxy novolac resin Vinylester Resin 2.5 Cross Linking Reaction with Styrene as Comonomer Vinylester resins are cross linked by free radical copolymerization of methacrylate end groups with styrene. In this paper styrene as monomers is used for preparing three different samples so as to compare the properties of the three samples. The ratio of resin to comonomer (reactive diluent) is kept 10: 4 by weight. Triphenyl phosphine + 90-1000 C  370 S.R. Chauhan, Anoop Kumar, I. Singh, and Prashant Kumar Vol.9, No.4 OCH2CH CH3 CH2 CH2 n OH O O CCH3 CH2 CCH CH2 O O C OCH2CH CH3 CH2 OH n CH2CH2CH CH2 C CH3 + Styrene Cross linking of vinylester with styrene as comonomer Vinyl Ester Resin 2.6 Composite Fabrication The resin used in this work is vinylester prepared from O-cresol formaldehyde novolac resin (density 1.42 gm/cc) and reinforcing phase E-glass fibers (modulus 72.4GPa, density 2.54 g/cm3) were supplied by Northern Polymer Pvt. Ltd. New Delhi. Methyl ethyl ketone peroxide (MEKP- 1%), Cobalt Naphthenate (1.5%) was used as catalyst and accelerator respectively. Three different types of composites were prepared for this study. The fly ash (size 80-100µm) was used as filler material which was collected from thermal power plant of National Aluminium Company (NALCO) located in India. The chemical compositions, properties such as density and hardness of fly ash are given in Table 1. Conventional hand layup technique was used for making of the composite laminates. The Cobalt Naphthenate 1.5% is mixed thoroughly in vinylester resin and then 1% methyl ethyl ketone- peroxide (MEKP) was mixed in the resins prior to reinforcement. The fiber loading (weight fraction of glass fiber in the composite) is kept 50 wt% for all the samples. The stacking procedure consists of placing the fabric one above the other with the resin mix well spread between the fabrics on a mould release sheet. A porous Teflon film was again used to complete the stack. To ensure uniform thickness of the sample, a 3mm spacer was used. The mould plates were coated with release agent in order to aid the ease of separation on curing. This procedure was repeated in all cases unless thickness of 3mm was obtained. A metal roller was used so that uniform thickness and compactness could obtain. The whole assembly is placed in the compression molding machine at a pressure of 60Kgf/cm2 and allowed to cure at room temperature for 24hrs. The laminate sheets of sizes 300 X 300 X 3mm were prepared. Specimens of suitable dimensions were cut using a diamond cutter for physical characterization, mechanical and wear testing as per ASTM standard. The other composite samples with particulates of fly ash  Vol.9, No.4 Effect of Fly Ash Content on Friction and Dry Sliding Wear Behavior 371 371 filler of fixed weights (10wt% and 20wt%) percentage were fabricated by the same technique. The flyash was mixed thoroughly in the vinylester resin mechanically before the glass fiber mats were reinforced in the matrix body. The composites prepared for this study are designated as GV1, GV2 and GV3, respectively and percentage of fiber content in all the composites is 50wt%. The detailed compositions along with the designation are presented in Table 1. Table 1. Materials and test conditions. 2.7 Friction and Wear Measurements To evaluate the friction and sliding wear performance of glass fiber vinylester composites under dry sliding conditions, the wear tests were carried out in a pin-on-disc type friction and wear monitoring test rig (DUCOM) as per ASTM G 99. The counter body is a disc made of hardened ground steel (EN-32, hardness 72 HRC, surface roughness 0.6 μ Ra). The specimen was held stationary and the disc was rotated while a normal force was applied through a lever mechanism. During the test, friction force was measured by a transducer mounted on the loading arm. The friction force readings were taken as the average of 100 readings of every 40seconds for the required period. For this purpose a microprocessor controlled data acquisition system was used. The average mass loss was used to calculate the specific wear rate. The tests were conducted with (pv) factor 0.5, 2.8 and 6.7 MPa m/s for the sliding distances of 1000, 2000 and 3000m. Sliding wear data reported here is the average of at least two runs. The material loss from the composite surface is measured using a precision electronic balance with an accuracy of + 0.01 mg. The specific wear rate (m3/Nm) is then expressed on ‘volume loss’ basis Ks = Δm/L ρ Fn Materials Detail composition Density gm/cm3 Fiber Void fraction (%) Temperature (oC) Humidity (%) GV1 Vinylester+50wt%glassfiber 2.39 4.6 27 60 GV2 Vinylester+50wt%glassfiber + 10wt%fly ash 2.295 6.85 27 60 GV3 Vinylester+50wt%glassfiber + 20wt%fly ash 1.970 9.09 27 60  372 S.R. Chauhan, Anoop Kumar, I. Singh, and Prashant Kumar Vol.9, No.4 Where KS - is the specific wear rate (mm3N-1m-1), Δm- is the mass loss in the test duration (gm), ρ-is the density of the composite (gm/cm3) , Fn - is applied normal load (N), L-is sliding distance (m). Table 2. Levels of variables used in the experiments. Control factor Level I II III Units A: pv factor B:Sliding distance C:Fly ash content 0.53 1000 0 2.8 2000 10 6.7 3000 20 MPa m/s m % 2.8 Scanning Electron Microscopy The surfaces of the worn out specimens were examined directly by scanning electron microscope. The composite samples were mounted on stubs with silver paste. To enhance the conductivity of the samples, a thin film of platinum was vacuum evaporated onto them before the photomicrographs were taken. 3. EXPERIMENTAL DESIGN Taguchi design of experiment is a powerful analysis tool for modeling and analyzing the influence of control factors on performance output. The most important stage in the design of experiment lies in the selection of the control factors. In the present work, the impact of three such parameters are studied using L27 (313) orthogonal design as presented in Table 3 [32]. The operating conditions under which sliding wear tests carried out are given in Table 2.  Vol.9, No.4 Effect of Fly Ash Content on Friction and Dry Sliding Wear Behavior 373 373 Table 3. Orthogonal array L27(313) of Taguchi [32 ]. L27(313) test 1 2 3 4 5 6 7 8 9 10 11 12 13 1 2 3 4 5 6 7 8 9 10 11 12 13 14 15 16 17 18 19 20 21 22 23 24 25 26 27 1 1 1 1 1 1 1 1 1 2 2 2 2 2 2 2 2 2 3 3 3 3 3 3 3 3 3 1 1 1 2 2 2 3 3 3 1 1 1 2 2 2 3 3 3 1 1 1 2 2 2 3 3 3 1 1 1 2 2 2 3 3 3 2 2 2 3 3 3 1 1 1 3 3 3 1 1 1 2 2 2 1 1 1 2 2 2 3 3 3 3 3 3 1 1 1 2 2 2 2 2 2 3 3 3 1 1 1 1 2 3 1 2 3 1 2 3 1 2 3 1 2 3 1 2 3 1 2 3 1 2 3 1 2 3 1 2 3 1 2 3 1 2 3 2 3 1 2 3 1 2 3 1 3 1 2 3 1 2 3 1 2 1 2 3 1 2 3 1 2 3 3 1 2 3 1 2 3 1 2 2 3 1 2 3 1 2 3 1 1 2 3 2 3 1 3 1 2 1 2 3 2 3 1 3 1 2 1 2 3 2 3 1 3 1 2 1 2 3 2 3 1 3 1 2 2 3 1 3 1 2 1 2 3 3 1 2 1 2 3 2 3 1 1 2 3 2 3 1 3 1 2 3 1 2 1 2 3 2 3 1 2 3 1 3 1 2 1 2 3 1 2 3 3 1 2 2 3 1 1 2 3 3 1 2 2 3 1 1 2 3 3 1 2 2 3 1 1 2 3 3 1 2 2 3 1 2 3 1 1 2 3 3 1 2 3 1 2 2 3 1 1 2 3 1 2 3 3 1 2 2 3 1 3 1 2 2 3 1 1 2 3 2 3 1 1 2 3 3 1 2 Three parameters viz combined pressure velocity (pv) factor, sliding distance and percentage of filler content and each at three levels are considered in this study. Three parameters each at three levels would require Taguchi’s factorial experiment approach to 27 runs only offering a great advantage.  374 S.R. Chauhan, Anoop Kumar, I. Singh, and Prashant Kumar Vol.9, No.4 The experimental observations are transformed into a signal-to-noise (S/N) ratio. There are several S/N ratios available depending on the type of characteristics. The S/N ratio for minimum (friction and wear rate) coming under smaller is better characteristic, which can be calculated as logarithmic transformation of the loss function as shown below.Smaller is the better characteristic [32] S N10 log1 ny y y Where ‘n’ is the repeated number trial conditions and y1, y2….yn are the response of the friction and sliding wear characteristics. ‘‘Lower is better” (LB) characteristic, with the above S/N ratio transformation is suitable for minimizations of coefficient of friction and specific wear rate. The standard linear graph is used to assign the factors and interactions to various columns of the orthogonal array. The plan of the experiments is as follows: The first column was assigned to( pv) factor (A), the second column to sliding distance (B), the fifth column to filler content (C), the third and fourth column are assigned to (A x B)1 and (A x B)2, respectively to estimate interaction between (pv) factor (A) and sliding distance (B), the sixth and seventh column are assigned to (A x C)1 and (A x C)2, respectively, to estimate interaction between the (pv) factor (B) and filler content (C), the eighth and eleventh column are assigned to (B x C)1 and (B x C)2, respectively, to estimate interaction between the sliding distance (B) and filler content (C). The remaining columns are assigned to error columns, respectively. 4. RESULTS AND DISCUSSIONS 4.1 Analysis of Experimental Results The experimental data for coefficient of friction and specific wear rate is reported in the Table 4. The data reported is the average of two replications. From Table 4 the overall mean for the S/N ratio of the coefficient of friction and the specific wear rate are found to be 10.6118 db and 112.109 db respectively. The analyses of the experimental data are carried using the software MINITAB 15 specially used for design of experiment applications. Before analyzing the experimental data using this method for predicting the measure of performance, the possible interactions between control factors are considered. Thus factorial design incorporate a simple means of testing for the presence of the interaction effects. The mean response refers to the average values of the performance characteristics for each parameter at different levels i.e. of coefficient of friction and specific wear rate.  Vol.9, No.4 Effect of Fly Ash Content on Friction and Dry Sliding Wear Behavior 375 375 Table 4. Experimental Design using L27 array. Expt. No. (pv) factor (MPa m/s) Sliding distance ( m) Fly ash content (%) Coefficient of friction (µ) S/N ratio (db) Specific Wear rate Ks (mm3/Nm) S/N ratio (db) 1 0.53 1000 0 0.34 9.370422 0.0000042 107.535 2 0.53 1000 10 0.32 9.897 0.000004 107.9588 3 0.53 1000 20 0.29 10.75204 0.0000035 109.1186 4 0.53 2000 0 0.36 8.87395 0.0000034 109.3704 5 0.53 2000 10 0.32 9.897 0.0000032 109.897 6 0.53 2000 20 0.3 10.45757 0.000003 110.4576 7 0.53 3000 0 0.37 8.6359660.0000036 108.8739 8 0.53 3000 10 0.35 9.1186390.0000032 109.897 9 0.53 3000 20 0.32 9.897 0.0000028 111.0568 10 2.8 1000 0 0.42 7.5350140.0000027 111.3727 11 2.8 1000 10 0.34 9.3704220.0000024 112.3958 12 2.8 1000 20 0.28 11.05684 0.000002 113.9794 13 2.8 2000 0 0.34 9.3704220.0000025 112.0412 14 2.8 2000 10 0.32 9.897 0.0000021 113.5556 15 2.8 2000 20 0.31 10.17277 0.0000019 114.4249 16 2.8 3000 0 0.36 8.87395 0.0000022 113.1515 17 2.8 3000 10 0.28 11.05684 0.0000022 113.1515 18 2.8 3000 20 0.32 9.897 0.0000017 115.391 19 6.7 1000 0 0.28 11.05684 0.0000016 115.9176 20 6.7 1000 10 0.25 12.0412 0.0000015 116.4782 21 6.7 1000 20 0.22 13.15155 0.0000013 117.7211 22 6.7 2000 0 0.26 11.70053 0.0000017 115.391 23 6.7 2000 10 0.19 14.42493 0.0000015 116.4782 24 6.7 2000 20 0.22 13.15155 0.0000013 117.7211 25 6.7 3000 0 0.26 11.70053 0.0000015 116.4782 26 6.7 3000 10 0.24 12.39578 0.0000014 117.0774 27 6.7 3000 20 0.23 12.76544 0.0000012 118.4164  376 S.R. Chauhan, Anoop Kumar, I. Singh, and Prashant Kumar Vol.9, No.4 Table 5 (a). ANOVA table for Coefficient of friction Source DF Seq SS Adj SS Adj MS F P(%) A 2 47.5080 47.5080 23.7540 56.04 68.53 B 2 0.9927 0.9927 0.4963 1.17 1.43 C 2 12.2976 12.2976 6.1488 14.51 17.74 A*B 4 2.3304 2.3304 0.5826 1.37 3.36 A*C 4 0.7461 0.7461 0.1865 0.44 1.08 B*C 4 2.0579 2.0579 0.5145 1.21 2.97 Residual Error 8 3.3910 3.3910 0.4239 4.89 Total 26 69.3236 100.00 Table 5 (b) Response table for Coefficient of friction Table 6 (a). ANOVA table for Specific wear rate Source DF Seq SS Adj SS Adj MS F P(%) A 2 253.406 253.406 126.703 1274.39 89.41 B 2 6.878 6.878 3.439 34.59 2.43 C 2 18.711 18.711 9.355 94.10 6.60 A*B 4 2.709 2.709 0.677 6.81 0.95 A*C 4 0.514 0.514 0.128 1.29 0.18 B*C 4 0.397 0.397 0.099 1.00 0.14 Residual Error 8 0.795 0.795 0.099 - 0.29 Total 26 283.409 100.00 Level A B C 1 9.656 10.470 9.680 2 9.692 10.883 10.900 3 12.488 10.482 11.256 Delta 2.832 0.413 1.576 Rank 1 3 2  Vol.9, No.4 Effect of Fly Ash Content on Friction and Dry Sliding Wear Behavior 377 377 Table 6 (b). Response Table for Specific wear rate Figures 1(a) and 3(a) show graphically the effect of the three control factors on coefficient of friction and specific wear rate of the composite specimens GV1, GV2 and GV3. The analysis of results gives the combination factors resulting in minimum coefficient of friction and specific wear rate of the composites. Analysis of these results leads to the conclusion that factors combination A3, B2 and C3 gives minimum coefficient of friction as shown in the Figure 1(a). The interaction graphs are shown in Figures 2 (a-c). From these Figures it is observed that the interaction AxB shows significant effect on the coefficient of friction. Similarly the combination of factors A3, B 3 and C3 gives minimum specific wear rate as shown in the Figure 3(a). The interaction graphs for parameters of specific wear rate are shown in Figures 4(a-c). It is observed that interaction AxB also has significant effect on the specific wear rate. 4.2 ANOVA and Effects of Factors In order to understand the impact of various control factors and interaction on the response of experimental data it is desirable to develop the analysis of variance (ANOVA) to find the significant factors as well as interactions. ANOVA allows analyzing the influence of each variable on the total variance of the results. Table 5(a) shows the results of ANOVA for the coefficient of friction and Table 6(a) shows the results of ANOVA for the specific wear rate. The analysis were performed with a level of significance of 5% i.e. level of confidence 95%.The last column of table shows the percentage contribution (P) of each variable in the total variation indicating the influence on the coefficient of friction and specific wear rate. If the value of (P) is less than 0.05 the control factor is statistically highly significant else statistically less significant. It can be observed from the ANOVA table 5(a) for coefficient of friction that the (pv) factor (P=68.53%), and Filler content (P=17.74%), interaction of (pv) factor (A) x (B) sliding distance (P=3.36%) has significant influence on the coefficient of friction. However sliding distance (P=1.43%), the interactions between (pv) factor x filler content (A x C) has (P=1.08% ) and for Level A B C 1 109.4 112.5 112.2 2 113.3 113.3 113.0 3 116.9 113.7 114.3 Delta 7.5 1.2 2.0 Rank 1 3 2  378 S.R. Chauhan, Anoop Kumar, I. Singh, and Prashant Kumar Vol.9, No.4 interaction between sliding distance x filler content (B x C) has (P=2.97% ) do not have a significant effect (both physically and statistical) on coefficient of friction as their values are quite smaller than error (P= 4.89%) so they are neglected. From the analysis of ANOVA and response Table 5(b) of the S/N ratio of coefficient of friction, it is observed that the control parameter (pv) factor has major impact on coefficient of friction followed by sliding distance and filler contents. The effect of increasing control variable (pv) factor, decreases the coefficient of friction as observed from the Figure 1(b). The higher (pv) factor values lead to increase in the surface temperature, this in turn causes thermal penetration to occur which weakens the bond at fiber matrix interface. Consequently the fiber becomes loose in the matrix and shear easily due to axial thrust. As a result coefficient of friction decreases [9]. Figure 1(a) Effect of control factor on Figure 1 (b) Effect of Mean Factor on Coefficient of friction Coefficient of friction  Vol.9, No.4 Effect of Fly Ash Content on Friction and Dry Sliding Wear Behavior 379 379 Figure 2 (a) Interaction graph for AX B for Figure 2 (b) Interaction graph for AXC for Coefficient of friction Coefficient of friction Figure2 (c) Interaction graph for BXC for Coefficient of friction Figure 3 (a) Effect of control factor on Figure 3 (b) Effect of Mean factor on Specific wear rate Specific wear rate  380 S.R. Chauhan, Anoop Kumar, I. Singh, and Prashant Kumar Vol.9, No.4 Figure 4(a) Interaction graph for AXB for Specific wear rate. Figure 4(b) Interaction graph for AXC for Specific wear rate. Figure 4 (c) Interaction graph for BXC for Specific wear rate.  Vol.9, No.4 Effect of Fly Ash Content on Friction and Dry Sliding Wear Behavior 381 381 (a) (b) (c) Figure 5 SEM pictures of (a) GV 1 (b) GV 2 and (c) GV 3 at (pv) 2.8 MPa m/s and sliding distance 3000m. In the same way from the ANOVA Table 6(a) for the specific wear rate it is observed that the (pv) factor (P=89.41%), Filler content (P=6.60%), sliding distance (P=2.43%), interaction (AxB) between (pv) factor x sliding distance (P=0.95%) have great influence on the specific wear rate and hence theses are physically and statistically highly significant. However interactions (Ax C) between (pv) factor x filler content (P=0.18%), (B x C) interaction between sliding distance x filler content (P=0.14%) have lesser effect on specific wear rate as error value ( P=0.29) is higher side hence less significant . From the analysis of ANOVA and response Table 6(b) of the S/N ratio for specific wear rate, it is observed that the (pv) factor has major impact on specific wear rate followed by filler content, sliding distance and interaction of (A x B).  382 S.R. Chauhan, Anoop Kumar, I. Singh, and Prashant Kumar Vol.9, No.4 The increasing of (pv) factor, sliding distance and filler content decreases the specific wear rate or increase the wear resistance as observed from the Figure 2(b). From the data it is observed that when (pv) factor and sliding distance increase the specific wear rate for fly ash filled composites in most of the cases decreases. This is because the fly ash particles are harder than the glass fiber and vinylester particles which are used for fabrication of composites. Due to this reason there is increase in brittle property of the composites and hence specific wear rate decreases [9,25]. There is appreciable reduction in specific wear rate of glass fiber reinforced vinylester composites with the addition of 10wt% - 20 wt% fly ash as secondary reinforcement and (pv) factor accounts for reduced specific wear rate since it has highest contribution for wear as observed from the Table 6 (a). At higher (pv) factor and filler contents the debris formed from the vinylester, glass fiber and fly ash particles is well spread also filler particles become smaller and forms the thin film at the counterface as observed from the Figures 5(b) and 5(c). Whereas for composite GV1 fiber breakage and fiber exposure is seen in Figure 5(a).This shows the higher specific wear rate of composite GV1. 4.3 Confirmation Experiments The confirmation experiment is the final step in the design of experiments process. The confirmation experiment is conducted to validate the inference drawn during the analysis phase. The confirmation experiment is performed by considering the new set of factor setting A2 ,B3,C2 to predict the coefficient of friction and for specific wear rate factor setting is A2 B1 C2. The estimated S/N ratio for coefficient of friction can be calculated with the help of following predictive equation [2, 32] Ā B A B Ā B C (1) Where is the predicted average, is overall experimental average and A B and is the mean response for factors and interactions at designed levels. By combining all the terms equation (1) reduces to η A B C T (2) A new combination of factor levels A2 B3 and C2 are used to predict the S/N ratio of coefficient of friction through predictive equation and is found to be =10.1015. For each of performance measures an experiment is conducted for different combination of factors and results are compared with those obtained from the predictive equation as shown in Table 7 (a). Similarly a prediction equation is developed for estimating S/N ration of specific wear rate as given by the equation [2,32] Ā B ĀB Ā B (3)  Vol.9, No.4 Effect of Fly Ash Content on Friction and Dry Sliding Wear Behavior 383 383 Where is the predicted average, is overall experimental average and ĀB and is the mean response for factors and interactions at designated levels. By combining all the terms equation (3) reduces to η A B C T (4) A new combination of factor levels A2 B 1 and C2 are used to predict the specific wear rate through predictive equation (4) and is found to be = 112.109. For each of performance measures an experiment is conducted for different combination of factors and results are compared with those obtained from the predictive equation as shown in Table 7(b). The resulting equations seem to be capable of predicting the coefficient of friction and specific wear rate to the acceptable level of accuracy. An error of 2.42% for the S/N ratio of the coefficient of friction and 1.14% for the S/N ratio of the specific wear rate is observed. However if number of observations of performance characteristics are increased further these errors can be reduced.This validates the statistical approach used for predicting the measures of performance based on knowledge of the input parameters. Table7 (a) Results of the confirmation experiments for the Coefficient of friction Optimal control parameters Prediction Experimental Level A2B3C2 A 2B3C2 S/N ratio for coefficient of friction (db) 10.1015 9.8568 Table7 (b) Results of the confirmation experiments for the Specific wear rate Optimal control parameters Prediction Experimental Level A2B1C2 A 2B1C2 S/N ratio for specific wear rate (db) 112.109 113.396 Linear regression technique is used to study the coefficient of friction and specific wear rate of the composites. The generalized linear regression equation for the experiment can be written as Ycf = a0+ a1 x A+ a2 x B+ a3 x C+ a4 x A x C (5) Y sw = a0+ a1 x A+a2 x B+ a3 x C+ a4 x A x C (6)  384 S.R. Chauhan, Anoop Kumar, I. Singh, and Prashant Kumar Vol.9, No.4 Here Ycf and Ysw is the performance output terms and ai ( i= 0, 1,…..4) are the model constants. These constants are calculated by using nonlinear regression analysis method using the software MINITAB 15. These coefficients are substituted in the equations (5) and (6) and following relations are obtained as shown in equations (7) and (8). Ycf =0.365 - 0.010964 A + 0.00000737 B - 0.0027778 C - 0.00000237 A*B (7) R2 = 82.7% Ysw = 0.00000357 - 0.00000041 A - 0.00000001 B + 0.00000004 C + 0.00000001 A*B (8) R2 = 81.6% The higher correlation coefficient (R2) confirms the suitability of the used equations and correctness of the calculated constants. 5. CONCLUSIONS Taguchi’s design of experiment method can be used to analyze the coefficient of friction and the dry sliding wear of polymer matrix composites as presented in this research paper. Fabrication of hybrid composites consisting of glass fiber reinforcement in vinylester filled with particulate filler fly ash is possible. The incorporation of fly ash particulate as secondary phase in the vinylester matrix improves the tribological characteristics. The coefficient of friction decreases with addition of 10wt%-20wt% of fly ash and wear resistance is increased for the addition of 10wt% - 20wt% of fly ash. (pv) is the main factor that has the highest physical and statistical significance in influencing the coefficient of friction and specific wear rate. Design of experiments approach by Taguchi method enabled successfully to analyze the friction and wear behavior of the composites with (pv) factor (combined pressure velocity), sliding distance and filler content as test variable. Effect of variables factor and sliding distance is more pronounced on the coefficient of friction of the composites than the fly ash as filler content. Effect of variables (pv) factor and filler content is more pronounced on the sliding wear of the composites. The effect of sliding distance on sliding wear rate of composites is insignificant. The predictive equations based on Taguchi approach is successfully used for the prediction of effect of various factors and predicted results are consistent with experimental observations. Therefore predicted results are satisfactory. Factorial design of the experiment can be successfully employed to describe the frictional and wear behavior of the composite samples and to develop the linear equations for predicting wear rate with selected experimental conditions.  Vol.9, No.4 Effect of Fly Ash Content on Friction and Dry Sliding Wear Behavior 385 385 REFERENCES [1] Pıhtılı H., Tosun N., 2002, “ Investigation of the wear behavior of a glass fibre-reinforced composite and plain polyester resin”J. Comp Sci Tech, Vol. 62 (3) pp. 367–370. [2] Amar Patnaik, Mahapatra S.S., 2009, “ Study on mechanical and erosion wear behavior of hybrid composites using Taguchi experimental design” J. Materials and Design, Vol. 30, pp. 2791-2801. [3] Chauhan S., Kumar A., Patnaik A., Satapathy A., Singh I., 2009, “ Mechanical and wear characterization of GF Reinforced vinylester resin composites with different co- monomers” J. Reinf. Plast. Compos.,Vol. 28, pp. 2675-2684. [4] Schwartz M.M., 1984, Composite Materials Handbook, McGraw-Hill, New York, USA. [5] Suresha B., Chandramohan G., Siddaramaiah,P.,Sampathkumaran,Seetharamu S., 2007, “Mechanical and three body abrasive wear behavior of 3-D glass fabric reinforced vinylester composites” J. Mater. Sci. Eng (A),Vol. 443, pp. 285–291. [6] Piggot, M. R., 1980, Load-Bearing Fibre Composite, Pergamon Press, Oxford. [7] Kukureka, S.N., Hooke, C. J., Rao, M., Liao, P., Chen, Y. K., 1999, “The effect of fibre- reinforcement on the friction and wear af polyamide 66 under dry rolling–sliding contact” Tribol. Int., Vol. 32, pp. 107–116. [8] Kishore P., et al, 2000, “SEM observations of the effects of velocity and load on the sliding wear characteristics of glass fabric–epoxy composites with different fillers” J.Wear, Vol. 237, pp. 20- 27. [9] El-Tayep N.S., Gadelrap R.M.,1996, “Friction and wear properties of E-glass fiber reinforced epoxy composites under different sliding contact conditions” J.Wear, Vol.192, pp.112–117. [10] Acosta J. L., Morales E., Ojeda M. C., Linares A., 1986, “ Effect of addition of sepiolite on the Mechanical properties of glass fiber reinforced polypropylene”, Angew Makromol Chem.,Vol. 138, pp.103-110. [11] Sawyer W. Gregory, Freudenberg Kevin D., Bhimaraj P., Schadler, Linda S., 2003, “ A study on the friction and wear behavior of PTFE filled with alumina nanoparticles” J. Wear,Vol. 254, pp. 573-580. [12] Jung-il Kim, Phil Hyun Kang, Young Chang Nho,1998, “Positive temperature coefficient behavior of polymer composites having a high melting temperature” Appl. Poly. Sci., Vol. 69, pp. 2593-2598. [13] Zhu K., Schmauder S., 2003, “Prediction of the failure properties of short fiber reinforced composites with metal and polymer matrix” Computational material Sci.,Vol. 28, pp.743- 748. [14] Rusu M., Sofian N etal., 2001, “ Mechanical and thermal properties of copper-powder- filled high density polyethylene composites. Polymer Testing”,Vol. 20, pp. 409-417.  386 S.R. Chauhan, Anoop Kumar, I. Singh, and Prashant Kumar Vol.9, No.4 [15] Serkan Tekce H., Dilek Kumlutas, 2007, “Effect of particle shape on thermal conductivity of copper reinforced polymer composites”, J. Reinf. Plast. and Comp., Vol. 26 (1), pp. 113-121. [16] Rothon.R.N.,1997, “Mineral fillers in thermoplastics: Filler Manufacture”. Adhesion,Vol. 64, pp.87-109. [17] Rothon.R.N.,1995,“Effects of particulate fillers on flame retardant properties of composites”J. Adv. Pol. Sci.,Vol. 139 pp. 67-107. [18] Suresha B., Chandramohan G., Prakash J.N, Balusamy V., Sankaranarayanasamy K., 2006, “The role of fillers on friction and slider wear characteristics in glass-epoxy composite system”, J. Mater. and Mater. Characterization and Engineering, Vol.5 (1), pp.87-101. [19] Briscoe B. J., Pogosion, A. K., Tabor, D., 1974, “ The friction and wear of high Density polyethylene; the action of lead oxide and copper oxide fillers”,J. Wear, Vol. 27, pp.19- 34. [20] Tanaka, K., 1986, “Effect of various fillers on the friction and wear of PTFE-based composites”, In: Friction and Wear of Polymer composites, Volume 205, pp. 137-174, (Friedrich K editor), Elsevier, Amsterdam. [21] Bahadur, S., Fu, Q., Gong, D., 1994, “The effect of reinforcement and the synergism between CuS and carbon fiber on the wear of nylon”. J.Wear,Vol. 178, pp. 123-130. [22] Yamaguchi Y., 1990, “ Tribology of plastic materials”,Tribology Series,Vol.16, Elsevier, New york. [23] Bahadur, S., Gong, D., Anderegg, J. W., 1992, “The role of copper composites as fillers in the transfer film formation and wear of Nylon”, J. Wear,Vol. 154, pp.207-223. [24] Bahadur, S., 2000, “The development of transfer layers and their role in polymer tribology”, J.Wear,Vol. 245, pp.92-99. [25] Kishore, Sampathkumaran, P., Seetharamu. S., Thomas, P., Janardhana, M. A., 2005, “ Study on the effect of the type and content of filler in epoxy-glass composite system on the friction and wear characteristics”, J.Wear, Vol.259, pp. 634-641. [26] Wang, J., Gu, M., Songhao, Ge. S., 2003, “The role of the influence of MoS2 on the tribological properties of carbon fiber reinforced Nylon 1010 composites”, J. Wear,Vol. 255, pp.774-779. [27] Basavarajappa,S., Chandramohan, G.C.,2005, “Wear studies on metal matrix composites: A Taguchi Approach”, J. Mater Sci. and Tech.,Vol. 21(6), pp.348-350. [28] Viswanath, B., Verma, A. P., Kameswara Rao, C. V. S., 1992, “Effect of matrix content on strength and wear of woven roving glass polymeric composites”, J. Comp. Sci. Tech., Vol. 44, pp. 77-86. [29] Mody, P.B., Chou, T.W., Friedrich,K.,1988, “Effect of testing conditions and microstructure on the sliding wear of graphite fiber/PEEK matrix composites”, J. Mater. Sci.,Vol. 23, pp.4319-4330.  Vol.9, No.4 Effect of Fly Ash Content on Friction and Dry Sliding Wear Behavior 387 387 [30] Chauhan S.R., Kumar Anoop , Singh I., 2009, “Study on the friction and sliding wear behaviour of woven S-glass fiber reinforced vinylester composite manufactured with different comonomers”, J. Mater. Sci., Vol. 44, pp.6338-6347. [31] Ross, P. J., 1993, Taguchi technique for quality engineering, Mc Graw-Hill, New York, pp.1-40. [32] Roy, K. R., 1990, A primer on Taguchi method, Van Nostrad reinhold, New York. [33] Basavarajappa, S., Chandrmohan, G., Mahadevan, A, Mukundan, Subramanian, R., Gopalakrishan, P., 2007, “Influence of sliding speed on the dry sliding wear behavior and the subsurface deformation of hybrid metal matrix composite.” Wear, Vol. 262, pp. 1007- 1012. [34] Taguchi, G.,1993, Taguchi on robust technology development methods, ASME press, New York, pp. 1-40. |