Paper Menu >>
Journal Menu >>
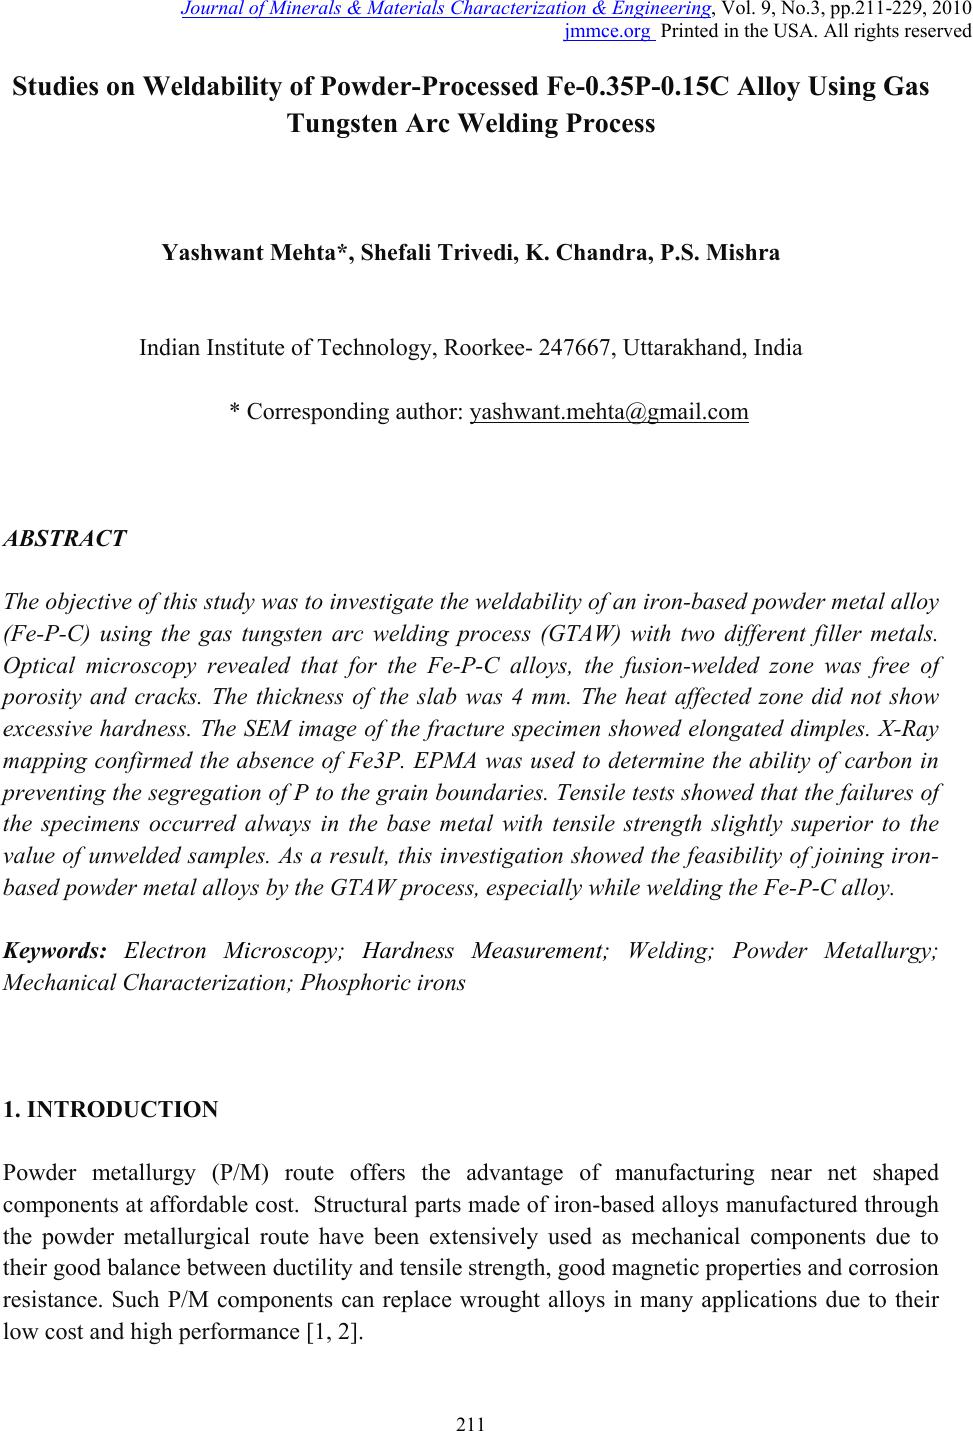 Journal of Minerals & Materials Characterization & Engineering, Vol. 9, No.3, pp.211-229, 2010 jmmce.org Printed in the USA. All rights reserved 211 Studies on Weldability of Powder-Processed Fe-0.35P-0.15C Alloy Using Gas Tungsten Arc Welding Process Yashwant Mehta*, Shefali Trivedi, K. Chandra, P.S. Mishra Indian Institute of Technology, Roorkee- 247667, Uttarakhand, India * Corresponding author : yashwant.mehta@gmail.com ABSTRACT The objective of this study was to investigate the weldability of an iron-based powder metal alloy (Fe-P-C) using the gas tungsten arc welding process (GTAW) with two different filler metals. Optical microscopy revealed that for the Fe-P-C alloys, the fusion-welded zone was free of porosity and cracks. The thickness of the slab was 4 mm. The heat affected zone did not show excessive hardness. The SEM image of the fracture specimen showed elongated dimples. X-Ray mapping confirmed the absence of Fe3P. EPMA was used to determine the ability of carbon in preventing the segregation of P to the grain boundaries. Tensile tests showed that the failures of the specimens occurred always in the base metal with tensile strength slightly superior to the value of unwelded samples. As a result, this investigation showed the feasibility of joining iron- based powder metal alloys by the GTAW process, especially while welding the Fe-P-C alloy. Keywords: Electron Microscopy; Hardness Measurement; Welding; Powder Metallurgy; Mechanical Characterization; Phosphoric irons 1. INTRODUCTION Powder metallurgy (P/M) route offers the advantage of manufacturing near net shaped components at affordable cost. Structural parts made of iron-based alloys manufactured through the powder metallurgical route have been extensively used as mechanical components due to their good balance between ductility and tensile strength, good magnetic properties and corrosion resistance. Such P/M components can replace wrought alloys in many applications due to their low cost and high performance [1, 2]. 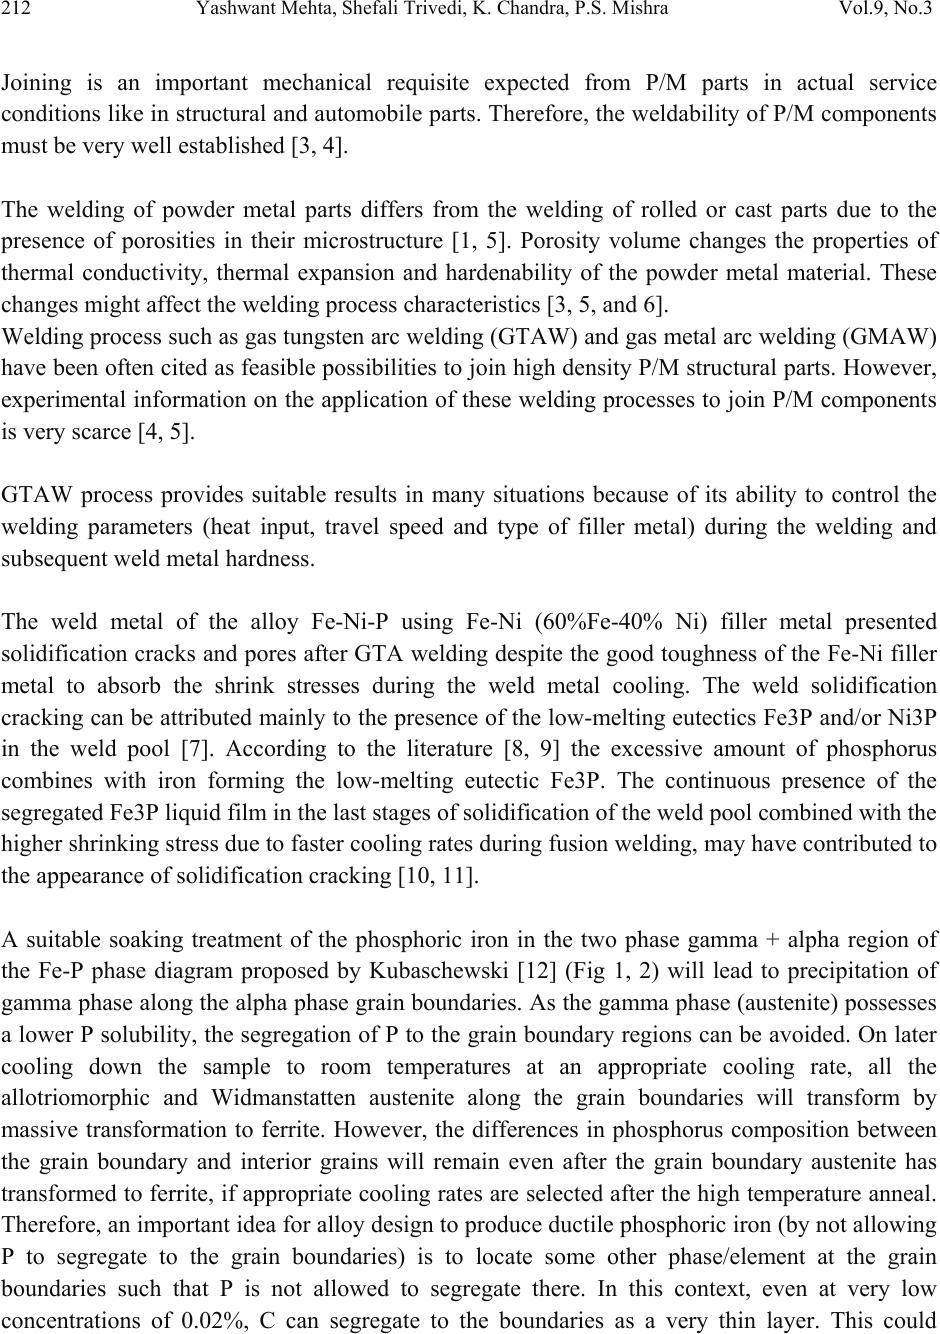 212 Yashwant Mehta, Shefali Trivedi, K. Chandra, P.S. Mishra Vol.9, No.3 Joining is an important mechanical requisite expected from P/M parts in actual service conditions like in structural and automobile parts. Therefore, the weldability of P/M components must be very well established [3, 4]. The welding of powder metal parts differs from the welding of rolled or cast parts due to the presence of porosities in their microstructure [1, 5]. Porosity volume changes the properties of thermal conductivity, thermal expansion and hardenability of the powder metal material. These changes might affec t the welding process characteristics [3, 5, and 6]. Welding process such as gas tungsten arc welding (GTAW) and gas metal arc welding (GMAW) have been often cited as feasible possibilities to join high density P/M structural parts. However, experimental information on the application of these welding processes to join P/M components is very scarce [4, 5]. GTAW process provides suitable results in many situations because of its ability to control the welding parameters (heat input, travel speed and type of filler metal) during the welding and subsequent weld metal hardness. The weld metal of the alloy Fe-Ni-P using Fe-Ni (60%Fe-40% Ni) filler metal presented solidification cracks and pores after GTA welding despite the good toughness of the Fe-Ni filler metal to absorb the shrink stresses during the weld metal cooling. The weld solidification cracking can be attributed mainly to the presence of the low-melting eutectics Fe3P and/or Ni3P in the weld pool [7]. According to the literature [8, 9] the excessive amount of phosphorus combines with iron forming the low-melting eutectic Fe3P. The continuous presence of the segregated Fe3P liquid film in the last stages of solidification of the weld pool combined with the higher shrinking stress due to faster cooling rates during fusion welding, may have contributed to the appearance of solidification cracking [10, 11]. A suitable soaking treatment of the phosphoric iron in the two phase gamma + alpha region of the Fe-P phase diagram proposed by Kubaschewski [12] (Fig 1, 2) will lead to precipitation of gamma phase along the alpha phase grain boundaries. As the gamma phase (austenite) possesses a lower P solubility, the segregation of P to the grain boundary regions can be avoided. On later cooling down the sample to room temperatures at an appropriate cooling rate, all the allotriomorphic and Widmanstatten austenite along the grain boundaries will transform by massive transformation to ferrite. However, the differences in phosphorus composition between the grain boundary and interior grains will remain even after the grain boundary austenite has transformed to ferrite, if appropriate cooling rates are sel ected after the high temperature anneal. Therefore, an important idea for alloy design to produce ductile phosphoric iron (by not allowing P to segregate to the grain boundaries) is to locate some other phase/element at the grain boundaries such that P is not allowed to segregate there. In this context, even at very low concentrations of 0.02%, C can segregate to the boundaries as a very thin layer. This could 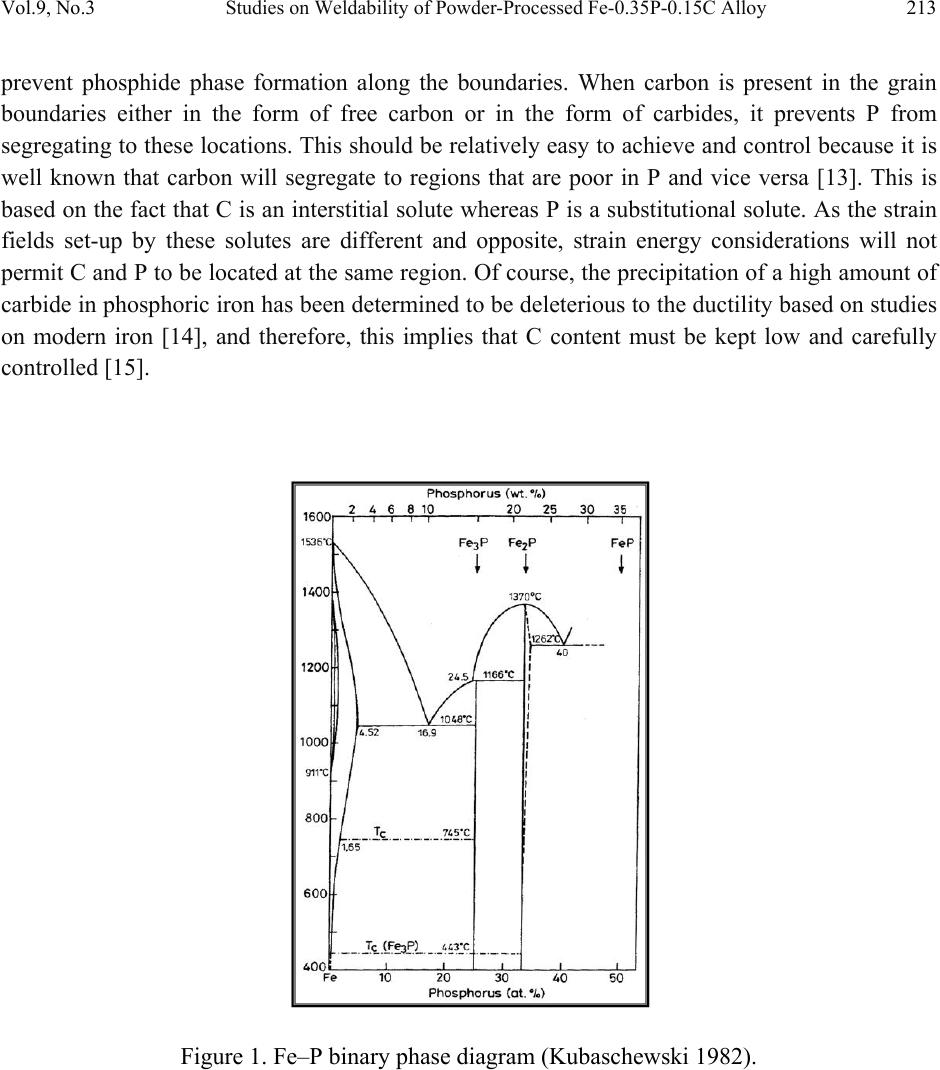 Vol.9, No.3 Studies on Weldability of Powder-Processed Fe-0.35P-0.15C Alloy 213 prevent phosphide phase formation along the boundaries. When carbon is present in the grain boundaries either in the form of free carbon or in the form of carbides, it prevents P from segregating to these locations. This should be relatively easy to achieve and control because it is well known that carbon will segregate to regions that are poor in P and vice versa [13]. This is based on the fact that C is an interstitial solute whereas P is a substitutional solute. As the strain fields set-up by these solutes are different and opposite, strain energy considerations will not permit C and P to be located at the same region. Of course, the precipitation of a high amount of carbide in phosphoric iron has been determined to be deleterious to the ductility based on studies on modern iron [14], and therefore, this implies that C content must be kept low and carefully controlled [15]. Figure 1. Fe–P binary phase diagram (Kubaschewski 1982).  214 Yashwant Mehta, Shefali Trivedi, K. Chandra, P.S. Mishra Vol.9, No.3 Fig. 2. High temperature gamma loop region of the Fe–P phase diagram (Kubaschewski 1982). Further, the effect of carbon additions to Fe-P alloys will be to broaden the duplex phase region since it is stabilizes gamma iron. At 1120 deg C carbon additions of 0.75 wt % will broaden the duplex region from about 0.6 wt % P to beyond 1.5 wt % P (Fig 3) [16]. This will allow more time for the site competition (segregation) between carbon and phosphorous to reach completion [17]. Figure 3. Isotherm of the ternary phase diagram Fe-P-C at 1120 °C. The circles represent specimen compositions used in the investiga tion. The white sector in each circle represent s th e amount of ferrite.  Vol.9, No.3 Studies on Weldability of Powder-Processed Fe-0.35P-0.15C Alloy 215 There is no literature data for the fusion welding of irons having more than 0.25 wt % phosphorous. Keeping in view the above discussion, this work was formulated in order to investigate the use of the GTAW process with two different filler metals (AWS 5.18 ER 70S-6 & Fe-0.35P-0.15C) in the weldability of powder metal iron-based alloy (Fe-0.35P-0.15C) and its effect in the microstructural and mechanical characteristics of the welded joint. The composition Fe-0.35P- 0.15C was deliberately chosen to obtain benefit from the two phase gamma + alpha region. 2. MATERIAL AND EXPERIMENTAL PROCEDURE For making Fe-P-C alloy by powder metallurgical technique the following raw materials were used. 2.1. Iron Powder Imported carbon- reduced iron powder Grade NC100.24 from M/S Hoeganas, Sweden having following specifica t ion w as u sed a s th e matrix metal : (a) Apparent density : 2.5 gm /cc (b) Flow : 30 sec /50 gm (c) Sieve analysis : + 149 µm - 7 Wt % max - 45 µm - 20 Wt % max -149 µm to + 45 µm - Balance 2.2. Iron Phosphide Powder Iron phosphide powder was indigenously prepared by mixing iron powder with required amount of ortho-phosphoric acid, so that the end product would contain 2.5 wt% P. While mixing with iron powder, ortho-phosphoric acid was diluted with 500 ml of distilled water to coat iron powder with phosphate film. The aforesaid acid would react with the surfaces of iron particles and form Fe3 (PO4)2 around the iron pa r ti c l e s u rf a c e. 3Fe + 2H3PO4 → Fe3 (PO4)2 + 3H2O The composite powder so produced was decanted and allowed to dry. The product at the iron particle surface i.e. Fe3 (PO4)2 would be converted to iron phosphide (Fe3P), during heating at 1150°C for 45 minutes in H2 atmosphere, whereas the core of the iron particles remained unaffected. The reaction would be as follows  216 Yashwant Mehta, Shefali Trivedi, K. Chandra, P.S. Mishra Vol.9, No.3 3Fe + Fe3 (PO4)2+8H2 →2 Fe3P +8H2O 2.3. Carbon Powder We have used natural crystalline graphite flakes (contains about 80% C; having size range -100 µm) which are considered to be the most suitable for the purpose of alloying with iron. Further, in powder metallurgy about 60% of this C is utilized for the purpose of alloying. Rest of the carbon converts itself into reducing gases which clean the surfaces of iron powder particles [18.]. Accordingly, the dissolved C content in our alloy system is expected to be about 0.072 wt %. 20% impurity of graphite will be present at the pores of the alloy slab. The powder blends were manually mixed to make desired alloy chemistry. About 500 g of each blended mixture was then poured into a mild steel capsule (as shown in Fig. 4). The encapsulated powders were heated in a tubular furnace at 1150 °C for 45 min in dry hydrogen atmosphere in order to remove the oxide layer from the surfaces of the powder particles. Heated capsules were then forged with a 200T capacity friction screw press to make slabs using a channel die. A Fe-P- C alloy processed by powder metallurgy was made in the present investigation. The specification of the powder metal alloy is given in Table 1. Fig. 4. Cross-section of mild steel capsule used in the present investigation. Table 1. Specification of the powder metal alloys. P/M alloy Chemical composition (wt %) Raw material P C Fe Fe Powder Particle size (Range) Apparent density Fe-P-C 0.35 0.15 Balance Hoeganas Sweden NC100.24 + 149 µm – 7 Wt % max - 45 µm – 20 Wt % max -149 µm to + 45 µm – Balance 2.5 gm/cc  Vol.9, No.3 Studies on Weldability of Powder-Processed Fe-0.35P-0.15C Alloy 217 The compositions of these alloys are based on the powder mixture. Fig. 5 schematically illustrates the process of making slabs through hot powder forging technique. The slabs were then homogenized at 1200°C for 2 h to eliminate compositional in-homogeneity. All the alloying elements are present in the form of fine particles around pure iron particles. This pure iron particle is 100% gamma-phase at the homogenizing temperature of 1200 °C as per the Fe-P phase diagram proposed by Kubaschewski [12] (Fig 1, 2). Phosphorous (in the form of ferro- phosphorous) combines with this gamma iron powder particle and dissolves in it. As it dissolves, it gets converted into ferrite (Fig 1, 2) and as ferrite phase grows out of gamma phase, more and more phosphorous penetrates in it. This helps carry any other alloying element in ferrite phase with the exception of carbon. This is because carbon has very low solubility in ferrite. Consequently, carbon is pushed towards gamma rich region [17]. As the homogenization proceeds, clear partitioning of alloying elements between ferrite and gamma iron takes place. At the end of homogenization, a major portion of carbon segregates in gamma iron region whereas phosphorous is concentrated in the ferrite region. After completion of homogenization and lowering of temperatures during furnace cooling there is no gamma phase left as per the equilibrium phase diagram, Carbon diffuses interstitially on cooling, into ferrite, thereby ensuring complete distribution of phosphorous and carbon. Mild steel encapsulation was then removed by machining. The slabs, after removal of mild steel skin, were hot rolled using flat roll at 900 °C to make 4 mm thick sheets. Rolling was carried out very slowly at 900 °C with 0.1 mm thickness reduction per pass. The rolling was done using small laboratory scale rolling mill with 10 cm roll diameter. The sheets were then vacuum annealed at 950 °C for 40 min to relieve the residual stresses. The alloy prepared in this way was characterized in terms of density, microstructure, hardness, and tensile properties. The powder metal samples (dimensions: 100mm×25mm×4mm) produced were welded in the butt joint, flat position with two different filler metals (AWS 5.18ER 70S-6, Fe-0.35P-0.15C) (Table 2) using one pass weld by a manual GTAW process.  218 Yashwant Mehta, Shefali Trivedi, K. Chandra, P.S. Mishra Vol.9, No.3 Fig. 5. Schematic diagram illustrating the production of slab by hot forging of encapsulated powder mixture.  Vol.9, No.3 Studies on Weldability of Powder-Processed Fe-0.35P-0.15C Alloy 219 Table 2. Composition of the filler metal. S.No. Name P C Si Mn Cu S C equiv Diameter 1 AWS 5.18ER70S-6 0.02 0.1 0.9 1.7 0.2 0.015 0.39 2 mm 2 Fe-0.35P-0.15C 0.35 0.15 - - - - - 2 mm The welding parameters used were the same for the two different filler alloys and were chosen after preliminary tests that ensured an arc stability and lower heat input. A flow rate of 18 lit/min of argon (99.99% purity) was used as a shielding gas. The travel speed was adjusted to give an adequate penetration and weld bead contour. These welding parameters are given in Table 3. The welding of the samples was done using ESAB ARISTO 2000 DC power source. Table 3. GTA Welding parameters Alloy Parameters Current (Amp) Voltage (V) Filler metal Fe-0.35P-0.15C 90 12 AWS 5.18ER70S-6 Fe-0.35P-0.15C 90 12 Fe-0.35P-0.15C Gas: Argon; Shielding gas flow rate: 18 lit/min; Polarity: DCEN After welding, the test samples were transverse sectioned, polished with Fe2O3 and etched with 2% nital reagent. Microstructural examination of the specimens was carried out using standard optical microscopy, scanning electronic microscopy (SEM) and electron probe micro-analyzer (EPMA). Vickers hardness values were taken across the transverse section using a 10 kgf load. The tensile test sample dimensions were non-standard with a guage length of 15 mm. 3. RESULTS AND DISCUSSION 3.1. Powder Metal Fe-P-C Alloy In general, phosphorus is intentionally added in powder metal iron to increase the densification of the iron powder since this element allows the formation of a transient liquid phase during sintering. Furthermore, phosphorus is known to improve the corrosion resistance and magnetic properties of the powder metal iron-based parts [19]. However, phosphorus additions are not particularly attractive for fusion welding applications because its presence in the metal base composition may promote solidification cracking. Therefore, the amount of phosphorus added in the alloy must be rigorously controlled [20]. During equilibrium cooling of the Fe-0.35P-0.15C, ferrite starts precipitating from molten base metal at about 1525 deg C and continues precipitating upto about 1330 deg C. Subsequently, 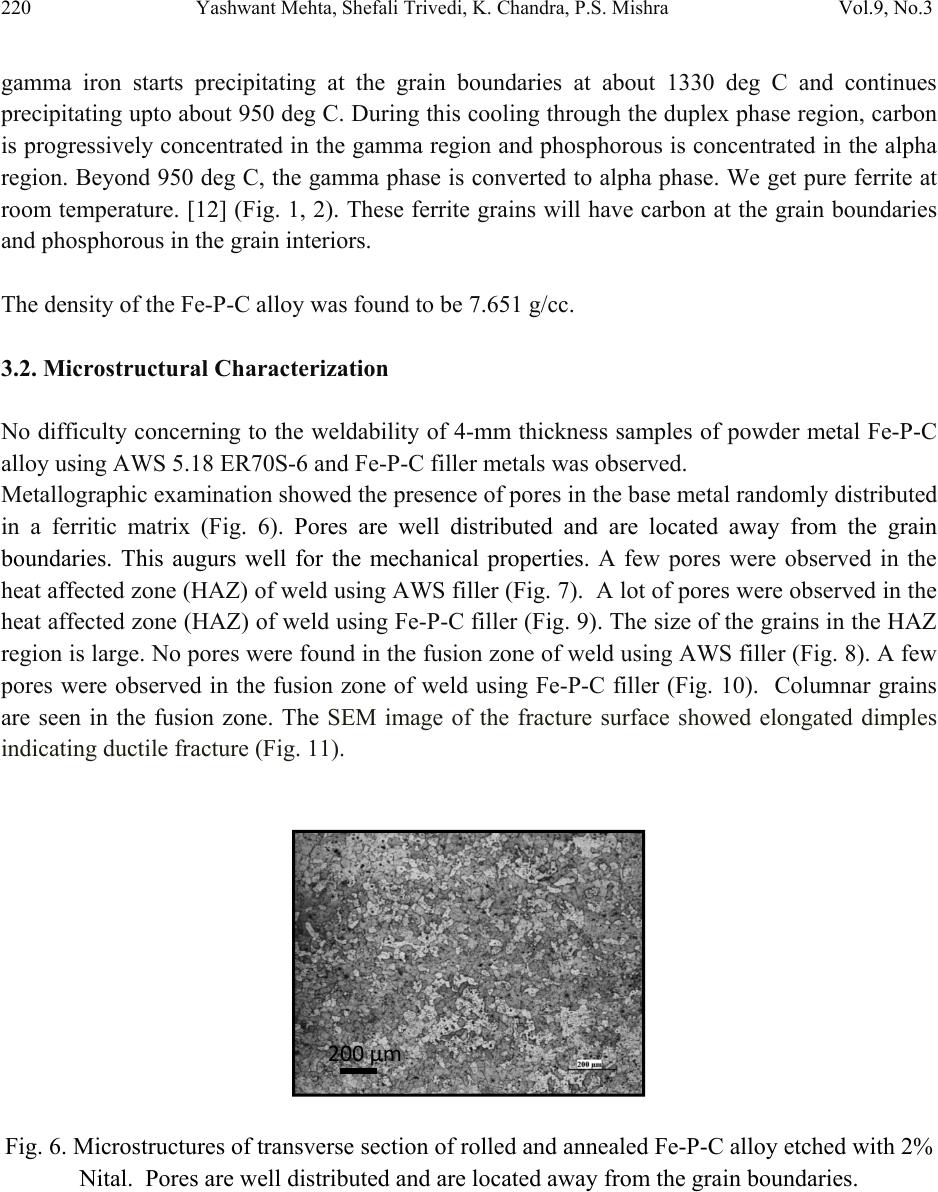 220 Yashwant Mehta, Shefali Trivedi, K. Chandra, P.S. Mishra Vol.9, No.3 gamma iron starts precipitating at the grain boundaries at about 1330 deg C and continues precipitating upto about 950 deg C. During this cooling through the duplex phase region, carbon is progressively concentrated in the gamma region and phosphorous is concentrated in the alpha region. Beyond 950 deg C, the gamma phase is converted to alpha phase. We get pure ferrite at room temperature. [12] (Fig. 1, 2). These ferrite grains will have carbon at the grain boundaries and phosphorous in the grain interiors. The density of the Fe-P-C alloy was found to be 7.651 g/cc. 3.2. Microstructural Characterization No difficulty concerning to the weldability of 4-mm thickness samples of powder metal Fe-P-C alloy using AWS 5.18 ER70S-6 and Fe-P-C filler metals was observed. Metallographic examination showed the presence of pores in the base metal randomly distributed in a ferritic matrix (Fig. 6). Pores are well distributed and are located away from the grain boundaries. This augurs well for the mechanical properties. A few pores were observed in the heat affected zone (HAZ) of weld using AWS filler (Fig. 7). A lot of pores were observed in the heat affected zone (HAZ) of weld using Fe-P-C filler (Fig. 9). The size of the grains in the HAZ region is large. No pores were found in the fusion zone of weld using AWS filler (Fig. 8). A few pores were observed in the fusion zone of weld using Fe-P-C filler (Fig. 10). Columnar grains are seen in the fusion zone. The SEM image of the fracture surface showed elongated dimples indicating ductile fracture (Fig. 11). Fig. 6. Microstructures of transverse section of rolled and annealed Fe-P-C alloy etched with 2% Nital. Pores are well distributed and are located away from the grain boundaries. 200µm 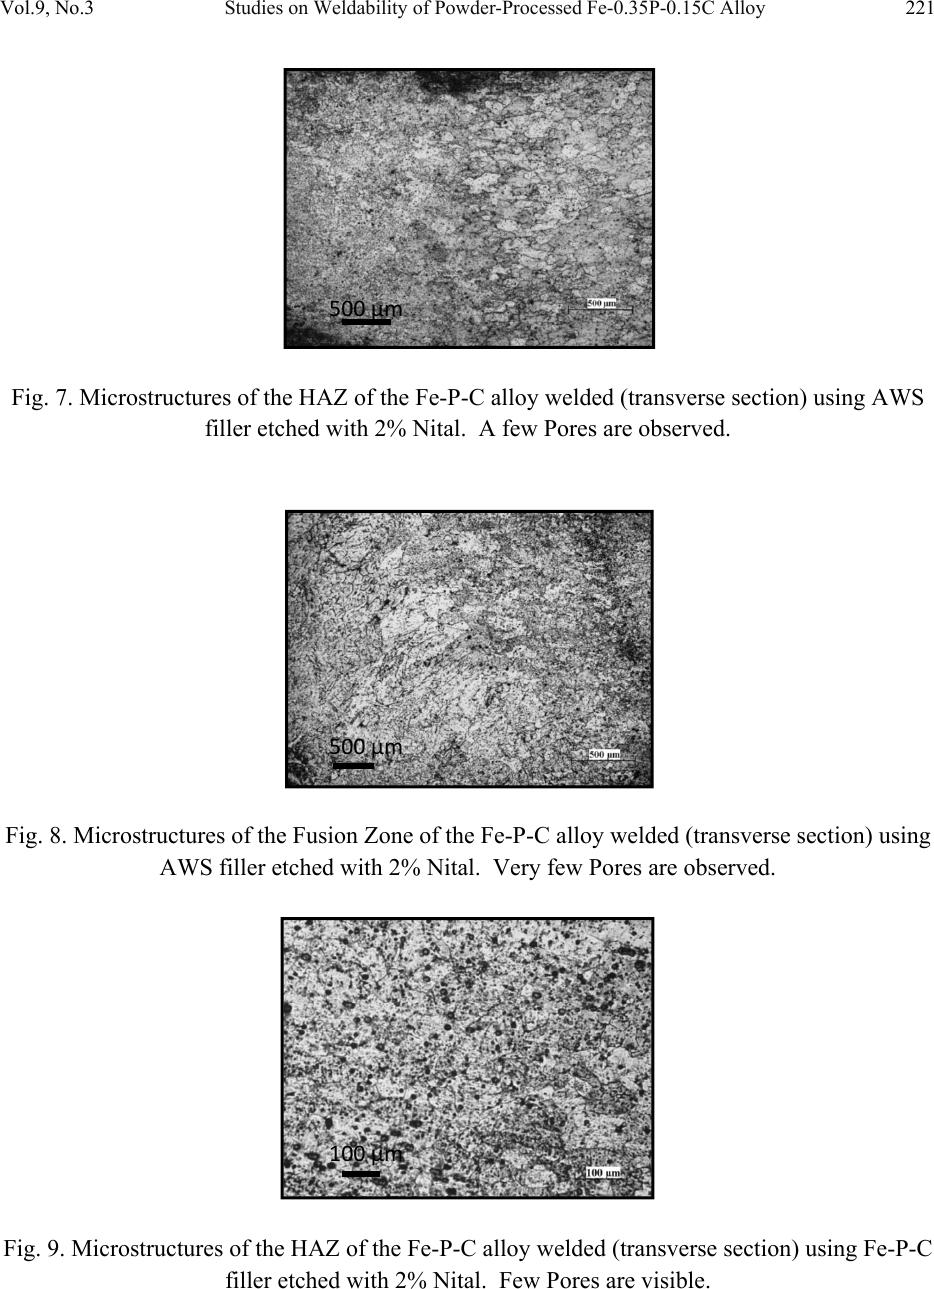 Vol.9, No.3 Studies on Weldability of Powder-Processed Fe-0.35P-0.15C Alloy 221 Fig. 7. Microstructures of the HAZ of the Fe-P-C alloy welded (transverse section) using AWS filler etched with 2% Nital . A few Pores are obs e r v e d . Fig. 8. Microstructures of the Fusion Zone of the Fe-P-C alloy welded (transverse section) using AWS filler etched with 2% Nital. Very few Pores are observed. Fig. 9. Microstructures of the HAZ of the Fe-P-C alloy welded (transverse section) using Fe-P-C filler etched with 2% Nital. Few Pores are visible. 500µm 500µm 100µm 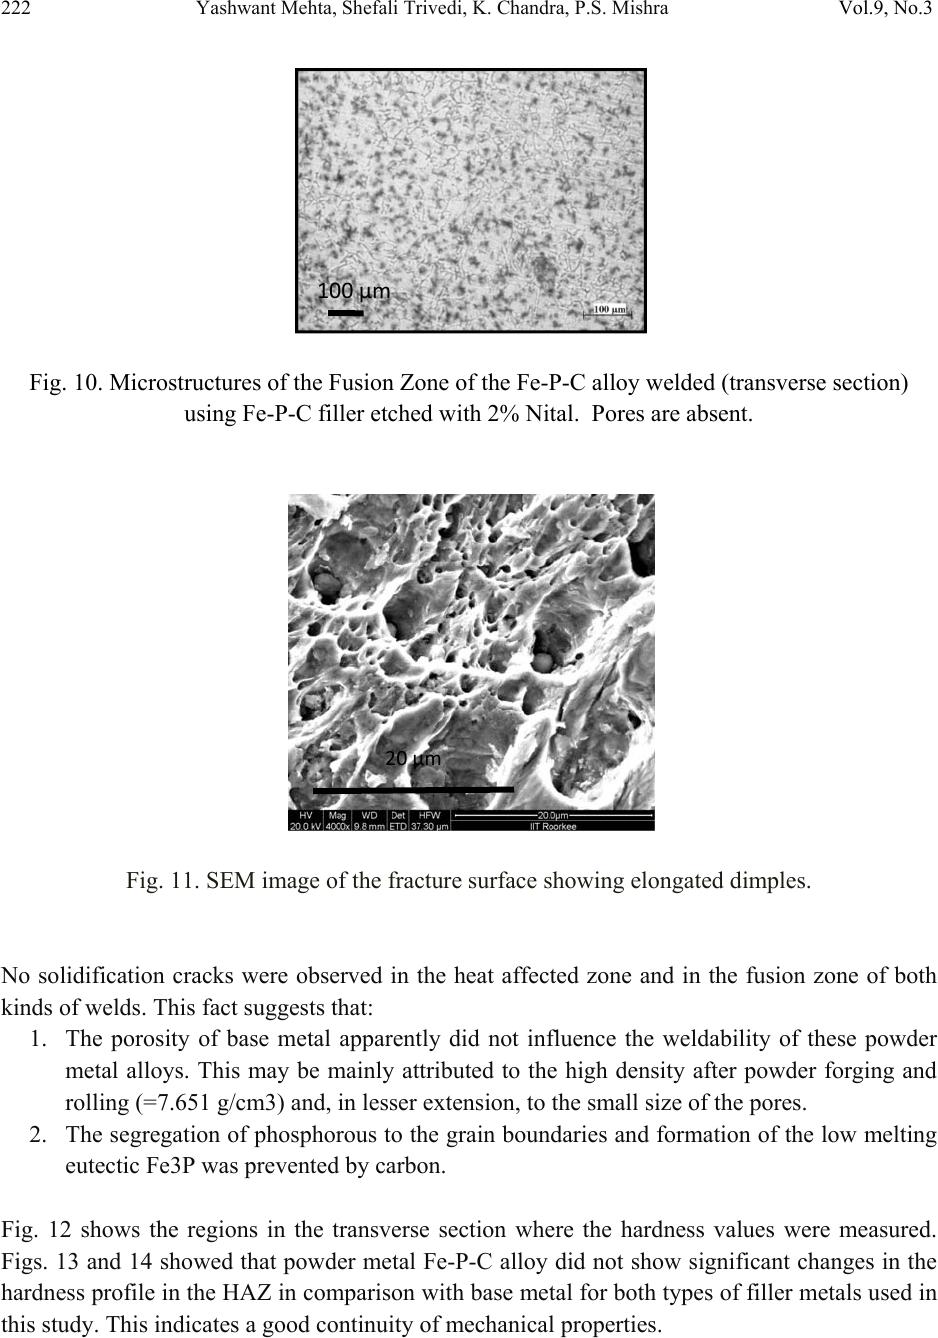 222 Yashwant Mehta, Shefali Trivedi, K. Chandra, P.S. Mishra Vol.9, No.3 Fig. 10. Microstructures of the Fusion Zone of the Fe-P-C alloy welded (transverse section) using Fe-P-C filler etched with 2% Nital. Pores are absent. Fig. 11. SEM image of the fracture surface showing elongated dimples. No solidification cracks were observed in the heat affected zone and in the fusion zone of both kinds of welds. This fact suggests that: 1. The porosity of base metal apparently did not influence the weldability of these powder metal alloys. This may be mainly attributed to the high density after powder forging and rolling (=7.651 g/cm3) and, in lesser extension, to the small size of the pores. 2. The segregation of phosphorous to the grain boundaries and formation of the low melting eutectic Fe3P was prevented by carbon. Fig. 12 shows the regions in the transverse section where the hardness values were measured. Figs. 13 and 14 showed that powder metal Fe-P-C alloy did not show significant changes in the hardness profile in the HAZ in comparison with base metal for both types of filler metals used in this study. This indicates a good continuity of mechanical properties. 100µm 20µm 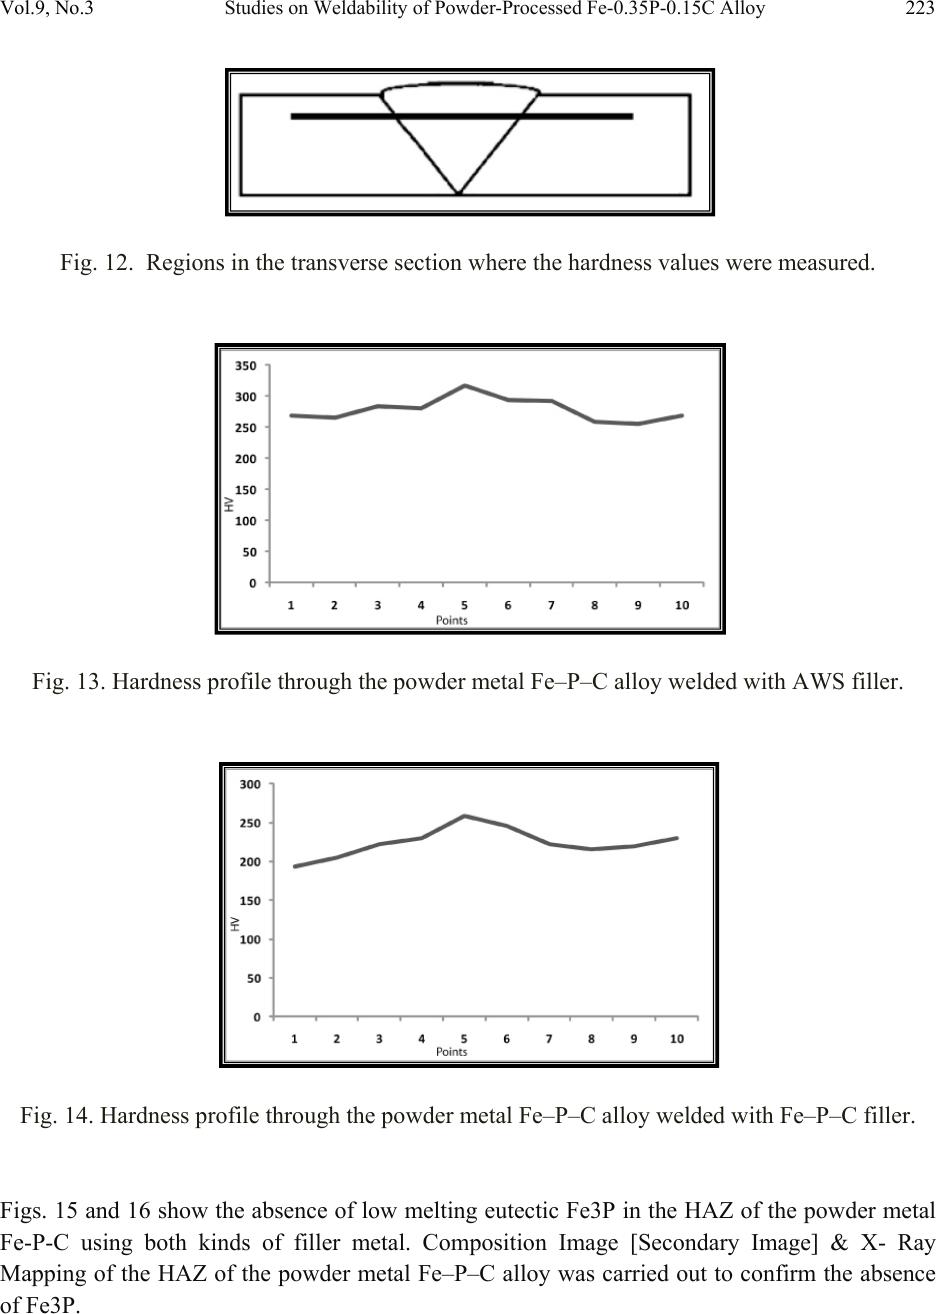 Vol.9, No.3 Studies on Weldability of Powder-Processed Fe-0.35P-0.15C Alloy 223 Fig. 12. Regions in the transverse section where the hardness values were measured. Fig. 13. Hardness profile through the powder metal Fe–P–C alloy welded with AWS filler. Fig. 14. Hardness profile through the powder metal Fe–P–C alloy welded with Fe–P–C filler. Figs. 15 and 16 show the absence of low melting eutectic Fe3P in the HAZ of the powder metal Fe-P-C using both kinds of filler metal. Composition Image [Secondary Image] & X- Ray Mapping of the HAZ of the powder metal Fe–P–C alloy was carried out to confirm the absence of Fe3P.  224 Yashwant Mehta, Shefali Trivedi, K. Chandra, P.S. Mishra Vol.9, No.3 Fig. 15. Composition Image [Secondary Image] & X- Ray Mapping of the HAZ of the powder metal Fe–P–C alloy welded with Fe–P–C filler. Fig. 16. Composition Image [Secondary Image] & X- Ray Mapping of the HAZ of the powder metal Fe–P–C alloy welded with AWS filler. Fig. 17 shows the EPMA analysis of the HAZ of the powder metal Fe–P–C alloy welded with AWS filler. Table 4 shows the results of the EPMA analysis. It is observed that feature A and B look like eutectic liquid but are not so. They could be the prior austenite grains which are converted to ferrite at lower temperatures. The analysis of feature B shows 98 % Fe and 0.31 % P. Feature C is a high silicon particle which could be an oxide inclusion/impurity or a SiC particle used in emery papers.  Vol.9, No.3 Studies on Weldability of Powder-Processed Fe-0.35P-0.15C Alloy 225 Fig. 17. EPMA analysis of the HAZ of the powder metal Fe–P–C alloy welded with AWS filler. Table 4. EPMA analysis of HAZ (AWS filler wire). Element Si P Fe Mo Ni Cu Al Mn TOTAL Feature A -0.01 0.35 98.35 0.020.060.1100.0898.96 Feature B 0.05 0.31 98.37 0.070.020.040.010.0798.94 Feature C 7.76 0.42 53.47 0.01-0.04-0.010.86062.47 Fig. 18 shows the EPMA analysis of the Fusion Zone of the powder metal Fe–P–C alloy welded with Fe–P–C filler. Table 5 shows the results of the EPMA analysis Here we see that the amount of P in the grain boundary (0.12 wt %) is lower than that at the grain interior (0.61 wt %), confirming the effect of Carbon on the grain boundary segregation of phosphorous (carbon could not be measured since the samples were coated with carbon before observation). Feature D could be an oxide inclusi o n / i m pu r i t y containing high silicon, phosphorous, etc. Fig. 18. EPMA analysis of the Fusion Zone of the powder metal Fe–P–C alloy welded with Fe– P–C filler.  226 Yashwant Mehta, Shefali Trivedi, K. Chandra, P.S. Mishra Vol.9, No.3 Table 5. EPMA analysis of Weld fusion zone(Fe-P-C filler wire). Feature Element P Fe Si Al Total Grain Interior 0.61 98.26 - - 98.87 Grain Boundary 0.12 98.79 - - 98.91 Feature D 2.71 70.48 2.02 0.47 74.68 3.3. Tensile Tests Tensile tests were carried out in the welded samples of the 4mm thickness of Fe-P-C powder metal alloy in the unannealed condition after welding. Results (Figs. 19, 20 & 21) showed that the failures of samples occurred always in the base metal. Furthermore, the welded samples presented ultimate tensile strength slightly higher than unwelded sample (Table 6). The higher tensile strength values from the welded samples may be attributed to the presence of residual stress in their base metal region. This residual stress arose due to the combination of three main factors: (1) Heat input adopted during welding, (2) The rapid cooling of the weld metal. (3) The small dimensions (width and length) of the samples which caused significant heating of the base metal. Even though these joints were welded by a fusion-welding method, the tensile tests results together with the hardness results indicated that welded joints of this material presented a good continuity of the mechanical properties w it h re l ation to the base metal. Fig. 19. Stress strain curve of unwelded Fe-P-C 4mm thick slab.  Vol.9, No.3 Studies on Weldability of Powder-Processed Fe-0.35P-0.15C Alloy 227 Fig. 20. Stress strain curve of Fe-P-C 4mm thick slab welded with AWS filler. Fig. 21. Stress strain curve of Fe-P-C 4mm thick slab welded with Fe-P-C filler.  228 Yashwant Mehta, Shefali Trivedi, K. Chandra, P.S. Mishra Vol.9, No.3 Table 6: Tensile properties of GTA welded alloys P/M alloys UTS (MPa) Total elongation (GL 20 mm, %) Fe-P-C 4 mm Base metal slab 287.3 39.3 Fe-P-C weld with AWS filler 464.9 30.0 Fe-P-C weld with Fe-P-C filler 333.6 37.4 4. CONCLUSIONS (a) No evidence of the formation of the low melting eutectic Fe3P was found. (b) Results from this study indicate that powder metal Fe-P-C alloy having 4mm thickness may be successfully joined by GTAW with filler metal of Fe-P-C alloy and AWS 5.18ER 70S-6. (c) Excessive hardening (loss of toughness) was not found in the weld metal and HAZ of the powder metal Fe-P-C alloy. This agrees with the slight increase of tensile properties of welded samples in comparison with unwelded samples. (d) The Delhi Iron Pillar containing 0.25 wt% P was joined by forge welding. The study proves that irons containing more than 0.25 wt % P i.e. 0.35 wt % P can be welded by fusion welding processes without substantial loss of ductility an d strength. REFERENCES 1. N. Chawla, X. Deng, Mater. Sci. Eng. Vol. 390 (2005) 98. 2. K.V. Sudhakar, P. Sampathkumaran, E.S. Dwarakadasa, Wear Vol. 242, (2000) 207. 3. J.A. Hamill, Weld. J. Vol. 2, (1993) 37-45. 4. K. Jayabharat, M. Ashafaq, P. Venugopal, D.R.G., Achar, Mater. Sci. Eng. Vol. 454-455 (2007) 114. 5. A. Kurt, H. Ates, A. Durgutlu, K. Karacif, Weld. J. Vol. 83 (12), (2004) 34. 6. F. Thummler, R. Oberacker, Introduction to Powder Metallurgy. Institute of Materials, London 1993.  Vol.9, No.3 Studies on Weldability of Powder-Processed Fe-0.35P-0.15C Alloy 229 7. E.O. Correa, S.C. Costa, J.N. Santos, J. Mater. Process. Technol. Vol. 209 (2009) 3937. 8. J.F. Lancaster, Metallurgy of Welding, 4th ed. George Allen & Unwin, London (1987). 9. J.C. Lippold, D.J. Kotecki, Welding Metallurgy and Weldability of Stainless Steel, 5th ed. John Willey & Sons, USA (2005). 10. ASM Handbook, Metallography and Microstructures, Vol. 9 (1999). 11. A.N. Briskman, Aut. Weld. Vol. 32 (7) (1979)40. 12. O Kubaschewski, Iron—Binary phase diagrams (Berlin: S prin ge r Verlag), (1982) 84 13. A. Bramley, F. W. Haywood, A. T. Coopers and J. T. Watts, Trans. Faraday Soc., Vol. 31 (1935)707 14. J. W. Stewart, J. A. Charles and E. R. Wallach, Mater. Sci.Technol. Vol. 16(3) (2000) 275. 15. R. Balasubramaniam and Gouthama, Bull. Mater. Sci., Vol. 26, No. 5, (2003) 483. 16. P. Lindskog, J. Tengzelius and S. A. Kvist, Modern Developments in Powder Metallurgy, Vol. 10, Ferrous and Nonferrous P/M Materials, (1977) 97. 17. H.Erhart and H. J. Grabke, Met. Sci. Vol. 15 issue 9 (1981) 401. 18. R. L. Sands and C. R. Shakespeare, Powder Metallurgy – Practice and applications, George Newnes Ltd. UK, (1966) 112 19. ASM Handbook, Heat Treating, Vol. 4 (1991). 20. E.O. Correa, S.C. Costa, J.N. Santos, J. Mater. Process. Technol. Vol. J. Mater. Process. Technol. Vol. 198 (2008) 323. |