Paper Menu >>
Journal Menu >>
 Journal of Minerals & Materials Characterization & Engineering, Vol. 8, No. 9, pp 715-727, 2009 jmmce.org Printed in the USA. All rights reserved 715 Characterization and Comparison of Corrosion Behavior of Nanostructured TiAlN and AlCrN Coatings on Superfer 800H (INCOLOY 800 H) Substrate Vikas Chawlaa*, D. Puria, S. Prakasha, Amita Chawlab, and Buta Singh Sidhuc a Metallurgical & Materials Engineering Department, I.I.T. Roorkee, Roorkee-247667, India b Chemistry Department, Government Brijindra College, Faridkot -151203, India c Mechanical Engineering Department, Y.C.E., Talwandi Saboo-151302,India *Corresponding author: edwalesir@rediff.com, Phone: +91-9417953530, Fax: +91-1332-285243 ABSTRACT Nitrided coatings have been used to increase hardness and to improve the wear and corrosion resistance of structural materials. In this work, TiAlN and AlCrN coatings were deposited on Superfer 800H (INCOLOY 800 H) substrate by using Balzer’s rapid coating system (RCS) machine (make Oerlikon Balzers, Swiss) under a reactive nitrogen atmosphere. The coated samples were subjected to optical microscopy (OM), XRD analysis, Field emission scanning electron microscope (FESEM with EDAX attachment), AFM analysis. The corrosion resistance of the substrate, TiAlN-coated and AlCrN-coated samples in a 3 wt% NaCl solution was evaluated and compared by electrochemical potentiodynamic polarization method. It was found that the AlCrN-coating exhibited better corrosion resistance. Keywords: Polarization, Tafel slope, Hard coatings, Corrosion, Physical vapour deposition. 1. INTRODUCTION Superalloys are extensively used in turbine blades of industrial gas turbines and jet engines [1]. Corrosion of iron /steel and superalloys is affected by the environment to which these are exposed [2]. In a wide variety of applications, for example, in aero and thermal power plants, mechanical components especially turbine engines have to operate under severe conditions, such as high load, speed, temperature and hostile chemical environment [3]. Mostly Cr and Al are added in Fe and Ni-based superalloys to enhance the oxidation resistance. When the superalloys were employed in jet engines, the resistance to pitting corrosion was 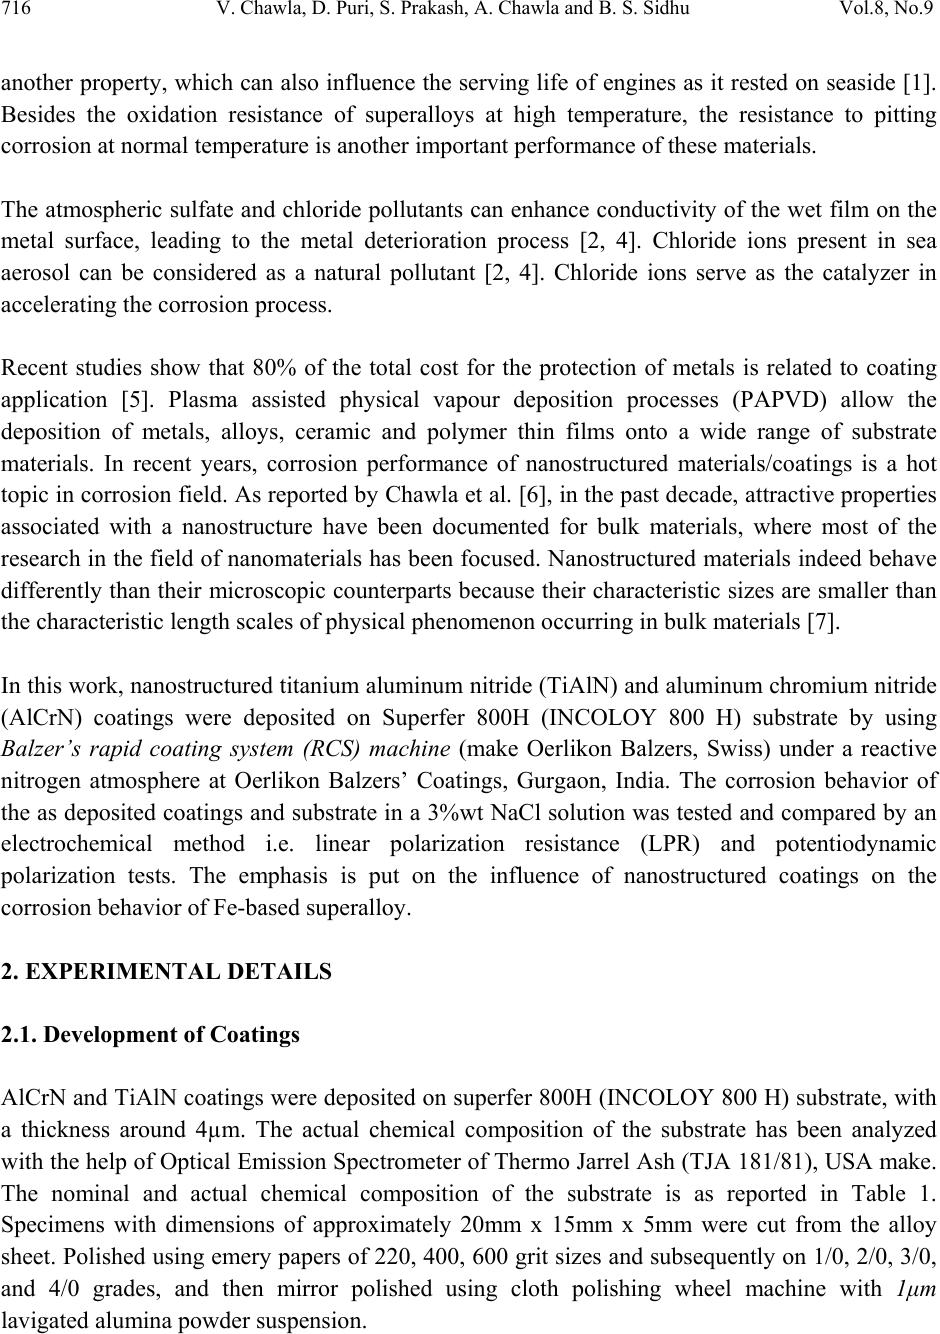 716 V. Chawla, D. Puri, S. Prakash, A. Chawla and B. S. Sidhu Vol.8, No.9 another property, which can also influence the serving life of engines as it rested on seaside [1]. Besides the oxidation resistance of superalloys at high temperature, the resistance to pitting corrosion at normal temperature is another important performance of these materials. The atmospheric sulfate and chloride pollutants can enhance conductivity of the wet film on the metal surface, leading to the metal deterioration process [2, 4]. Chloride ions present in sea aerosol can be considered as a natural pollutant [2, 4]. Chloride ions serve as the catalyzer in accelerating the corrosion process. Recent studies show that 80% of the total cost for the protection of metals is related to coating application [5]. Plasma assisted physical vapour deposition processes (PAPVD) allow the deposition of metals, alloys, ceramic and polymer thin films onto a wide range of substrate materials. In recent years, corrosion performance of nanostructured materials/coatings is a hot topic in corrosion field. As reported by Chawla et al. [6], in the past decade, attractive properties associated with a nanostructure have been documented for bulk materials, where most of the research in the field of nanomaterials has been focused. Nanostructured materials indeed behave differently than their microscopic counterparts because their characteristic sizes are smaller than the characteristic length scales of physical phenomenon occurring in bulk materials [7]. In this work, nanostructured titanium aluminum nitride (TiAlN) and aluminum chromium nitride (AlCrN) coatings were deposited on Superfer 800H (INCOLOY 800 H) substrate by using Balzer’s rapid coating system (RCS) machine (make Oerlikon Balzers, Swiss) under a reactive nitrogen atmosphere at Oerlikon Balzers’ Coatings, Gurgaon, India. The corrosion behavior of the as deposited coatings and substrate in a 3%wt NaCl solution was tested and compared by an electrochemical method i.e. linear polarization resistance (LPR) and potentiodynamic polarization tests. The emphasis is put on the influence of nanostructured coatings on the corrosion behavior of Fe-based superalloy. 2. EXPERIMENTAL DETAILS 2.1. Development of Coatings AlCrN and TiAlN coatings were deposited on superfer 800H (INCOLOY 800 H) substrate, with a thickness around 4µm. The actual chemical composition of the substrate has been analyzed with the help of Optical Emission Spectrometer of Thermo Jarrel Ash (TJA 181/81), USA make. The nominal and actual chemical composition of the substrate is as reported in Table 1. Specimens with dimensions of approximately 20mm x 15mm x 5mm were cut from the alloy sheet. Polished using emery papers of 220, 400, 600 grit sizes and subsequently on 1/0, 2/0, 3/0, and 4/0 grades, and then mirror polished using cloth polishing wheel machine with 1μm lavigated alumina powder suspension.  Vol.8, No.9 Characterization and Comparison of Corrosion Behavior 717 Table 1. Chemical composition (wt %) of Superfer 800H (INCOLOY 800 H) Elements C Mn Si Cr Ni Ti Al Fe Nominal 0.10 1.0 0.6 19.5 30.8 0.44 0.34 Bal. Actual 0.10 1.5 1.0 21.0 32.0 0.30 0.30 Bal. A front-loading Balzer’s rapid coating system (RCS) machine was used for the deposition of the coatings (Figure 1). The machine is equipped with 6 cathodic arc sources. Two of the six sources were used to deposit a thin, 0.3 μm thick TiN sub-layer to improve adhesion of coating. The remaining four sources were employed to deposit the main layer of the coatings, which was obtained using customized sintered targets. Figure 1. Schematic illustration of the coating device used for the film deposition [11]. The compositions of the targets used, coating thickness and the summary of the process parameters are presented in Table 2. For all coatings argon (Ar) and pure nitrogen atmosphere was used during deposition. Prior to deposition all the substrates were cleaned in two steps: firstly with Ultrasonic Pre-Cleaner (Imeco, Pune, India) and secondly with Ultrasonic Cleaning Machine with 9 Tanks including hot air dryer (Oerlikon Balzers Ltd. India) for 1.5 Hrs. 2.2 Characterization of the Coatings A Zeiss Axiovert 200 MAT inverted optical microscope, fitted with image software Zeiss Axiovision Release 4.1, was used for optical microscopy. The porosity measurements were made with image analyser, having software of Dewinter Materials Plus 1.01 based on ASTM B276.  718 V. Chawla, D. Puri, S. Prakash, A. Chawla and B. S. Sidhu Vol.8, No.9 Table 2. Summary of coating deposition parameters Machine used Standard balzers rapid coating system (RCS) machine Make Oerlikon Balzers, Swiss Targets composition for TiAlN coating: Ti, Ti 50Al50 AlCrN coating: Al70Cr30 Number of targets Ti (02), Ti 50Al50 (04) and Al70Cr30 (06) Targets power: 3.5 kW Reactive gas Nitrogen Nitrogen deposition 3.5 Pa pressure Substrate bias voltage -40V to -170V Substrate temperature 450°C ± 10°C Coating Thickness 4 µm ± 1 µm A PMP3 inverted metallurgical microscope was used to obtain the images. The surface morphology (2D and 3D) of the thin films was characterized by AFM (Model: NTEGRA, NT- MDT, Ireland) to calculate the surface roughness and particle size. The coated specimens were subjected to XRD analysis using Bruker AXS D-8 advance diffractometer (Germany) with Cu Kα radiation. The scan rate used was 2°/min and the scan range was from 20° to 120°. The grain size of the thin films was estimated from Scherrer formula, as given in Eq. (1). In this expression, the grain size D is along the surface normal direction, which is also the direction of the XRD diffraction vector. D=0.9λ / B cosθ (1) Where B is the corrected full-width at half maximum (FWHM) of a Bragg peak, λ is the X-ray wavelength, and θ is the Bragg angle. B is obtained from the equation B2=B2r-B2strain-C2, where Br is the FWHM of a measured Bragg peak, B strain= ε tan θ is the lattice broadening from the residual strain ε measured by XRD using the cos2α sin2ψ method, and C is the instrumental line broadening. Jayaganthan et al. [8] have also reported the particle size measurement by Scherrer formula. Field emission scanning electron microscope (FESEM, FEI, Quanta 200F Company) with EDAX Genesis software attachment (made in Czech Republic) is used to characterize the surface morphology of the coatings. SEM micrographs along with EDS spectrum were taken with an electron beam energy of 20keV.  Vol.8, No.9 Characterization and Comparison of Corrosion Behavior 719 2.3 Electrochemical Test In order to evaluate the corrosion behavior of the substrate and coatings, electrochemical methods i.e. linear polarization resistance (LPR) and potentiodynamic polarization tests were conducted in an aerated 3 wt% NaCl solution at room temperature. The linear polarization technique was preferred over Tafel polarization technique for monitoring corrosion current. The primary reason was that linear polarization scans were conducted in very small potential range (- 20mV to + 20mV vs Open Circuit Potential), which does not damage the surface of the sample, unlike Tafel scans, which require scanning over a longer potential range [9]. The electrolyte employed was prepared with NaCl analytical grade reagent with minimum assay 99.9 % (Art. No. 15915) supplied by Qualigens Fine Chemicals, Mumbai, India and deionised water. The potentiodynamic polarization test was carried out using EG&G PAR model 273A potentiostat. The test cell used was having the provisions in the form of circular openings of different sizes to permit the introduction of the two high purity graphite counter electrodes, the working electrode (test specimen) and the Luggin probe capillary tube, which housed the saturated calomel reference electrode (SCE). The tip of the Luggin probe capillary was placed near the sample. The exposed surface area of all specimens was 1 cm2 and the remaining portion except the exposed area was painted with good quality nail-paint in order to prevent the initiation of corrosion. Before the electrochemical measurements, samples were allowed to stabilize at their open circuit potential for 30 min. Potentiodynamic polarization measurements were carried out starting from -250 mVOCP to 1600 mVSCE with a scan rate of 0.5 mV/s. The potentiodynamic polarization plots were interpreted using SoftcorrTM III Corrosion Measurement software Version 2.30 provided by EG&G Instruments INC. All the experiments were repeated two times. 3. RESULTS & DISCUSSION 3.1 Microstructural Properties The TiAlN and AlCrN coatings have been formulated successfully by PAPVD technique on Superfer 800H (INCOLOY 800 H) substrate. Figure 2 shows the macrographs for TiAlN and AlCrN coatings. The surface appearance of AlCrN coating is light grey in color and violet grey in case of TiAlN coating. The optical micrographs of the substrate and thin coatings are depicted in Figure 3. The coatings have uniform microstructure. It is evident from the microstructure that the coatings contain some pores and inclusions. The porosity for as coated TiAlN and AlCrN coatings is 0.41 % and 0.48 % respectively and reported in Table 3.  720 V. Chawla, D. Puri, S. Prakash, A. Chawla and B. S. Sidhu Vol.8, No.9 Figure 2. Surface macrographs of (a) TiAlN and (b) AlCrN coatings on Superfer 800H (INCOLOY 800 H) substrate. Figure 3. Optical micrograph (200X) of the surface of (a) Substrate, (b) TiAlN coating and (c) AlCrN coating. ( a ) 5mm ( b ) 5mm (c) (b 50µm 50µm 50µm (a)  Vol.8, No.9 Characterization and Comparison of Corrosion Behavior 721 Table 3. Micro structural and mechanical properties of the coatings Coating Surface Hardness* Particle Size (nm) Porosity Friction Coating Roughness (HV 0.05) Scherrer AFM (%) coefficient color (nm) Formula Analysis against steel (dry) * TiAlN 02.62 3300 09 10 0.41 0.30-0.35 violet-grey AlCrN 05.99 3200 22 25 0.48 0.35 light-grey *Data supplied by at Oerlikon Balzers’ Coatings, Gurgaon, India. XRD diffractograms for each coating are depicted in Figure 4 on reduced scale. XRD analysis for AlCrN coating confirmed the presence of CrN and AlN phases. Further, in case of TiAlN coating the prominent phases are a large percentage of Ti2N along with AlN. From the XRD diffractograms, the grain size of the thin coatings was estimated from Scherrer formula as given in Eq. (1), and reported in Table 3. The grain size in case of TiAlN coatings (09 nm) is less than that of AlCrN coating (22 nm). Oerlikon Balzers Ltd. India provided the data regarding hardness and the friction coefficient against steel (dry), along with the coating parameters (Table 3). The coated layer on the steel substrate has provided higher hardness as compared to the substrate. TiAlN coating showed higher hardness value than AlCrN coating as reported in Table 3. 35 40 45 505560 6570 7580 85 TiAlN coating AlCrN Coating α CrN β AlN ε Ti N β β α β ε ε β α ε β ε α β Intensity (arbitrary units) Diffraction angle (2-Theta) Figure 4: X-ray diffraction pattern for TiAlN and AlCrN coatings on Superfer 800H  722 V. Chawla, D. Puri, S. Prakash, A. Chawla and B. S. Sidhu Vol.8, No.9 SEM micrographs along with EDAX analysis for as coated TiAlN and AlCrN coatings are shown in Figure 5. In case of TiAlN coating, the EDAX point analysis (Figure 5.a) shows the presence of Ti (45.53 %) as the main phase along with Al (23.35 %) and N (25.10 %). A very small amount of Ni, Fe, Cr and C is present, which may be due to the micro voids or pores present in the coating. Further in case of AlCrN coating, Cr (30.72 %), N (21.86 %) and Al (36.61 %) are the main phases along with small amount of Fe, C, Ni and Ti as indicated by the EDAX analysis (Figure 5.b). Figure 6 (a, b, c and d) shows the AFM surface morphology (2D and 3D) of the TiAlN and AlCrN coatings deposited on superfer 800H (INCOLOY 800 H) substrate. The difference in the morphology between the two coatings can be inferred by comparing the 2D images in Figure 6 (a) and (c); however a clearer comparison of the coatings is afforded by viewing 3D images in Figure 6 (b) and (d). As the axis scale indicates the overall roughness of the TiAlN coating, Figure 6 (b) is less than that of AlCrN coating, Figure 6 (d). The particle size in the coatings was also provided by AFM Analysis, which is reported in Table 3. The TiAlN coating is having lesser particle size (10 nm) as compared to AlCrN coating (25 nm). 3.2 Electrochemical Properties The initial corrosion current density and LPR (Rp) was measured by LPR test. The corrosion parameters obtained in LPR test are shown in Table 4. The corrosion current densities of the films were found much lower than that of the substrate. The TiAlN coating has performed very well and showed best corrosion resistance on the basis of corrosion current density and polarization resistance. So, initial stage corrosion protection is provided by the coatings. The corrosion rate ( icorr ) of the specimens was obtained using the Stern-Geary equation [9]. 1 2.303 ac a c Where βa = anodic Tafel slope, βc = cathodic Tafel slope, Rp = polarization resistance and, Z is a function of the Tafel slopes. Potentiodynamic polarization curves of the substrate and each film are shown in Figure 7 and the corrosion parameters in Table 5. The corrosion current density and the corrosion potential were obtained by the intersection of the extrapolation of anodic and cathodic Tafel curves. The corrosion current densities of the substrate and the films were found much lower as compared to the LPR test (at initial stage) results. As the substrate having composition (reported in Table 1) with higher percentage of Cr (approx. 20%) and Ni (approx. 30%), a protective oxide layer may have formed which has blocked further corrosion. (2)  Vol.8, No.9 Characterization and Comparison of Corrosion Behavior 723 Figure 5: SEM/EDAX analysis along with EDS spectrum for (a) TiAlN (X 200); (b) AlCrN coatings (X 200) on Superfer 800H (INCOLOY 800 H). (b) 45.53% Ti 23.35% Al 25.10% N 00.88% Ni 02.58% Fe 01.93% C 00.63 % Cr 30.72% Cr 36.61% Al 21.86% N 03.25% Ni 03.43% Fe 03.74 % C 00.39% Ti (b) (a) (a) 500µm 500µm  724 V. Chawla, D. Puri, S. Prakash, A. Chawla and B. S. Sidhu Vol.8, No.9 Figure 6: 2D and 3D AFM images of TiAlN [(a) & (b)] and AlCrN [(c) & (d)] coatings on Superfer 800H (INCOLOY 800 H). Table 4. Results of Linear polarization resistance tests Specimen Ecorr icorr Rp βa βc (mV) (µA/cm2) (kΩ-cm2 ) (V/decade) (V/decade) Substrate -204.2 05.37 4.042 0.1 0.1 TiAlN -284.4 0.338 64.14 0.1 0.1 AlCrN -416.9 0.474 45.73 0.1 0.1 (a) (b) (c) (d)  Vol.8, No.9 Characterization and Comparison of Corrosion Behavior 725 Table 5. Results of potentiodynamic polarization tests Specimen Ecorr icorr βa βc Rp Pi (mV) ( µA/cm2) (V/decade) (V/decade) (kΩ-cm2 ) (%) Substrate -97.33 0.058 0.2022 0.128 0586.89 -- TiAlN -220.9 0.068 0.0923 0.172 0383.55 Not Protecting AlCrN -194.7 0.021 0.0971 0.109 1049.52 63.79 -500 -450 -400 -350 -300 -250 -200 -150 -100 -50 0 50 -14-13-12-11-10-9-8-7-6-5-4-3-2 Substrate TiAlN Coating AlCrN Coating E (mV) I{ log(A/cm2)} Figure 7. Potentiodynamic Polarization Curves The corrosion product formed may have reduced the passage of the electrolyte to attack the samples, and hence providing protection. The AlCrN coating has performed very well and showed best corrosion resistance on the basis of corrosion current density and polarization resistance (Table 5).  726 V. Chawla, D. Puri, S. Prakash, A. Chawla and B. S. Sidhu Vol.8, No.9 From polarization test results, the protective efficiency, Pi (%) of the films can be calculated by Eq. (3): %1 ° 100 Where icorr and iocorr indicate the corrosion current density of the film and substrate, respectively [10]. The calculated protective efficiencies and polarization resistances are presented in Figure 8. The AlCrN film showed the highest protective efficiency of 63.79% caused by lowest corrosion current density of 0.021 µA/cm2. The observed protection by the TiAlN and AlCrN coatings in an aerated 3 wt% NaCl solution at room temperature, are almost in agreement with the findings of Xing-zhao et al. [11].The current density in case of TiAlN coating is also very low, but slightly more than that of the substrate. So, TiAlN coating is not providing the necessary protection to the substrate for longer duration. Liu et al. [1] reported the superior resistance of Ni-based superalloy nanocrystalline coating by sputtering to pitting corrosion in NaCl solution. Ye et al. [12] found that sputtered 309 SS nanocrystalline coating had a higher pitting resistance in comparison with its bulk material. Figure 8: Protective efficiency and Polarization resistance of TiAlN and AlCrN coatings on Superfer 800H (INCOLOY 800 H). 4. CONCLUSION The nanostructured TiAlN and AlCrN coatings were deposited successfully on superfer 800H (INCOLOY 800 H) by using Balzer’s rapid coating system (RCS) machine. The microstructural 586.89 1049.52 383.55 300 400 500 600 700 800 900 1000 1100 20 30 40 50 60 70 80 90 100 Substrate AlCrNCoating TiAlNCoating PolarizationResistance((kΩ‐cm2) ProtectiveEfficiency(%) ProtectiveEfficiency (%) PolarizationResistance ((kΩ‐cm2) (3)  Vol.8, No.9 Characterization and Comparison of Corrosion Behavior 727 morphologies and electrochemical properties of the coatings were investigated in the present work. Both the coatings have been found to possess low porosity. The XRD and SEM/EDAX analysis confirmed the formation of the requisite composition of the coatings. The AFM studies revealed that the overall roughness and particle size of TiAlN coating is less than that of AlCrN coating. At the initial stage (LPR test), the corrosion current densities of the films in an aerated 3 wt% NaCl solution at room temperature were found much lower than that of the substrate steel. The coatings are providing necessary protection to the substrate initially. But, in longer run i.e. potentiodynamic polarization test, the AlCrN coating has performed very well and showed best corrosion resistance as evident from corrosion current density and polarization resistance. ACKNOWLEDGEMENT The authors wish to thank All India Council for Technical Education (A.I.C.T.E.), New Delhi, India for providing National Doctoral Fellowship (NDF) to Mr. Vikas Chawla (corresponding author) and grant under Nationally Coordinated Project (NCP). REFERENCES [1] Li Liu, Ying Li and Fuhui Wang, Electrochimica Acta, 52 (2007) 2392-2400. [2] Gadadhar Sahoo and R. Balasubramaniam, Journal of ASTM International, Vol.5, No. 5, Paper ID JaI101191, 2008. [3] R.A. Mahesh, R. Jayaganthan, S. Prakash, J Alloys and Compounds, 468 (2009)392-405. [4] Corvo, F., Betancourt, N., and Mendoza, A., Corros. Sci, 37,1995, 1889-1901. [5] L. Fedrizzi , S. Rossi , R. Cristel , P.L. Bonora , Elect. Chem. Acta 49 (2004) 2803– 2814. [6] Vikas Chawla, Buta Singh Sidhu, D. Puri and S. Prakash, J of the Australian ceramic society, 42 (2008) 56-62. [7] Vikas Chawla, S. Prakash and B.S. Sidhu, Materials and Manufacturing Processes, 22 (2007), 469-473. [8] Vipin Chawla, R. Jayaganthan, Ramesh Chandra. Materials Characterization. 2008; 59: 1015-1020. [9] Gadadhar Sahoo and R. Balasubramaniam, Corrosion Science, 50, 2008, 131-143. [10] Yun Ha Yoo, Diem Phong Le, Jung Gu Kim, Sun Kyu Kim, Pham Van Vinh. Thin Solid Films. 2008; 516: 3544-3548. [11] Xing-zhao Ding, A.L.K. Tan, X.T. Zeng, C. Wang, T. Yue, C.Q. Sun. Thin Solid Films. 516 (2008) 5716-5720. [12] W. Ye, y. li and F.H. Wang, Electrochim. Acta, 51 (2006), pp 4426. |