Paper Menu >>
Journal Menu >>
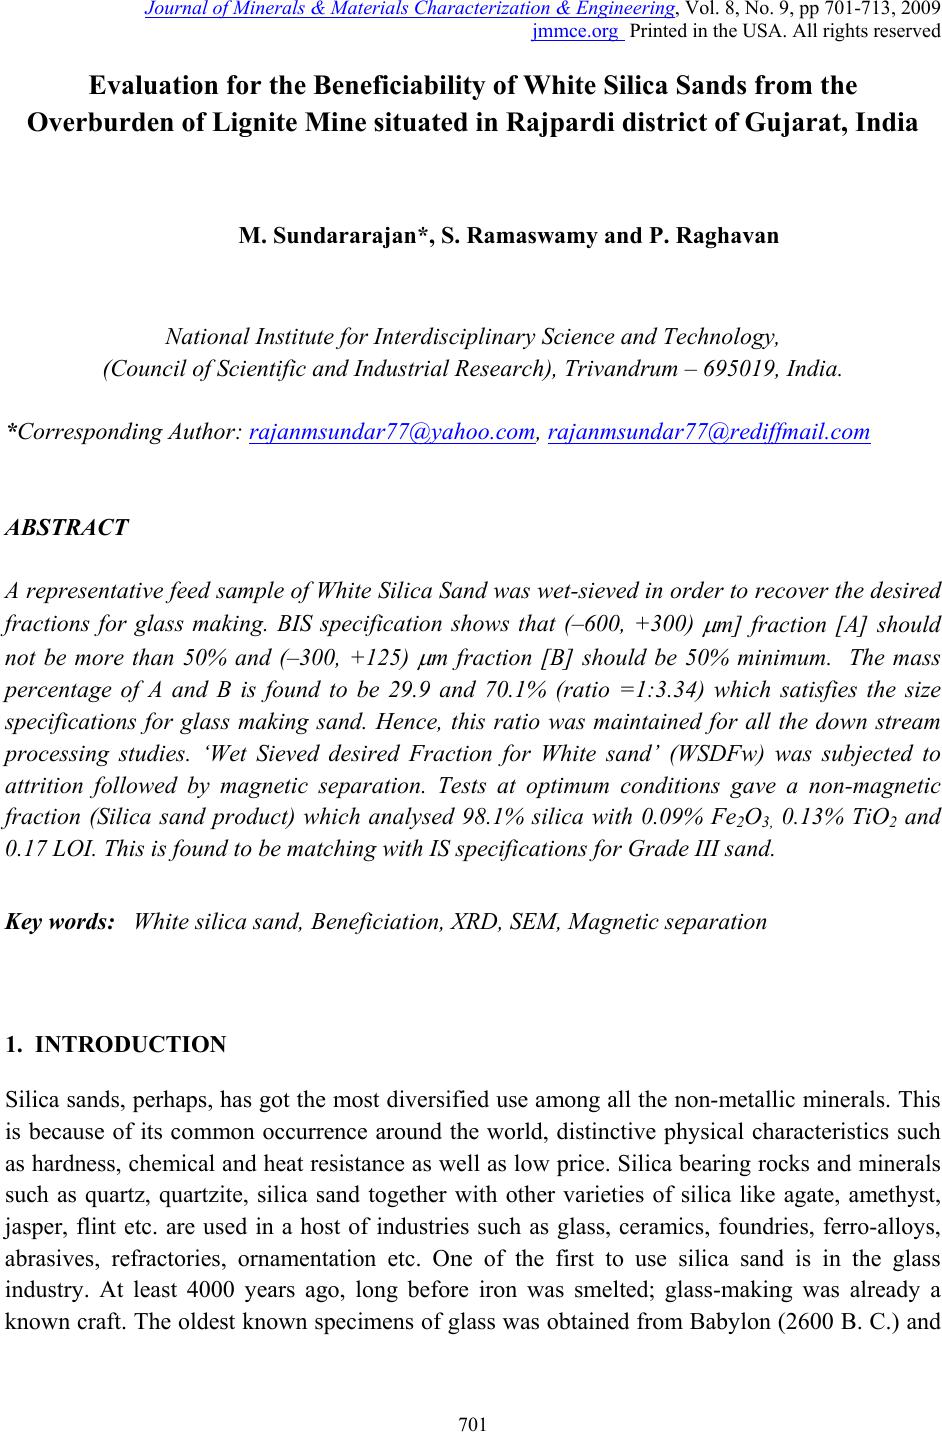 Journal of Minerals & Materials Characterization & Engineering, Vol. 8, No. 9, pp 701-713, 2009 jmmce.org Printed in the USA. All rights reserved 701 Evaluation for the Beneficiability of White Silica Sands from the Overburden of Lignite Mine situated in Rajpardi district of Gujarat, India M. Sundararajan*, S. Ramaswamy and P. Raghavan National Institute for Interdisciplinary Science and Technology, (Council of Scientif ic and Industrial Research), Trivandrum – 695019, India. *Corresponding Author: rajanmsundar77@yahoo.com, rajanmsundar77@rediffmail.com ABSTRACT A representative feed sample of White Silica Sand was wet-sieved in order to recover the desired fractions for glass making. BIS specification shows that (–600, +300) μ m] fraction [A] should not be more than 50% and (–300, +125) μ m fraction [B] should be 50% minimum. The mass percentage of A and B is found to be 29.9 and 70.1% (ratio =1:3.34) which satisfies the size specifications for glass making sand. Hence, this ratio was maintained for all the down stream processing studies. ‘Wet Sieved desired Fraction for White sand’ (WSDFw) was subjected to attrition followed by magnetic separation. Tests at optimum conditions gave a non-magnetic fraction (Silica sand product) which analysed 98.1% silica with 0.09% Fe2O3, 0.13% TiO2 and 0.17 LOI. This is found to be matching wi th IS specifications for Grade III sand. Key words: White silica sand, Beneficiation, XRD, SEM, Magnetic separation 1. INTRODUCTION Silica sands, perhaps, has got the most diversified use among all the non-metallic minerals. This is because of its common occurrence around the world, distinctive physical characteristics such as hardness, chemical and heat resistance as well as low price. Silica bearing rocks and minerals such as quartz, quartzite, silica sand together with other varieties of silica like agate, amethyst, jasper, flint etc. are used in a host of industries such as glass, ceramics, foundries, ferro-alloys, abrasives, refractories, ornamentation etc. One of the first to use silica sand is in the glass industry. At least 4000 years ago, long before iron was smelted; glass-making was already a known craft. The oldest known specimens of glass was obtained from Babylon (2600 B. C.) and 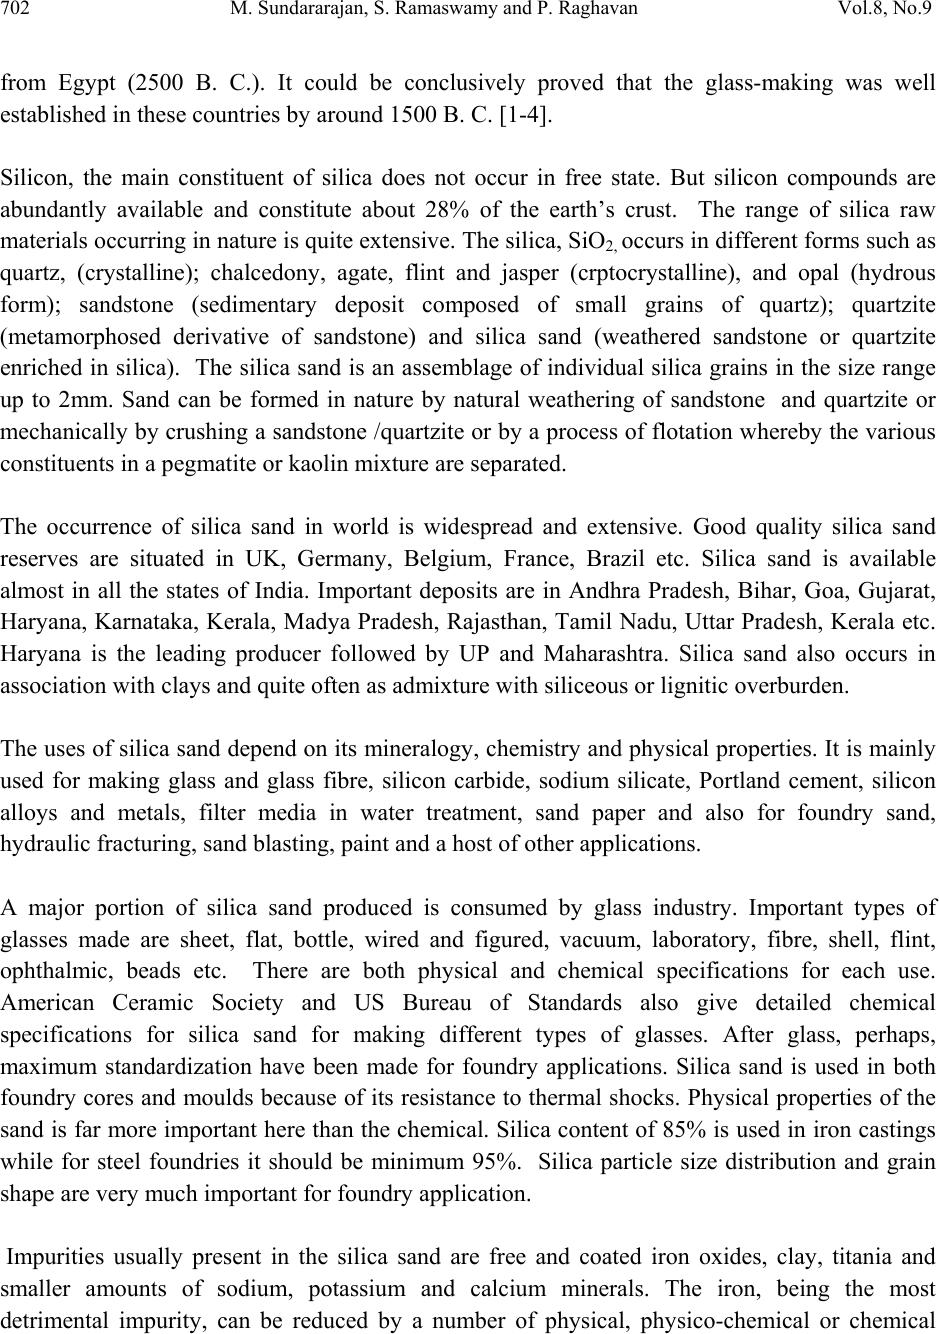 702 M. Sundararajan, S. Ramaswamy and P. Raghavan Vol.8, No.9 from Egypt (2500 B. C.). It could be conclusively proved that the glass-making was well established in these countries by around 1500 B. C. [1-4]. Silicon, the main constituent of silica does not occur in free state. But silicon compounds are abundantly available and constitute about 28% of the earth’s crust. The range of silica raw materials occurring in nature is quite extensive. The silica, SiO2, occurs in different forms such as quartz, (crystalline); chalcedony, agate, flint and jasper (crptocrystalline), and opal (hydrous form); sandstone (sedimentary deposit composed of small grains of quartz); quartzite (metamorphosed derivative of sandstone) and silica sand (weathered sandstone or quartzite enriched in silica). The silica sand is an assemblage of individual silica grains in the size range up to 2mm. Sand can be formed in nature by natural weathering of sandstone and quartzite or mechanically by crushing a sandstone /quartzite or by a process of flotation whereby the various constituents in a pegmatite or kaolin mixture are separated. The occurrence of silica sand in world is widespread and extensive. Good quality silica sand reserves are situated in UK, Germany, Belgium, France, Brazil etc. Silica sand is available almost in all the states of India. Important deposits are in Andhra Pradesh, Bihar, Goa, Gujarat, Haryana, Karnataka, Kerala, Madya Pradesh, Rajasthan, Tamil Nadu, Uttar Pradesh, Kerala etc. Haryana is the leading producer followed by UP and Maharashtra. Silica sand also occurs in association with clays and quite often as admixture with siliceous or lignitic overburden. The uses of silica sand depend on its mineralogy, chemistry and physical properties. It is mainly used for making glass and glass fibre, silicon carbide, sodium silicate, Portland cement, silicon alloys and metals, filter media in water treatment, sand paper and also for foundry sand, hydraulic fracturing, sand blasting, paint and a host of other applications. A major portion of silica sand produced is consumed by glass industry. Important types of glasses made are sheet, flat, bottle, wired and figured, vacuum, laboratory, fibre, shell, flint, ophthalmic, beads etc. There are both physical and chemical specifications for each use. American Ceramic Society and US Bureau of Standards also give detailed chemical specifications for silica sand for making different types of glasses. After glass, perhaps, maximum standardization have been made for foundry applications. Silica sand is used in both foundry cores and moulds because of its resistance to thermal shocks. Physical properties of the sand is far more important here than the chemical. Silica content of 85% is used in iron castings while for steel foundries it should be minimum 95%. Silica particle size distribution and grain shape are very much important for foundry application. Impurities usually present in the silica sand are free and coated iron oxides, clay, titania and smaller amounts of sodium, potassium and calcium minerals. The iron, being the most detrimental impurity, can be reduced by a number of physical, physico-chemical or chemical 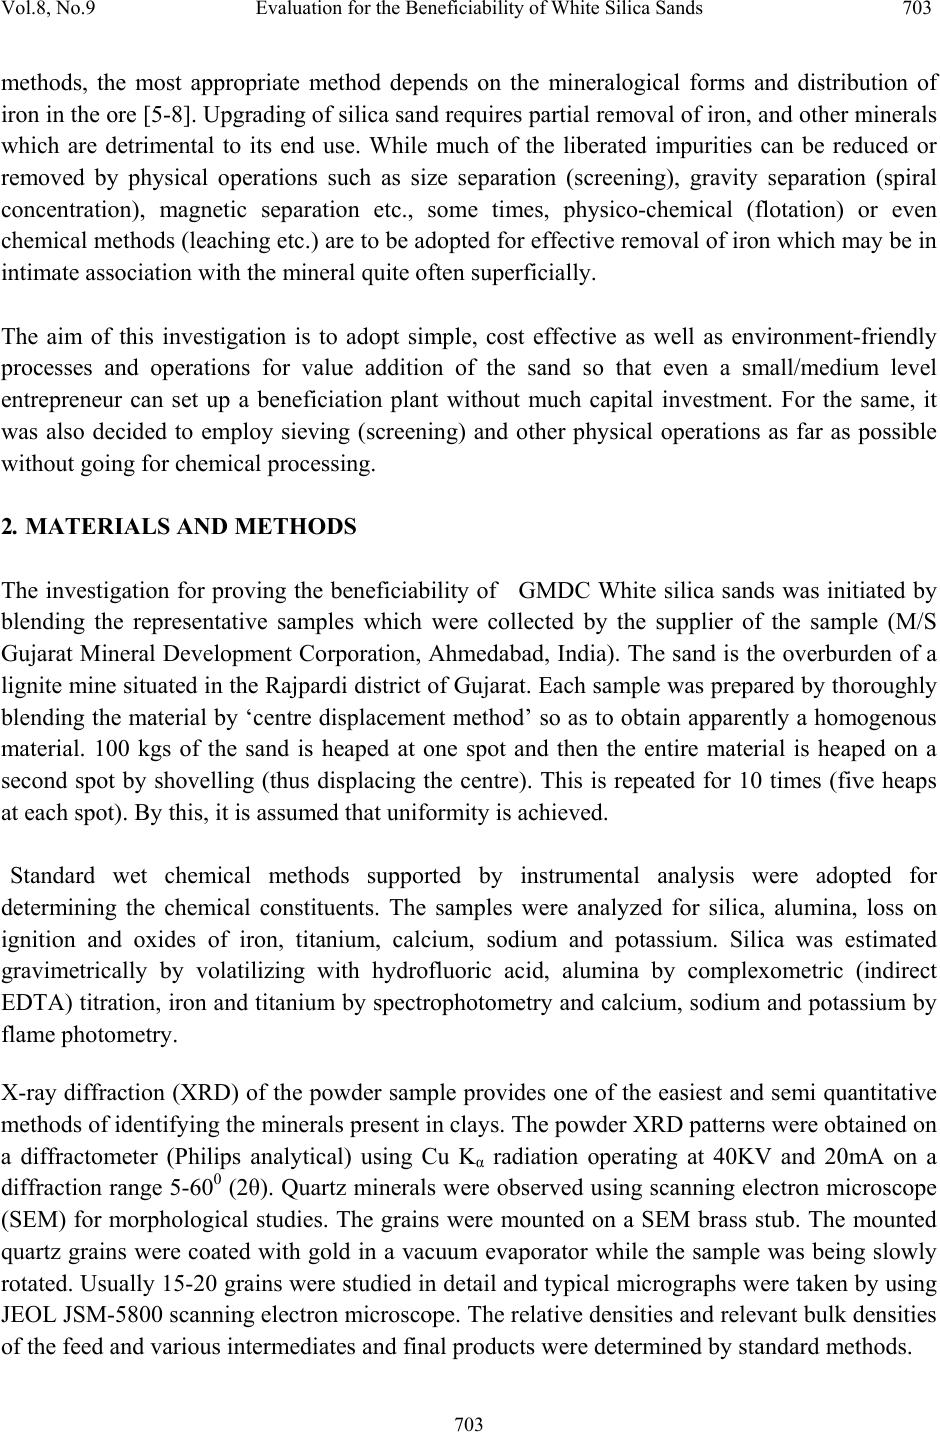 Vol.8, No.9 Evaluation for the Beneficiability of White Silica Sands 703 703 methods, the most appropriate method depends on the mineralogical forms and distribution of iron in the ore [5-8]. Upgrading of silica sand requires partial removal of iron, and other minerals which are detrimental to its end use. While much of the liberated impurities can be reduced or removed by physical operations such as size separation (screening), gravity separation (spiral concentration), magnetic separation etc., some times, physico-chemical (flotation) or even chemical methods (leaching etc.) are to be adopted for effective removal of iron which may be in intimate association with the mineral quite often superficially. The aim of this investigation is to adopt simple, cost effective as well as environment-friendly processes and operations for value addition of the sand so that even a small/medium level entrepreneur can set up a beneficiation plant without much capital investment. For the same, it was also decided to employ sieving (screening) and other physical operations as far as possible without going for chemical processing. 2. MATERIALS AND METHODS The investigation for proving the beneficiability of GMDC White silica sands was initiated by blending the representative samples which were collected by the supplier of the sample (M/S Gujarat Mineral Development Corporation, Ahmedabad, India). The sand is the overburden of a lignite mine situated in the Rajpardi district of Gujarat. Each sample was prepared by thoroughly blending the material by ‘centre displacement method’ so as to obtain apparently a homogenous material. 100 kgs of the sand is heaped at one spot and then the entire material is heaped on a second spot by shovelling (thus displacing the centre). This is repeated for 10 times (five heaps at each spot). By this, it is assumed that uniformity is achieved. Standard wet chemical methods supported by instrumental analysis were adopted for determining the chemical constituents. The samples were analyzed for silica, alumina, loss on ignition and oxides of iron, titanium, calcium, sodium and potassium. Silica was estimated gravimetrically by volatilizing with hydrofluoric acid, alumina by complexometric (indirect EDTA) titration, iron and titanium by spectrophotometry and calcium, sodium and potassium by flame photometry. X-ray diffraction (XRD) of the powder sample provides one of the easiest and semi quantitative methods of identifying the minerals present in clays. The powder XRD patterns were obtained on a diffractometer (Philips analytical) using Cu Kα radiation operating at 40KV and 20mA on a diffraction range 5-600 (2θ). Quartz minerals were observed using scanning electron microscope (SEM) for morphological studies. The grains were mounted on a SEM brass stub. The mounted quartz grains were coated with gold in a vacuum evaporator while the sample was being slowly rotated. Usually 15-20 grains were studied in detail and typical micrographs were taken by using JEOL JSM-5800 scanning electron microscope. The relative densities and relevant bulk densities of the feed and various intermediates and final products were determined by standard methods.  704 M. Sundararajan, S. Ramaswamy and P. Raghavan Vol.8, No.9 3. RESULT AND DISCUSSION 3.1 Characterization A small amount of sample is drawn from the blended bulk for different characterizations such as determining their chemical constituents, mineral contents and physical properties. The XRD pattern of white sand showed the presence of large amount of highly crystalline quartz form of silica (Fig. 1). Q-Quartz, K- Kaolinite Figure 1. XRD pattern of White silica sand The only other peak visible is that of kaolin (clay). However, it is to be understood that the height and sharpness of the XRD peak is a measure not only of the quantity of the mineral but also its higher crystallinity. So the presence of minor phases, quite often, may not be visible in XRD. SEM studies reveal that the quartz grains are angular to sub rounded marked by peeling of surface as a result on intense chemical weathering, angular grain with smoothed edges and sides, weathered, and conchoidal blockage with smoothed surface (Fig. 2 ) were created by mechanical abrasion and chemical processes. 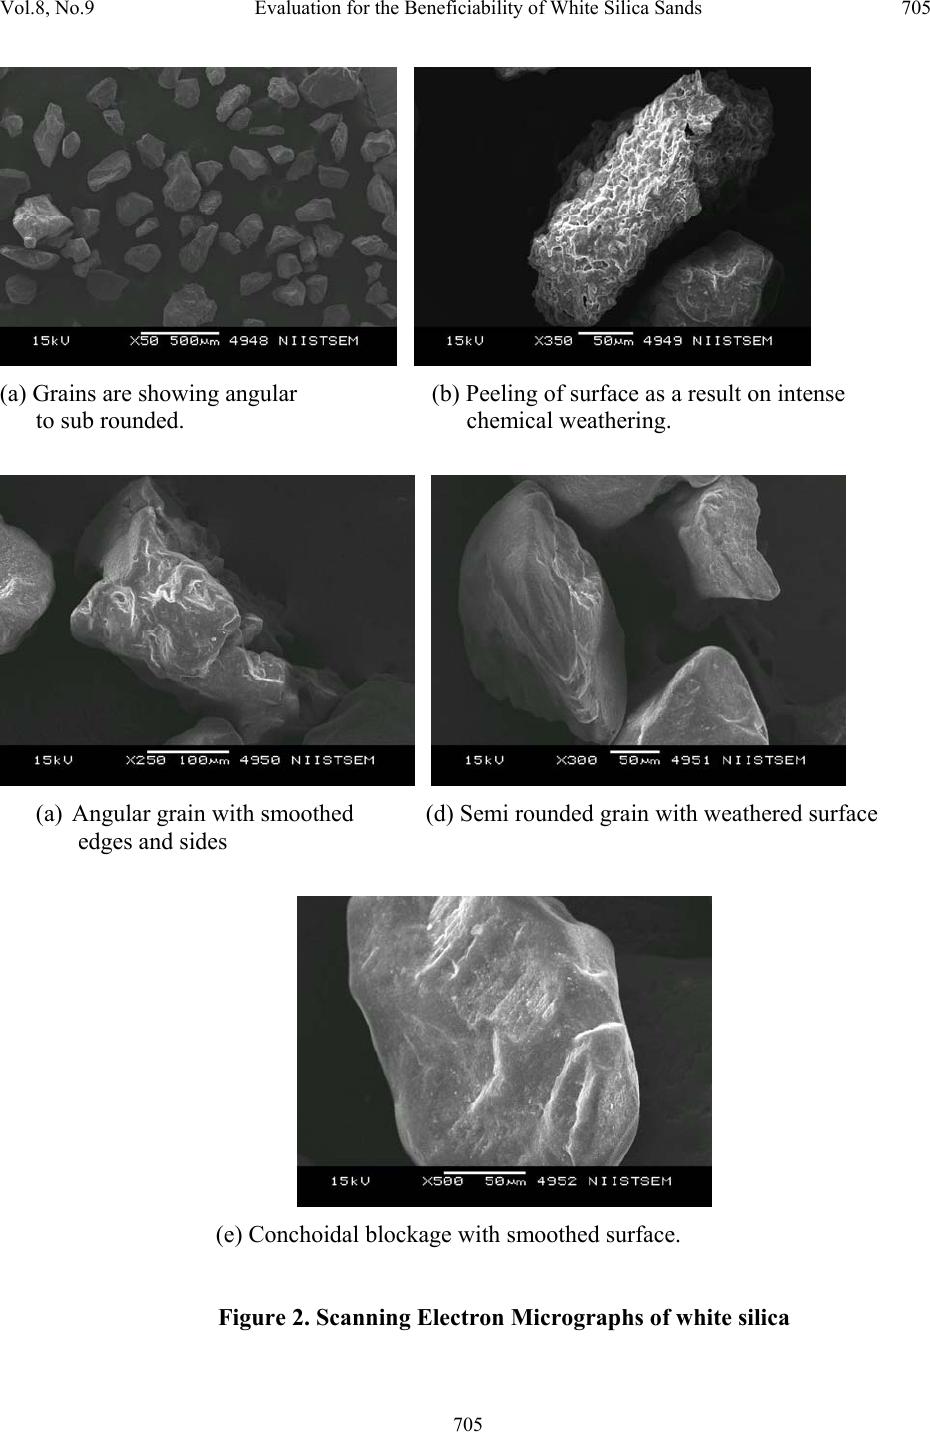 Vol.8, No.9 Evaluation for the Beneficiability of White Silica Sands 705 705 (a) Grains are showing angular (b) Peeling of surface as a result on intense to sub rounded. chemical weathering. (a) Angular grain with smoothed (d) Semi rounded grain with weathered surface edges and sides (e) Conchoidal blockage with smoothed surface. Figure 2. Scanning Electron Micrographs of white silica  706 M. Sundararajan, S. Ramaswamy and P. Raghavan Vol.8, No.9 Raw white sand was subjected to chemical analysis before starting the beneficiation experiments (Table 1). Table1. Chemical analysis of raw white silica sand Constituents Wt, % SiO2 91.5 Fe2O3 1.4 TiO2 0.74 Al2O3 4.22 Na2O 0.16 K 2O 0.01 CaO 0.6 LOI 1.37 Specific gravity of raw sand - 2.83 Silica is relatively low and iron and alumina are on higher side. The presence of small amounts of sodium, potassium and calcium minerals are also revealed. The loss of ignition (LOI) is 1.37%. The specific gravity was determined as 2.68. Again at each stage of processing, the products were analyzed for the chemical constituents so that the extent of value addition or suitability of the beneficiation product with respect to standard specifications could be evaluated. Properties like particle size distribution and chemical assay of the sand are important for the glass making. Characterisation showed that this sample cannot directly be used for any value added ceramic applications. 3.2 Laboratory Beneficiation Studies Laboratory investigation studies were initiated after the completion of characterisation studies on the representative raw sand sample. BIS has put forth specifications for four grades of silica sand for glass making (Table 2).  Vol.8, No.9 Evaluation for the Beneficiability of White Silica Sands 707 707 Table 2. Indian Standard specifications for glass making sands – 2nd Revision [IS 488: 1980] (i) Chemical analysis Sl No. Characteristic (% by mass) REQUIREMENT Special Grade Grade I Grade II Grade III 1 Loss on ignition, Max. 0.5 0.5 0.5 0.5 2 Silica (as SiO2), Min. 99.0 98.5 98.0 97.0 3 Iron Oxide (as Fe2O3), Max. 0.02 0.04 0.06 0.10 4 Aluminium Oxide (as Al2O3), Max. * * * * 5 Titanium Dioxide ( as TiO2), Max. 0.10 0.10 0.10 * 6 Manganese Oxide (as MnO) To pass the test To pass the test To pass the test To pass the test 7 Copper Oxide (as CuO) To pass the test To pass the test To pass the test To pass the test 8 Chromium Trioxide (as Cr2O3) To pass the test To pass the test To pass the test To pass the test * These requirements shall be as agreed to between the purchaser and the supplier (ii) Size grading Wt, % Retained on 1 mm IS sieve - Nil Retained on 600 micron IS sieve, % by mass, Max. -01.0 Passing through 600 micron IS sieve, but retained on 300 micron IS sieve, % by mass, Max. -50.0 Passing through 300 micron IS sieve, but retained on 125 micron IS sieve, % by mass, Min. -50.0 Passing through 125 micron IS sieve, % by mass, Max. -05.0 The best grade known as Special grade should contain minimum 99% silica with maximum permissible level of 0.02% Fe2O3 and 0.1% TiO2 for a size fraction in between 600 and 125μm. Others Grade are low in purity. 3. 2. 1 Wet sieving and mixing of ‘desir ed fractions’ (DF) Wet sieving was carried out in tune with the requirements for glass making sand and hence the sieves selected were 1000, 600, 300 and 125μm. The data are given in Table 3.  708 M. Sundararajan, S. Ramaswamy and P. Raghavan Vol.8, No.9 Table 3 Wet sieve analysis of White raw silica sand sample and chemical characterization of ‘wet-sieved desired fractions’ (WSDFw) Sieve Size, %Wt. μm +1000 0.4 -1000, +600 12.2 -600, +300 24.2 -300, +125 56.7 -125 6.5 %Wt. SiO2 Fe2O3 TiO2 Al2O3 Na2O K2O CaO LOI WSDFw 80.9 94.2 0.27 0.4 0.4 0.32 0.066 0.61 0.43 The fraction above 600μm, which is about 12.6% of the feed sample, is the coarse grits and is taken separately since it is not suitable for glass making (This may be used for land filling). Similarly, the fraction below 125μm (~6.5% of feed sample) which contains mostly kaolin (clay mineral) is also rejected since the same is also unsuitable for glass making. The weight fraction of –600 +125μm ‘cut’ is about 80.9%, which, as per the size specification, is the ‘Desired Fraction for the White silica sand’. We shall denote it as ‘WSDFw’ since it is wet-sieved. As per BIS specifications, in WSDFw, while -600, +300μm is 29.9%, the other fraction (-300, +125μm) is 70.1%. This satisfies the IS specifications for the size fractions. Though the mass proportion as per the specification is satisfied, the chemical analysis (Table 3) showed that the material is still not suitable for any glass making, hence WSDFw was subjected to further processing. 3. 2. 2 Attrition and magnetic separation Since the combined iron was found to be mainly as coating on the surface of the sand grains, it was decided to go for attrition followed by magnetic separation. Attrition tests are carried out in Netzsch, PE 075, mill which is a vertical cylindrical attritor jar fitted with a specially designed agitator. The mill was charged with 1.24 Kgs. of the attrition medium, viz., fused ceramic beads of 1-1.3 mm size and later on, the material was added to the mill in slurry form. The agitator was switched on and was brought to the required rpm. The mill has got external cooling system for removing the heat generated during the attrition process. After the completion of the set time, the total charge was taken out and the attrition media was separated from the slurry by sieving. For the tests with GMDC White silica sand, the agitator rpm was kept at 1150 so as to generate a small vortex at the centre of the attritor jar. Two variables were studied: ‘slurry solid loading’ and the ‘attrition time’. Solid loading was varied from 10 to 55%. Towards 55%, externally  Vol.8, No.9 Evaluation for the Beneficiability of White Silica Sands 709 709 circulated cooling water of the attritor jar was getting heated up and at 60%, the contents did not move at all due to high viscosity. Hence the optimum solid loading was taken as 50%. Data is presented in Table 4. Table 5 shows the pattern of the liberation and removal of iron minerals with respect to attrition time. It could be seen that about 10 minutes was enough to get an iron value of 0.17%. Table 4. Influence of solid loading on attrition, impurity libera t ion and removal Solid loading, Wt% Non-magnetic product %SiO2 %Fe2O3 %TiO2 15 95.6 0.261 0.381 35 95.9 0.233 0.361 45 96.3 0.204 0.340 50 96.8 0.170 0.320 55 96.9 0.168 0.318 – Cooling water getting heated up 60 Could not be subjected to attrition due to infinite viscosity Fixed conditions: Media -1.24 Kg., Size-1-1.3mm fused ceramic beads; Attrition time –10 minutes, agitator rpm-1150 Magnetic separation: Magnetic field (equivalent current in Amp.) – 3.2 Medium: Iron balls (diameter of 6.3 mm) -1.248 Kg. (Total slurry volume – 250 ml) Table 5. Influence of attrition time on impurity liberation and removal Attrition time, minute’s Non-magnetic product % SiO2 % Fe2O3 % TiO2 5 95.1 0.268 0.392 10 96.9 0.170 0.320 15 96.9 0.168 0.316 20 97.0 0.168 0.310 30 97.1 0.167 0.309 Fixed conditions: Attrition Media -1.24 Kg., Size-1-1.3mm fused ceramic beads; % Solids loading –50; agitator rpm-1150 Magnetic separation: Magnetic field (equivalent current in Amp.) – 3.2 Attrition Medium: Iron balls (diameter of 6.3 mm) -1.248 Kg. (Total slurry volume – 250 ml)  710 M. Sundararajan, S. Ramaswamy and P. Raghavan Vol.8, No.9 The attrition media was removed by sieving the product slurry using a 600μm sieve. No sand was found along with the recovered media. Again the whole slurry was passed through a 125μm sieve so as to remove the liberated iron impurities along with some over-ground (fine) sand. The attrited sand after the removal of attrition medium and -125μm fraction analysed 96.9 % silica, 0.17% iron and 0.32% of titania (Table 6). Though the impurity level has been reduced, the silica content is still below the required level and the iron value is more than the specified value. Table 6. Chemical analysis of attrited white sand Constituent Wt % SiO2 96.9 Fe2O3 0.17 TiO2 0.32 Al2O3 0.30 Na2O 0.004 K 2O Below detectable limit CaO 0.002 LOI 0.2 Due to attrition, a small percentage of sand was overground to below 125 micron. Similarly, small quantity of attrition medium got broken and damaged. This is evident from the particle size distribution of the sand before and after attrition which is presented in Table 7. Table 7. Particle size distribution before and after attrition (White sand) Sieve Size, %Wt. μm Before After attrition attrition -600, +300 29.9 28.7 -300, +125 70.1 67.2 -125 Nil 3.5 It could be seen that about 3.5% of –125μm fraction was generated which was removed by screening through 125 micron screen. The new mass distribution between desired fractions (i.e., -600 +300 and –300 +125μm) after the elimination of -125μm is 29.7 and 70.3% respectively. During attrition, the mass ratio changed only negligibly, so it does not affect the size specifications. As already stated above, attrition operation generates a sand fraction of about 3.5% below 125μm. This is considered to be a loss here, since fraction below this size cannot be used for  Vol.8, No.9 Evaluation for the Beneficiability of White Silica Sands 711 711 glass making however. If clay is removed effectively, this fraction can be used for some foundry applications). This is equivalent to 2.8% w.r.t. the original raw sand sample. This includes the liberated iron and titanium minerals which is, relatively, a very small quantity. The attrition media loss has been estimated to be about 1.5%. 3.2.3 Magnetic separation A wet high intensity magnetic separator (WHIMS) which can generate an optimum magnetic field of 1.8 Tesla (18000 Gauss) at a maximum input current of ~3.2 Ampere was used for magnetic separation. The magnetic separation, which is integral with the attrition, was carried out using a Carpco machine which was operated on batch basis. The ‘canister’ (separating chamber) of the magnet was filled with the medium which, in the present case, is iron balls (1.248 Kg.) of about 6.3 mm in diameter (small size) and the magnetic field was generated by switching on the current. The dry sample was spread on the top of the medium and water was added manually and uniformly on the surface so that it wets the material and takes it through the voids among the balls. The water equivalent to a 25% slurry was added initially. The liberated magnetic particles were caught by the balls and the sand slurry flows through the medium down to the collection pot unaffected by the field. Plain water was added into canister over the balls as wash water in order to dislodge the sand particles entrapped among the balls. The washings were collected along with the non-magnetics, i.e., product sand. After the product sand was collected, the magnetic field was removed by switching off the current and the canister was flushed with water in order to dislodge the magnetics (iron impurities) from the medium. Later on, the attrition media (iron balls) were taken out and again washed to collect the final traces of the sticking iron particles. Both the magnetics (impurities) and non-magnetics (product sand) materials were dried and weighed. Removal of iron from White silica sand by various processing methods are given in Table 8. Table 9 shows the stage wise enrichment of silica in the sand by these operations. Table 8. Pattern of Iron removal from White sand by Processing Material Operation %Fe2O3 Cumulative removal, % Raw white sand Nil 1.4 Nil WSDFw Sieving & Mixing of desired fractions 0.27 80.7 Attrited sand Attrition+Sieving 0.17 87.8 Product White sand (Non-Magnetics) Magnetic separation 0.09 93.6  712 M. Sundararajan, S. Ramaswamy and P. Raghavan Vol.8, No.9 Table 9. Enrichment of silica in White silica sand due to Processing Material Operation Silica assay % Cumulative Enrichment % (Based on 100-91.5 = 8.5 units) Raw white sand Nil 91.5 Nil WSDFw Sieving & Mixing of desired fractions 94.2 31.8 Attrited sand Attrition+Sieving 96.9 63.5 Product White sand (Non-Magnetics) Magnetic separation 98.1 77.6 WSDFw after attrition followed by magnetic separation at optimised conditions was found to satisfy Grade III specification for glass making only since the iron content could not be reduced below 0.09%. Salient results of tests such as LOI, chemical assays and size grading are given in Table 10 in comparison with BIS specifications. The Product of beneficiation is ‘Grade III glass making sand’. The coarse grit generated during the sieving (screening) can be considered as by- product. Table 10. Comparison of product White sand with the specifications for ‘Grade III’ glass making sand (i) Chemical Sl No. Characteristics (% by mass) Product White sand (After magnetic separation) IS Specification for grade III Glassmaking sand 1 Loss on ignition, Max. 0.17 0.5 2 Silica (as SiO2), Min. 98.1 97 3 Iron Oxide (as Fe2O3), Max. 0.09 0.1 4 Aluminium Oxide (as Al2O3), Max. 0.28 ---- 5 Titanium Dioxide ( as TiO2), Max. 0.13 ---- 6 Manganese Oxide (as MnO) ---- To pass the test 7 Copper Oxide (as CuO) ---- To pass the test 8 Chromium Trioxide (as Cr2O3) ---- To pass the test  Vol.8, No.9 Evaluation for the Beneficiability of White Silica Sands 713 713 (ii) Size grading (Table. 10 continued) Product sand IS Specifications (After Magnetic separation) For Grade III Sand *Retained on 1 mm IS sieve Nil Nil *Retained on 600 micron IS sieve, % by mass, Max. 1.0 Nil *Passing through 600 micron IS sieve, but retained on 300 micron IS sieve, % by mass, Max. 50.0 29.7 *Passing through 300 micron IS sieve, but retained on 125 micron IS sieve, % by mass, Min. 50.0 70.3 Passing through 125 micron IS sieve, % by mass, Max. 5 Nil 3.3 Suggested Beneficiation Flow Sheet for White Silica Sand Based on the laboratory processing studies conducted on the blended raw sand sample for establishing beneficiability of GMDC White silica sand, an beneficiation flow sheet is suggested as follows. The overburden sand is first wet-screened using a single deck vibrating screen having a 600 μm screen. The oversize grits are collected separately to be used as a land fill while the undersize slurry is pumped to a second stage double deck vibrating screen fitted with 300 and 125 μm screens. Both +300 and (-300 +125) fractions are taken together and this slurry after adjusting the pulp density is sent to attrition mills. The attrited sand slurry is screened using a vibrating screen fitted with 600 μm screen in order to remove the attrition media. If required additional water can be added at this stage. The sand slurry is again passed through 125 μm vibrating screen so as to remove the slimes which contains a major portion of the liberated iron and some broken attrition media as well as over-milled silica sand particles. The desired fraction (-600 +125μm), after adjusting pulp density is pumped to wet magnetic separators to remove the remaining iron impurities. The non-magnetic slurry containing the desired silica sand fraction is collected and pumped to the hydrocyclones for first stage de-watering and finally to a spiral classifier for 2nd stage and final dewatering to obtain Grade III glass making sand as the principal  714 M. Sundararajan, S. Ramaswamy and P. Raghavan Vol.8, No.9 product. The coarse grits from the 1st screen can form a by-product which can be used for land filling. 4 CONCLUSIONS The investigation was carried out on White silica sand in order to evaluate their beneficiability for value addition. Initial characterisation showed that the main impurities in the sample are iron and titania minerals. The results of beneficiation studies reveal that while wet sieving/screening removes majority of these contaminating minerals to give an intermediate product sand, attrition and magnetic separation are required to upgrade the same to grade III glass making sand. Coarse grits (+600μm) can be considered as a by-product which can be used as landfill. Based on the laboratory study, beneficiation flow sheets have been suggested for the white silica sand. ACKNOWLEDGEMENT The project team is grateful to the sponsors, Gujarat Mineral Development Corporation Science and Research Centre, Ahmedabad for financial support for the work. They are particularly thankful to Mr. S.B. Vora who has shown a keen interest in this work. The guidance and advice received from Shri. CPS Nair, Project Advisor is gratefully acknowledged. Finally, we thank the Director, NIIST (RRL), Trivandrum for his support for execution of the project. REFERENCES 1. Indian Bureau of Mines, Nagpur, , 1993, Quartz and Silica Sand; Bulletin No. 25 2. Directorate of Mining and Geology, Kerala; 1998. “Report on silica sand” 3. Bureau of Indian Standards, 1977. IS specification for standard silica sand for raw material testing in foundries, IS:3018-1977, Indian Standard Institution, New Delhi 4. Bureau of Indian Standards, 1980. IS specification for glass making sands, IS:488-1980, Indian Standard Institution, New Delhi 5. Ay, N., Arica, E, 2000. “Refining Istanbul’s silica sand”, www.Ceramicbulletin. org, August 06. 6. Farmer, A.D., Collings, A.F., Jameson, G.J., 2000. The application of power ultrasound to the surface cleaning of silica and heavy mineral sands, Ultrasonics Sonochemistry, 7, pp. 243-247 7. Taxiarchaou, M., Panias, D., Douni, I., Paspaliaris, I., Kontopoulos, A., 1997. Removal of iron from silica sand by leaching with oxalic acid, Hydrometallurgy, 46, pp.215-227 8. Wills, B. A. 1998. Mineral processing Technology. Pergamon Press, New York |