Paper Menu >>
Journal Menu >>
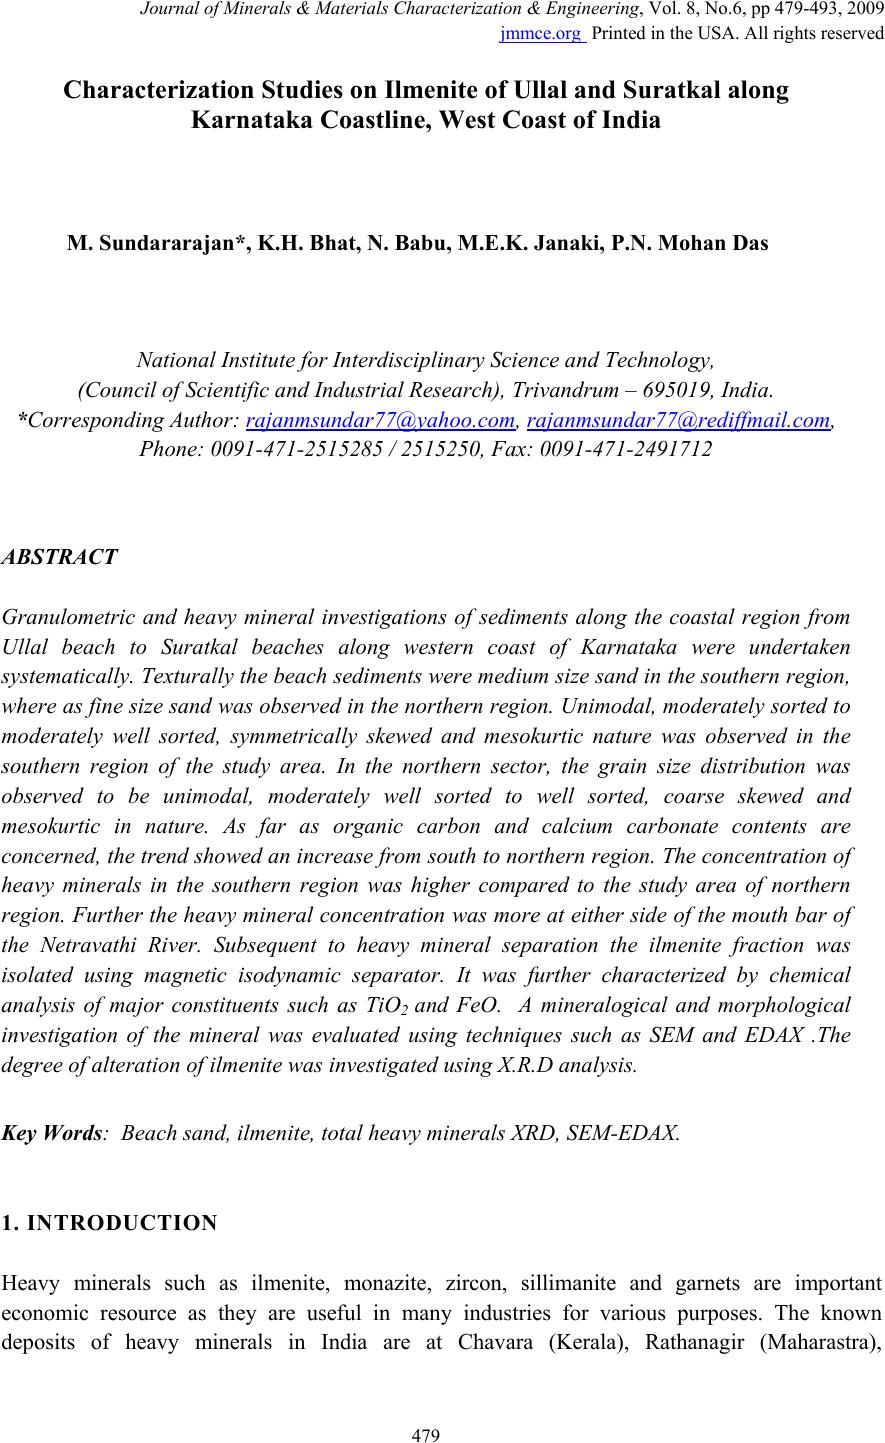 Journal of Minerals & M aterials Characterization & Engineering, Vol. 8, No.6, pp 479-493, 2009 jmmce.org Printed in the USA. All rights reserved 479 Characterization Studies on Ilmenite of Ullal and Suratkal along Karnataka Coastline, West Coast of India M. Sundararajan*, K.H. Bhat, N. Babu, M.E.K. Janaki, P.N. Mohan Das National Institute for Interdisciplinary Science and Technology, (Council of Scientific and Industrial Research), Trivandrum – 695019, India. *Corresponding Author: rajanmsundar77@yah oo.com, rajanmsundar77@rediffmail.com, Phone: 0091-471-2515285 / 2515250, Fax: 0091-471-2491712 ABSTRACT Granulometric and heavy mineral investigations of sediments along the coastal region from Ullal beach to Suratkal beaches along western coast of Karnataka were undertaken systematically. Texturally the beach sediments were medium size sand in the southern region, where as fine size sand was observed in the northern region. Unimodal, moderately sorted to moderately well sorted, symmetrically skewed and mesokurtic nature was observed in the southern region of the study area. In the northern sector, the grain size distribution was observed to be unimodal, moderately well sorted to well sorted, coarse skewed and mesokurtic in nature. As far as organic carbon and calcium carbonate contents are concerned, the trend show ed an increase from south to north ern region. The con centration of heavy minerals in the southern region was higher compared to the study area of northern region. Further the heavy mineral concentration was more at either side of the mouth bar of the Netravathi River. Subsequent to heavy mineral separation the ilmenite fraction was isolated using magnetic isodynamic separator. It was further characterized by chemical analysis of major constituents such as TiO2 and FeO. A mineralogical and morphological investigation of the mineral was evaluated using techniques such as SEM and EDAX .The degree of alteration of ilmenite was investigated using X.R.D analysis. Key Words: Beach sand, ilmenite, total heavy minerals XRD, SEM-EDAX. 1. INTRODUCTION Heavy minerals such as ilmenite, monazite, zircon, sillimanite and garnets are important economic resource as they are useful in many industries for various purposes. The known deposits of heavy minerals in India are at Chavara (Kerala), Rathanagir (Maharastra),  480 M. Sundararajan, K.H. Bhat, N. Babu, M.E.K. Janaki, P.N. Mohan Das Vol.8, No.6 Manavalakurichi (Tamil Nadu) and Ganjam (Orissa). Ilmenite (FeTiO3), an important and most abundant mineral of titanium, occurs in India along the coastal beach sands. The degree of alteration due to weathering is significant and is independent of the provenance. Hence, it attracts the attention of scientists in different disciplines with totally different approaches [1-5]. The world reserves of economic sources of titanium are estimated to be approximately 300 million tons that contained TiO2 [6]. However, when the production of ilmenite is looked into, the ratio of production of ilmenite to the reserves is only 0.1 % while the countries such as Malaysia (7 %), USA (3 %), Australia (1 %) and Brazil (1.8 %) keep better ratio [6]. India is blessed with large reserves of strategic and economically important heavy minerals such as leucoxene, zircon, monazite, ilmenite, rutile, garnet and sillimanite. In India, a two stage model for pseudo-rutile formation from the ilmenites of Manavalakurichi region has been reported [7] and the alteration of ilmenites from the river Valliyar and Manavalakurichi beach has been outlined [8]. Along the Ratnagiri coast, the provenance of offshore ilmenite placers, based on geochemical studies has been dealt in detail [9, 10]. From South India, a detailed account of alteration characteristics of ilmenites has been enunciated [11]. Numerous unknown concentrations of placers occur but no systematic and detailed studies were made particularly in the study area. However, detailed investigations of such less known; commercially unviable mineral reserves is necessary by virtue of fast depletion of commercial deposits and when lean deposits have to be exploited. The present paper deals with the detailed mineralogical, textural and characterazation studies of samples from the south of Karnataka coast. 2. STUDY AREA The study area is from Ullal to Suratkal in southern region of coastal Karnataka. The width of the beach varies from place to place with a range of 20 to 170 m. Fourteen locations were selected for sampling. For convenience of discussion the study area has been grouped into three sectors viz. Ullal, Thannirbhavi and Panambur sectors. 3. METHODOLOGY Fourteen stations were fixed for sample collection. In each station beach samples up to a depth of about 30cm were collected from the foreshore, berm and backshore as well as 50m apart along the beach and all these were thoroughly mixed and the fourteen representatives were collected for the present study (Fig.1). Samples were subjected to granulometric analysis following Folk and Ward method [12]. Fraction-wise separations of light and heavy minerals were carried out using bromoform in fractions of +45 to –230 A.S.T.M mesh following the procedure mentioned in [13]. For XRD analysis, the ilmenite grains were powdered and the powdered samples were subjected to X-ray diffraction with scan angle (2ө) ranging from 10o to 60o, using a Phillip X’ Pert X – ray diffractometer. Jeol-JSM 5600 LV microscope was used for Scanning Electron Microscopic studies of ilmenite samples in order to understand mineral alteration and micro morphology. Powdered ilmenite was brought into solution by fusion with KHSO4 and dissolution in hot dilute H2SO4. Titanium was determined by reducing titanium IV to titanium III using aluminum metal 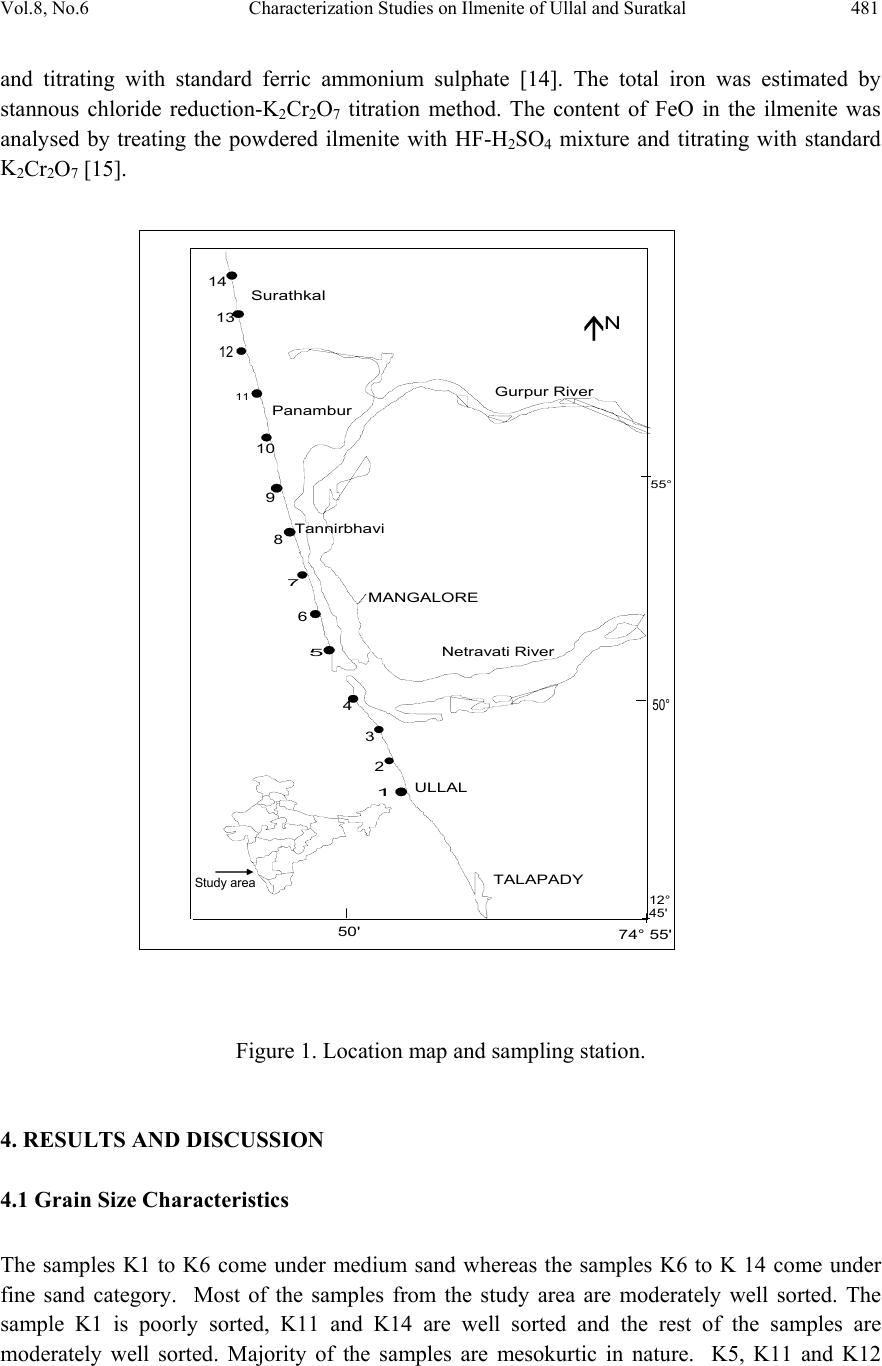 Vol.8, No.6 Characterization Studies on Ilmenite of Ullal and Suratkal 481 and titrating with standard ferric ammonium sulphate [14]. The total iron was estimated by stannous chloride reduction-K2Cr2O7 titration method. The content of FeO in the ilmenite was analysed by treating the powdered ilmenite with HF-H2SO4 mixture and titrating with standard K2Cr2O7 [15]. 50' 74° 55' 12° 45' 50° 55° Study area Gurpur River Panambur Tannirbhavi MANGALORE Netravati River ULLAL TALAPADY 1 2 3 4 5 6 7 8 9 10 11 12 13 14 N Surathkal Figure 1. Location map and sampling station. 4. RESULTS AND DISCUSSION 4.1 Grain Size Characteristics The samples K1 to K6 come under medium sand whereas the samples K6 to K 14 come under fine sand category. Most of the samples from the study area are moderately well sorted. The sample K1 is poorly sorted, K11 and K14 are well sorted and the rest of the samples are moderately well sorted. Majority of the samples are mesokurtic in nature. K5, K11 and K12 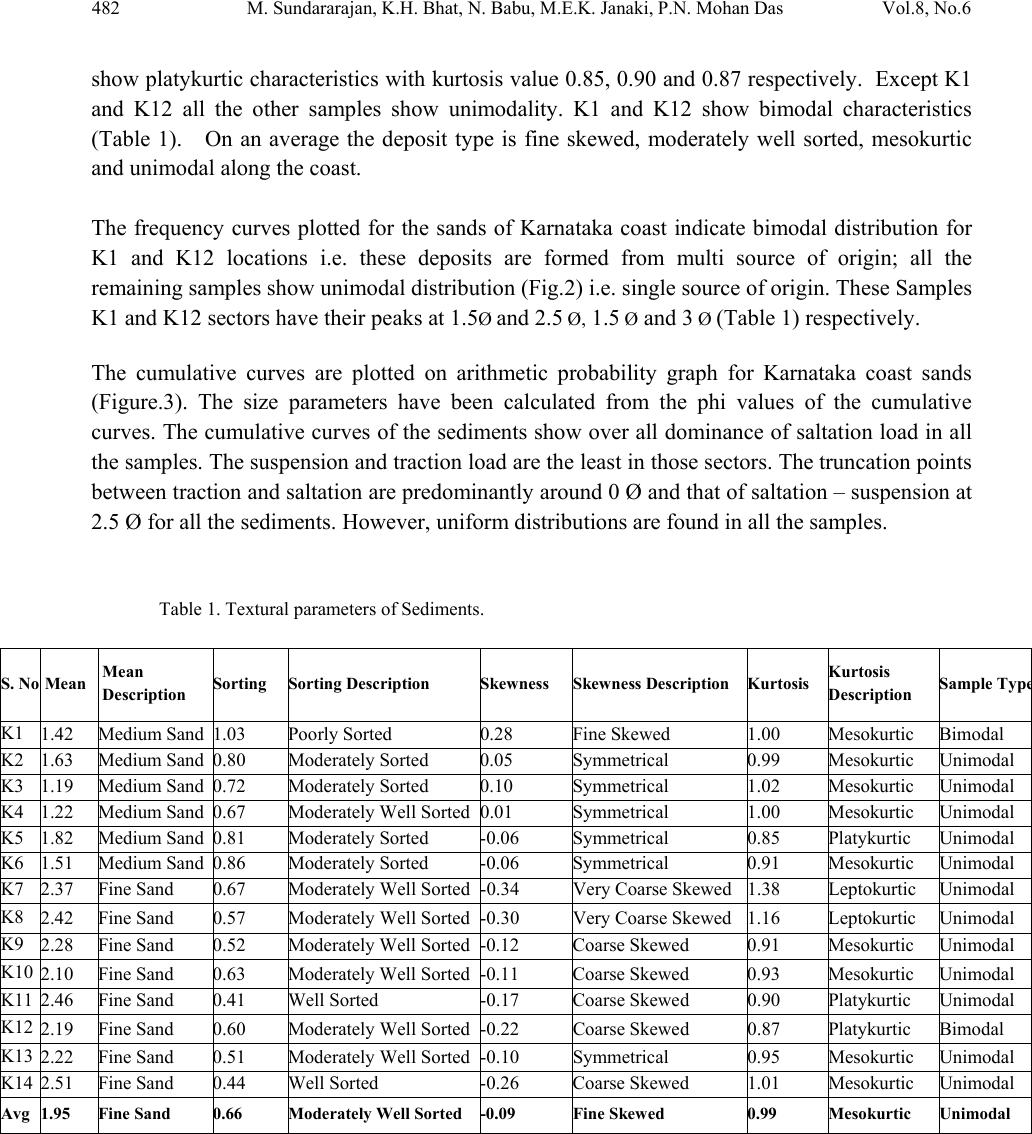 482 M. Sundararajan, K.H. Bhat, N. Babu, M.E.K. Janaki, P.N. Mohan Das Vol.8, No.6 show platykurtic characteristics with kurtosis value 0.85, 0.90 and 0.87 respectively. Except K1 and K12 all the other samples show unimodality. K1 and K12 show bimodal characteristics (Table 1). On an average the deposit type is fine skewed, moderately well sorted, mesokurtic and unimodal along the coast. The frequency curves plotted for the sands of Karnataka coast indicate bimodal distribution for K1 and K12 locations i.e. these deposits are formed from multi source of origin; all the remaining samples show unimodal distribution (Fig.2) i.e. single source of origin. These Samples K1 and K12 sectors have their peaks at 1.5Ø and 2.5 Ø, 1.5 Ø and 3 Ø (Table 1) respectively. The cumulative curves are plotted on arithmetic probability graph for Karnataka coast sands (Figure.3). The size parameters have been calculated from the phi values of the cumulative curves. The cumulative curves of the sediments show over all dominance of saltation load in all the samples. The suspension and traction load are the least in those sectors. The truncation points between traction and saltation are predominantly around 0 Ø and that of saltation – suspension at 2.5 Ø for all the sediments. However, uniform distributions are found in all the samples. Table 1. Textural parameters of Sediments. S. No Mean Mean Description Sorting Sorting Description Skewness Skewness Description Kurtosis Kurtosis Description Sample Typ e K1 1.42 Medium Sand 1.03 Poorly Sorted 0.28 Fine Skewed 1.00 Mesokurtic Bimodal K2 1.63 Medium Sand 0.80 Moderately Sorted 0.05 Symmetrical 0.99 Mesokurtic Unimodal K3 1.19 Medium Sand 0.72 Moderately Sorted 0.10 Symmetrical 1.02 Mesokurtic Unimodal K4 1.22 Medium Sand 0.67 Moderately Well Sorted0.01 Symmetrical 1.00 Mesokurtic Unimodal K5 1.82 Medium Sand 0.81 Moderately Sorted -0.06 Symmetrical 0.85 Platykurtic Unimodal K6 1.51 Medium Sand 0.86 Moderately Sorted -0.06 Symmetrical 0.91 Mesokurtic Unimodal K7 2.37 Fine Sand 0.67 Moderately Well Sorted-0.34 Very Coarse Skewed 1.38 Leptokurtic Unimodal K8 2.42 Fine Sand 0.57 Moderately Well Sorted-0.30 Very Coarse Skewed 1.16 Leptokurtic Unimodal K9 2.28 Fine Sand 0.52 Moderately Well Sorted-0.12 Coarse Skewed 0.91 Mesokurtic Unimodal K10 2.10 Fine Sand 0.63 Moderately Well Sorted-0.11 Coarse Skewed 0.93 Mesokurtic Unimodal K11 2.46 Fine Sand 0.41 Well Sorted -0.17 Coarse Skewed 0.90 Platykurtic Unimodal K12 2.19 Fine Sand 0.60 Moderately Well Sorted-0.22 Coarse Skewed 0.87 Platykurtic Bimodal K13 2.22 Fine Sand 0.51 Moderately Well Sorted-0.10 Symmetrical 0.95 Mesokurtic Unimodal K14 2.51 Fine Sand 0.44 Well Sorted -0.26 Coarse Skewed 1.01 Mesokurtic Unimodal Avg 1.95 F in e Sand 0.66 Moderately Well Sorted -0.09 Fine Skewed 0.99 Mesokurtic Unimodal 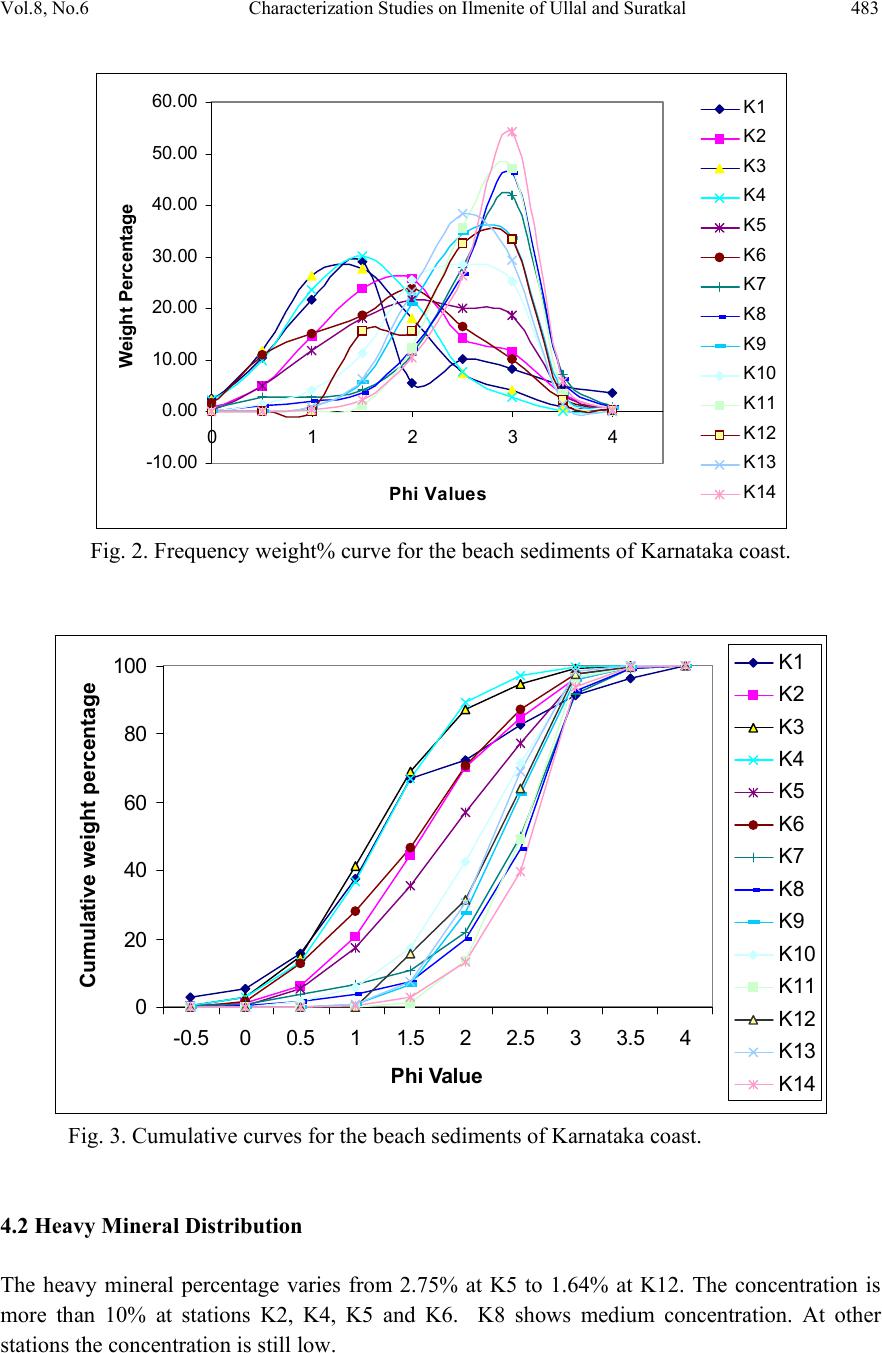 Vol.8, No.6 Characterization Studies on Ilmenite of Ullal and Suratkal 483 -10.00 0.00 10.00 20.00 30.00 40.00 50.00 60.00 01234 Phi Values Weight Percentage K1 K2 K3 K4 K5 K6 K7 K8 K9 K10 K11 K12 K13 K14 Fig. 2. Frequency weight% curve for the beach sediments of Karnataka coast. 0 20 40 60 80 100 -0.500.511.522.533.54 Phi Va l ue Cumulative weight percentage K1 K2 K3 K4 K5 K6 K7 K8 K9 K10 K11 K12 K13 K14 Fig. 3. Cumulative curves for the beach sediments of Karnataka coast. 4.2 Heavy Mineral Distribution The heavy mineral percentage varies from 2.75% at K5 to 1.64% at K12. The concentration is more than 10% at stations K2, K4, K5 and K6. K8 shows medium concentration. At other stations the concentration is still low.  484 M. Sundararajan, K.H. Bhat, N. Babu, M.E.K. Janaki, P.N. Mohan Das Vol.8, No.6 Heavy mineral distribution in the stations (K1, K2, K5 and K6) shows bimodal character with well-developed peak at 2 phi and 3 phi sizes (Figure 4). This bimodality suggests that the heavies are contributed by two sources, primary by waves and littoral currents and secondary, by fluvial changes of Netravathi River. The unimodal curves of the stations (K3, K4, K7, K8, and K11) (Figure 4) show, well developed peak at 2ø, 2ø, 3ø, 3ø, 3ø and 2.5ø respectively and suggest that the heavies are contributed by a single source i.e. either wave or littoral currents. Station K9 shows polymodal distribution curve having peaks at 1.5ø, 2.5ø and 3.5ø and reveals that there could be two or more sources involved in the heavies distribution. 0.0 1.0 2.0 1234 Phi Value Weight % K1 0.0 1.0 2.0 3.0 4.0 1234 Phi Value Weight % K2 0.0 1.0 2.0 3.0 1234 Phi Value Weight % K3 0.0 1.0 2.0 3.0 4.0 5.0 6.0 7.0 1234 Phi Value Weight % K4 0.0 1.0 2.0 3.0 4.0 5.0 6.0 7.0 1234 Phi Value Weight % K5 0.0 1.0 2.0 3.0 4.0 5.0 6.0 7.0 1234 Phi Value Weight % K6  Vol.8, No.6 Characterization Studies on Ilmenite of Ullal and Suratkal 485 0.0 1.0 2.0 3.0 4.0 1234 Phi Value Weight % K7 0.0 1.0 2.0 3.0 4.0 5.0 1234 Phi Value Weght % K8 0.0 1.0 2.0 1234 Phi Value Weght % K9 0.0 1.0 2.0 3.0 1234 Phi Value Weight % K10 0.0 1.0 2.0 1234 Phi Value Weight % K11 0.0 1.0 2.0 1234 Phi Value Weight % K12 0.0 1.0 2.0 1234 Phi Value Weight % k13 0.0 1.0 2.0 3.0 4.0 1234 Phi Value Weight % k14 Figure 4. Heavy Mineral Distribution of Karnataka Coast.  486 M. Sundararajan, K.H. Bhat, N. Babu, M.E.K. Janaki, P.N. Mohan Das Vol.8, No.6 4.3 Characterization of Ilmenite The ilmenite samples separated from Ullal beach contain about 49.61% TiO2, 23.58% FeO and 14.45% Fe2O3. Thannirbhavi samples also show almost similar composition with respect to TiO2 and iron contents whereas the samples from Panambur beach contain very low TiO2 and iron contents (Figure 5). In all the beaches the FeO content is considerably high showing that alteration is minimum in the study area. The chemistry of iron and titanium in the ilmenite mineral structure is the most evident and direct indicator of the stage of alteration undergone. While the oxidation stage of iron is defined by the ferrous-ferric conversion, as the first stage of alteration, the latter process is the function of the leaching of iron from the mineral structure and the corresponding enrichment of titanium. Thus the study of major elements of ilmenite has implications in the assessment of the quality of ilmenite ore. Different elemental ratios have been proposed to delineate the weathering mechanisms in ilmenite. Forst et al [16] has classified ilmenite alteration into four stages based on the Ti/(Ti+Fe) ratios. The terminology of those stages in the order of increasing stage of alteration is as follows. The Ti/(Ti+Fe) values are given in brackets. Ferrian Ilmenite (<0.5), ‘Hydrated Ilmenite’ (0.5 – 0.6), ‘Pseudorutile’ (0.6 – 0.7) and ‘Leucoxene’ (>0.7). This system has been adopted in this work for the chemical characterization of ilmenite based on major element chemistry. The chemical analysis carried out for the present study, is detailed in Table 2. It was observed that the ilmenite exhibited different stages of alteration at different locations as hydrated ilmenite (0.51%) in Ullal beach, Ferrian ilmenite (0.43%) in Thannirbhavi beach, and Ferrian ilmenite (0.42%) in Penambur beach. Table 2. Chemical analysis and alteration stages of ilmenite from beach sand of Karnataka. Sample LocationFeO % Fe2O3 % TiO2%Total Iron % Ti/Ti+F e Alteration stage Ullal 23.58 14.45 49.61 28.44 0.51 Hydrated Ilmenite Tannirbhavi 29.16 13.91 41.97 32.4 0.43 Ferrian Ilmenite Panambur 15.99 0.93 15.87 13.08 0.42 Ferrian Ilmenite 0 10 20 30 40 50 60 UllalTannirbhavi Panambur Sample Location Percentage FeO Fe2O3 TiO2 Figure 5. Major constituents of ilmenite from Karnataka coast.  Vol.8, No.6 Characterization Studies on Ilmenite of Ullal and Suratkal 487 4.3.1 SEM and EDAX Ilmenite of Karnataka samples has been studied under scanning electron microscope (SEM) and has been analysed with EDAX. The analyses show that the ilmenite of Ullal beach contains Ti and Fe around 31.82 and 20.08 % by weight respectively with minor impurities of alumina, manganese and silica. The weight percentages of the Ti, Fe, Al, Mn and Si are summarized in Table 3 and Figure.6. Thannirbhavi beach sample contains Ti and Fe around 30.14 and 34.91 % by weight respectively with minor impurities of alumina, manganese, and magnesium and silica around 3.43, 2.37, 0.82 and 12.07% respectively. Penambur beach contains only Ti and Fe as major elements and the weight percentage of Ti and iron is around 41.69 and 41.01, respectively. Table 3. Chemical composition of ilmenite by EDAX analysis. Sample Location Wt% At% Ullal Si 0.600.75 Al2.20 2.85 Ti 43.6031.82 Fe32.08 20.08 Mn1.63 1.04 Tannirbhavi Si 12.0714.80 Al3.43 4.38 Ti 30.1421.67 Fe34.91 21.52 Mn2.37 1.49 Mg0.82 1.17 Panambur Ti 41.6932.4 Fe41.01 27.33  488 M. Sundararajan, K.H. Bhat, N. Babu, M.E.K. Janaki, P.N. Mohan Das Vol.8, No.6 Figure 6. Spectral results of ilmenite from EDAX. 4.3.2 X.R.D X-ray diffraction pattern of ilmenite of the Ullal, Thannirbhavi and Panambur shows the presence of only ilmenite peaks (Fig. 7) which reveals that the sediments in these study area have not undergone much alteration. Ullal Tannirbhavi Panambur  Vol.8, No.6 Characterization Studies on Ilmenite of Ullal and Suratkal 489 10 20 30 40 50 60 Ull al Thannirbhavi Panambur I I I I I I I I II II I I I I I I Counts 2θ Figure 7. X-Ray diffractrograms of representative ilmenite of the beach sediments of Karnataka. 4.3.3 Morphological studies using SEM The micro features of monomineralic mineral and ilmenite of South Karnataka samples are presented in Fig.8 (a-c), 9(d-g), 10 (h-k). Krinsley and Doornkamp, [17] studied the surface textures of the quartz to understand the post depositional or digenetic history of the sediments. In India, Mallik, Mallik et al., Anil Cherian et al., and Amber et al., [18-21] have studied the micro features of both heavy and light minerals to understand the digenetic and depositional history of the sediments. In the present investigations sub-rounded grains are observed in Ullal beach (Fig. 8a). Stepped furrow and precipitation on the ilmenite grain (Figures 8 b and c) portrayed grinding, collision and precipitation due to weathering in the study area. In Thannirbhavi beach, the sediment grains are 100um – 200um in size and unhedral in shape (Fig. 9d). Breakage blocks as well as precipitation are observed on ilmenite grain (Fig. 9 e) due to the process of collision of grains in sub aqueous condition. (Fig 9 f and g) show microstructures of ilmenite under low and high resolution, which exhibit etch V’s as well as precipitation due to chemical process in sub aqueous condition. Micro features of samples of Panambur beach of Karnataka are presented in Figures 10 (h, i, j and k). Euhedral to unhedral shapes are also observed (Fig 10 h). 50 um – 150 um size grains are observed in this beach. Fractured ilmenite grains are seen (Fig 10i) due to the process of collision of particles under wave action in the tidal zone [21]. Figures j and k are microstructures of ilmenite grain under low and high resolution, which exhibit 100 % altered nature due to chemical process and precipitation. SEM and EDAX analysis, suggest that Penambur ilmenite grains are more altered than the Ullal and Thannirbhavi ilmenite.  490 M. Sundararajan, K.H. Bhat, N. Babu, M.E.K. Janaki, P.N. Mohan Das Vol.8, No.6 a) Grains are sub rounded b) Weathered ilmenite c) Grain showing rims Figure 8 (a,b,c). Scanning Electron Micrographs of ilmenite from the Ullal Beach. d) Grains are unhedral e) Grain showing breaking block and precipitation f) Irregular grain showing angular edges g) Conchoidal fracture Figure 9 (d,e,g,f). Scanning Electron Micrographs of ilmenite from the Tanivar bavi Beach.  Vol.8, No.6 Characterization Studies on Ilmenite of Ullal and Suratkal 491 h) Grain are euhedral and unhedral i) Fractured ilmenite j) Altered ilmenite grain k) Macro view of Altered ilmenite. Figure 10 (h,i,j,k). Scanning Electron Micrographs of ilmenite from the Panambur Beach. 5. CONCLUSIONS Texturally the Ullal beach sediments are medium in grain size, moderately to poorly sorted and fine to symmetrical skewed, mesokurtic in kurtosis and bimodal in distribution, whereas Thannirbhavi beach sands show medium to fine sand, moderately sorted, symmetrical – very coarse skewed in skewness and leptokurtic – mesokurtic in kurtosis. Unimodal distribution is registered in this beach. Penambur beach sediments are fine in nature, well sorted to moderately well sorted, coarse skewed, and mesokurtic to platykurtic in kurtosis. Domination of unimodal distribution prevailed in this beach. As far as heavy mineral is concerned, Thannirbhavi beach sector shows a higher percentage than the sediments in Ullal and Penambur beaches. Analysis of TiO2 percentage by wet chemical methods show higher percentage in Ullal than in Panambur and Thannirbhave beach sand which was further substantiated by EDAX analysis. X-ray diffraction analysis on ilmenite of Ullal, Thannirbhave and Panambur beach sediments show the peaks of only ilmenite, which is indicative of nonweathering nature of mineral. Scanning Electron Micrographs examinination reveals that the weathering mechanism, both mechanical and chemical, occurred with low intensity in ilmenite grain of the study area.  492 M. Sundararajan, K.H. Bhat, N. Babu, M.E.K. Janaki, P.N. Mohan Das Vol.8, No.6 ACKNOWLEDGMENT The financial support by the CSIR, New Delhi under the Xth Five Year Plan Net work programme is gratefully acknowledged. We thank the Director, NIIST Trivandrum for extending the laboratory facilities. REFERENCES 1 Suresh Babu, D.S., Thomas, K.A., Mohan Das, P.N. and Damodaran, A.D. (1994), Alteration of ilmenite in the Manavalakurichi deposit, India. Clays and Clay Minerals, 42, pp.567-571. 2 Suresh Babu, D. S., Das, D., Sudarsan, M., Reddy, V.R., Chintalapudi, S.N. and Majumdar, C.K. (1996), Fe Mössbauer studies on natural ilmenites. Ind. Jour. Of Pure and Applied Physics, 34, pp.474-479. 3 Suresh Babu, D.S. and Mohan Das, P.N. (1999), Mineralo-chemical assessment of ilmenites from the three Indian placers. Trans. Indian Inst. Met., 52, pp.73-79. 4 Rao, D.S., Murthy, G.V.S., Rao, K.V. Das, D. and Chintalapudi, S.N. (2002), Alteration characteristics of beach placer ilmenite from the Chatrapur coast, Orissa, India. Jour. Applied Geochemistry, Vol.4, No.1, pp.47-59. 5 M.Sundararajan, Usha Natesan, N.Babu and P. Seralathan. (2009), Sedimentological and Mineralogical investigation of beach sediments of a fast prograding cuspate foreland (Point Calimere), Southeast coast of India. Research Journal of Environmental Sciences. 3(2), 134- 148. 6 Abhijit Basu and Emanuela Molinaroli., (1989), Provenance Characteristics of Detrital opaque Fe - Ti Oxide Minerals. J. Sedi. Petrol., Vol.59, pp.922-934. 7 Subrahmanyam, N.P., Rao, N.K., Narasimhan, D and Rao, G.V.U., 1982, alteration of beach sand ilmenite from Manavalakurichi, Tamil nadu, India, Jour.Geol.Soc.India., Vol.23, pp.168-174. 8 Nair, G.A., Damodaran, K.T., and Suresh Babu, D.S., (1995), Mineralo-chemical analysis of ilmenite from the river Valliar and Manavalakurichi, Jour.Geol.Soc.India, Vol.6, pp.655-661. 9 Rajamanickam, G.V. (1983), Geological investigations of offshore heavy mineral placers of Konkan coast, Maharashtra, India. Ph.D.Thesis, Indian School of Mines, Dhanbad Unpublished) 258 p. 10 Rajamanickam, G.V. (1997), Provenance of sediments from transparent heavy minerals in the inner shelf of Central Maharashtra, India, in the Second South Asia Geological Congress at Colombo, (Eds) Wijayananda,N.P., Cooray, P.G., and Peter Mosley,M Geological Survey &Mines Bureau, Sri Lanka, pp.309-324. 11 Rao, D.S., T. V. Vijayakumar, S. Prabhakar, G. Bhaskar Raju and T.K.Ghosh (2005), Alteration Characteristics Of Ilmenites From South India, J. of Minerals & Metals Characterisation & Engineering, 4, pp. 47-59. 12 Folk, R.L. and Ward, W.C. (1957), Brazos river bar: A study in the significance of grain size parameters. Journal of Sedimentary Petrology, 27, p 3-26 13 Milner.I. (1962), Sedimentary Petrology. George Allen and Unwin Ltd., London, Vol.1 and2, p 643- 715.  Vol.8, No.6 Characterization Studies on Ilmenite of Ullal and Suratkal 493 14 Jelks Barksdale, (1966), Titanium its occurrence, chemistry and technology, The Ronald Press Company, New York 15 Agrawal B .C and S P Jain, (1976), A Textbook of metallurgical analysis, Khanna publishers, Delhi. 16 Forst M.T, Grey I.E, Harrowfield IR and Mason K; (1983), The dependence of alumina and silica contents on the alteration of weathered ilmenites from western Australia, Mineral Mag 47, pp.201-208. 17 Krinsley DH, Doornkamp JC, (1973), Atlas of quartz sand surface textures. Cambridge University Press, Cambridge, p 37. 18 Mallik, T. K., (1986).Micromorphology of some placer minerals from kerala beach,Indian,Marine Geology,71 (3)-(4),p371-381. 19 Mallik, T. K., V.Vasudevan, P. A.Verghese, and T.Machado, (1987). The Black sand placer deposits of Kerala beach, southwest India. Marine Geology 77: p129–150. 20 Anil Cherian, Nayanarpandian Chandrasekar, Victor Rajamanickam., (2004) Light minerals of beach sediments from Southern Tamilnadu, southeast coast of India Oceanologia, 46 (2),p 233–252. 21 Amber N. V., Gujar A.R., and Mislankar P.G. (2005), Surface Textures of quartz grains from Goa coast An Application of scanning Electron Microscope. Development planning of coastal placer minerals, p 121-132. |