Paper Menu >>
Journal Menu >>
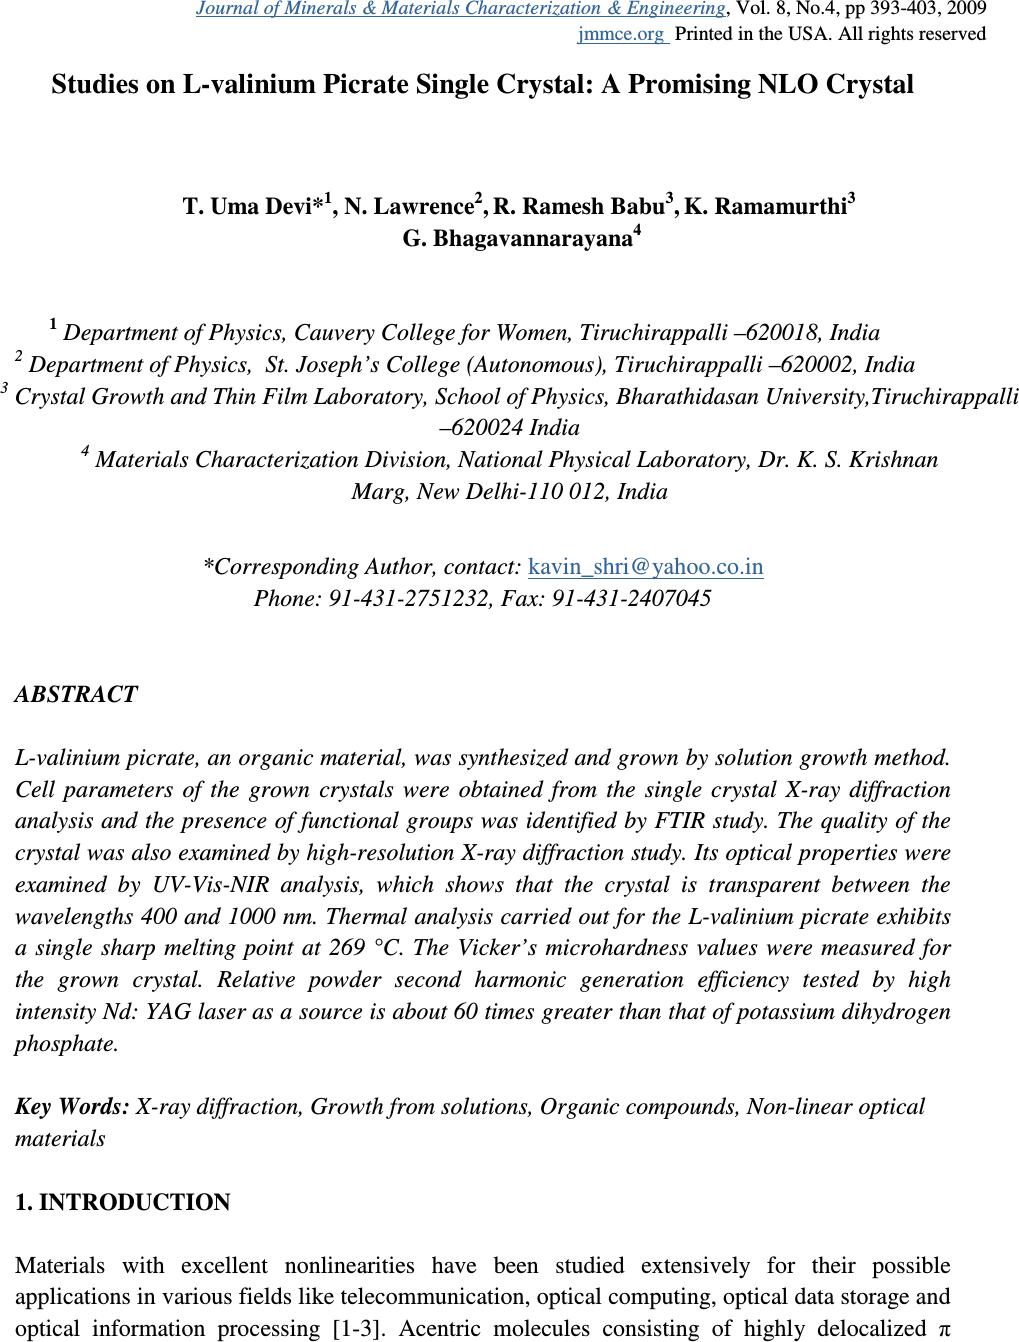 Journal of Minerals & Materials Characterization & Engineering, Vol. 8, No.4, pp 393-403, 2009 jmmce.org Printed in the USA. All rights reserved Studies on L-valinium Picrate Single Crystal: A Promising NLO Crystal T. Uma Devi* 1 , N. Lawrence 2 , R. Ramesh Babu 3 , K. Ramamurthi 3 G. Bhagavannarayana 4 1 Department of Physics, Cauvery College for Women, Tiruchirappalli –620018, India 2 Department of Physics, St. Joseph’s College (Autonomous), Tiruchirappalli –620002, India 3 Crystal Growth and Thin Film Laboratory, School of Physics, Bharathidasan University,Tiruchirappalli –620024 India 4 Materials Characterization Division, National Physical Laboratory, Dr. K. S. Krishnan Marg, New Delhi-110 012, India *Corresponding Author, contact: kavin_shri@yahoo.co.in Phone: 91-431-2751232, Fax: 91-431-2407045 ABSTRACT L-valinium picrate, an organic material, was synthesized and grown by solution growth method. Cell parameters of the grown crystals were obtained from the single crystal X-ray diffraction analysis and the presence of functional groups was identified by FTIR study. The quality of the crystal was also examined by high-resolution X-ray diffraction study. Its optical properties were examined by UV-Vis-NIR analysis, which shows that the crystal is transparent between the wavelengths 400 and 1000 nm. Thermal analysis carried out for the L-valinium picrate exhibits a single sharp melting point at 269 °C. The Vicker’s microhardness values were measured for the grown crystal. Relative powder second harmonic generation efficiency tested by high intensity Nd: YAG laser as a source is about 60 times greater than that of potassium dihydrogen phosphate. Key Words: X-ray diffraction, Growth from solutions, Organic compounds, Non-linear optical materials 1. INTRODUCTION Materials with excellent nonlinearities have been studied extensively for their possible applications in various fields like telecommunication, optical computing, optical data storage and optical information processing [1-3]. Acentric molecules consisting of highly delocalized π 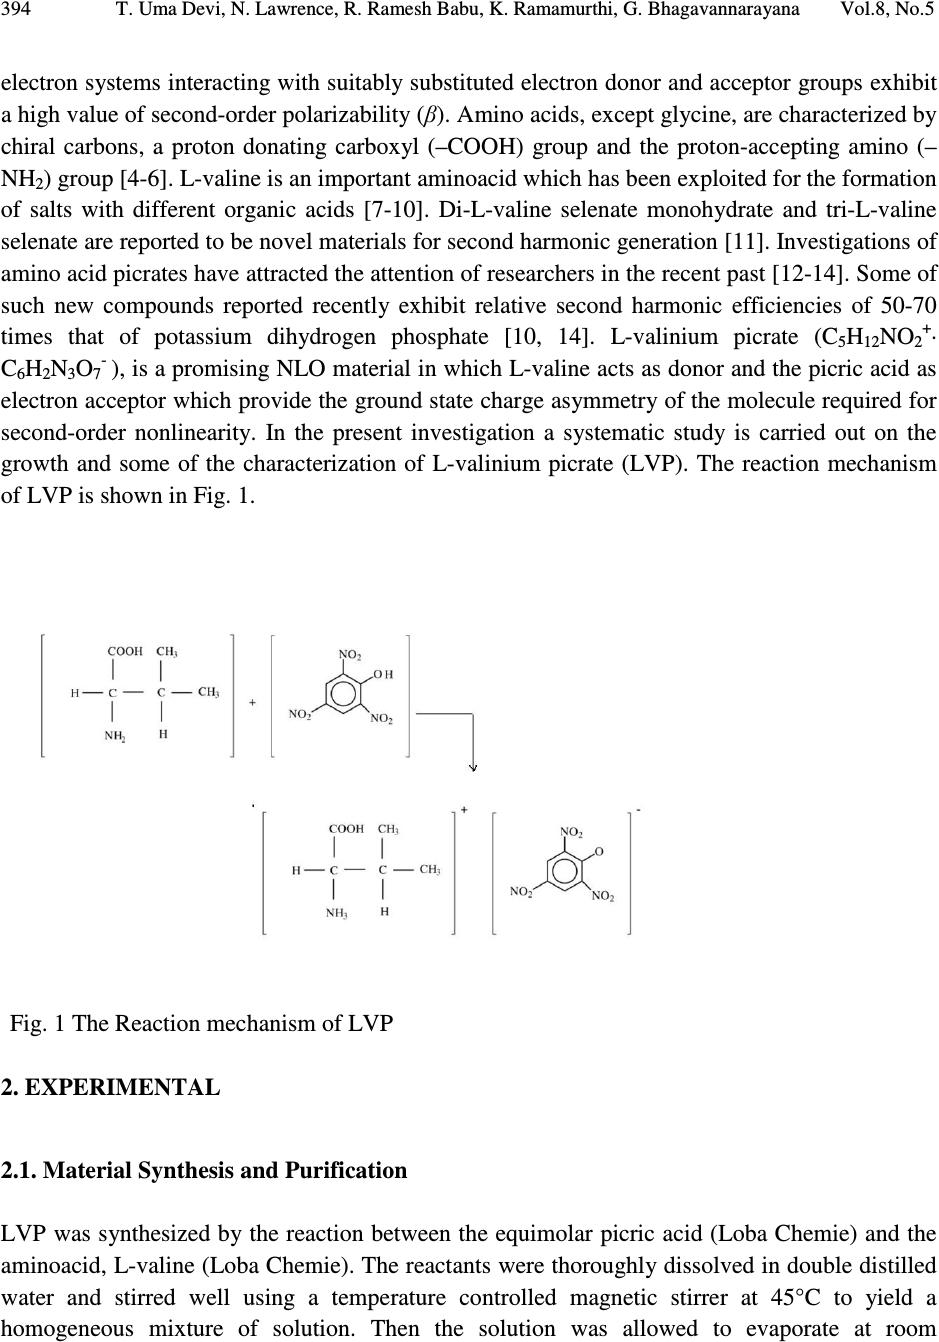 394 T. Uma Devi, N. Lawrence, R. Ramesh Babu, K. Ramamurthi, G. Bhagavannarayana Vol.8, No.5 electron systems interacting with suitably substituted electron donor and acceptor groups exhibit a high value of second-order polarizability (β). Amino acids, except glycine, are characterized by chiral carbons, a proton donating carboxyl (–COOH) group and the proton-accepting amino (– NH 2 ) group [4-6]. L-valine is an important aminoacid which has been exploited for the formation of salts with different organic acids [7-10]. Di-L-valine selenate monohydrate and tri-L-valine selenate are reported to be novel materials for second harmonic generation [11]. Investigations of amino acid picrates have attracted the attention of researchers in the recent past [12-14]. Some of such new compounds reported recently exhibit relative second harmonic efficiencies of 50-70 times that of potassium dihydrogen phosphate [10, 14]. L-valinium picrate (C 5 H 12 NO 2+ · C 6 H 2 N 3 O 7- ), is a promising NLO material in which L-valine acts as donor and the picric acid as electron acceptor which provide the ground state charge asymmetry of the molecule required for second-order nonlinearity. In the present investigation a systematic study is carried out on the growth and some of the characterization of L-valinium picrate (LVP). The reaction mechanism of LVP is shown in Fig. 1. Fig. 1 The Reaction mechanism of LVP 2. EXPERIMENTAL 2.1. Material Synthesis and Purification LVP was synthesized by the reaction between the equimolar picric acid (Loba Chemie) and the aminoacid, L-valine (Loba Chemie). The reactants were thoroughly dissolved in double distilled water and stirred well using a temperature controlled magnetic stirrer at 45°C to yield a homogeneous mixture of solution. Then the solution was allowed to evaporate at room 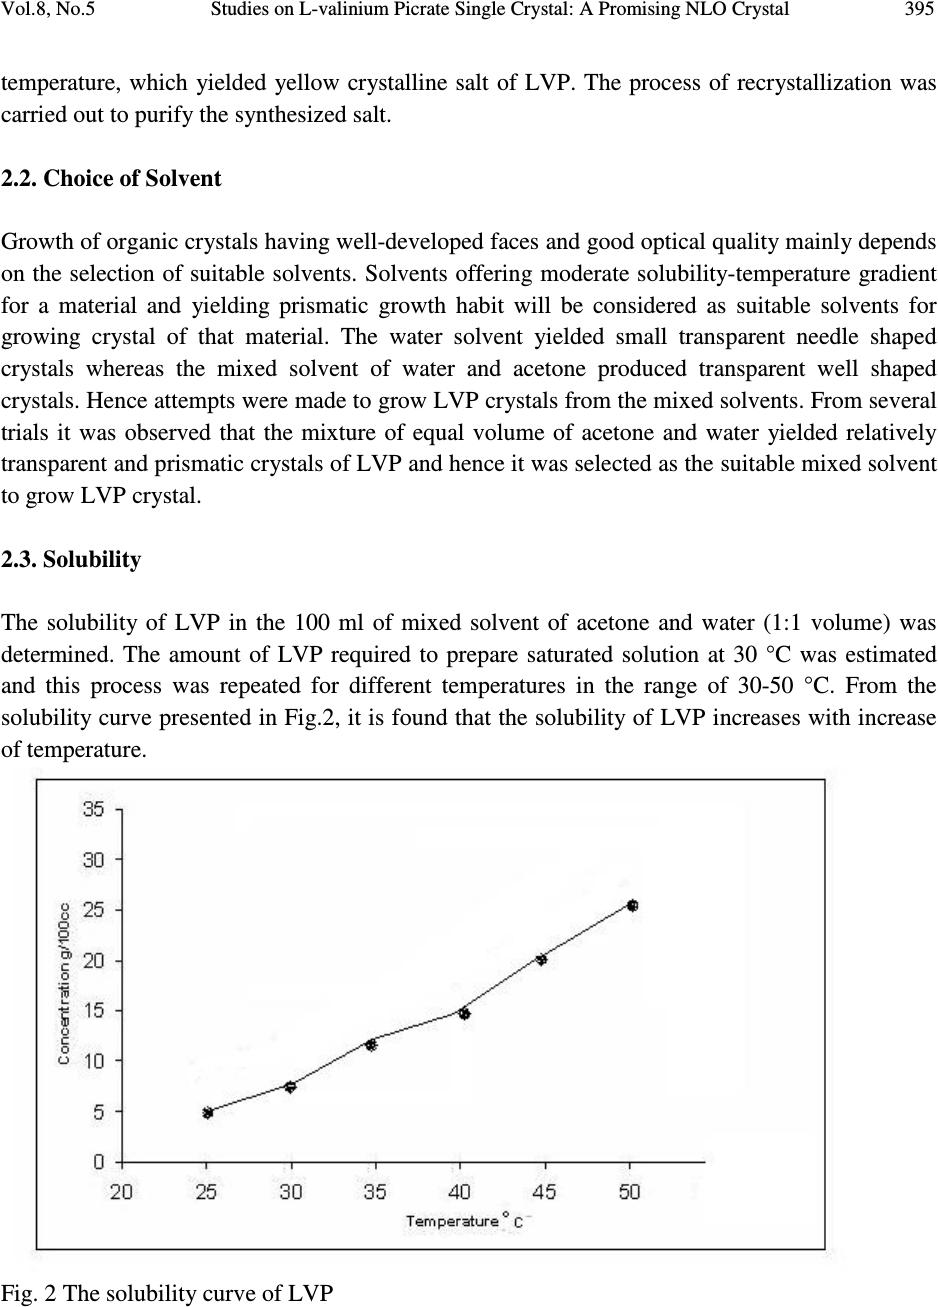 Vol.8, No.5 Studies on L-valinium Picrate Single Crystal: A Promising NLO Crystal 395 temperature, which yielded yellow crystalline salt of LVP. The process of recrystallization was carried out to purify the synthesized salt. 2.2. Choice of Solvent Growth of organic crystals having well-developed faces and good optical quality mainly depends on the selection of suitable solvents. Solvents offering moderate solubility-temperature gradient for a material and yielding prismatic growth habit will be considered as suitable solvents for growing crystal of that material. The water solvent yielded small transparent needle shaped crystals whereas the mixed solvent of water and acetone produced transparent well shaped crystals. Hence attempts were made to grow LVP crystals from the mixed solvents. From several trials it was observed that the mixture of equal volume of acetone and water yielded relatively transparent and prismatic crystals of LVP and hence it was selected as the suitable mixed solvent to grow LVP crystal. 2.3. Solubility The solubility of LVP in the 100 ml of mixed solvent of acetone and water (1:1 volume) was determined. The amount of LVP required to prepare saturated solution at 30 °C was estimated and this process was repeated for different temperatures in the range of 30-50 °C. From the solubility curve presented in Fig.2, it is found that the solubility of LVP increases with increase of temperature. Fig. 2 The solubility curve of LVP  396 T. Uma Devi, N. Lawrence, R. Ramesh Babu, K. Ramamurthi, G. Bhagavannarayana Vol.8, No.5 2.4. Crystal Growth Saturated solution of 100 ml was prepared at 35 °C using recrystallized LVP salt and was filtered with microfilters and taken in a glass beaker of 100 ml capacity. Then the beaker was sealed and placed at room temperature. LVP crystal of dimension about 9x7x3 mm 3 was harvested in a growth period of twenty days by slow evaporation of the solvent at room temperature and is given in Fig.3. Fig. 3 As grown LVP crystal 3. CHARACTERIZATIONS 3.1. X-ray Diffraction Studies 3.1.1. Single crystal X-ray diffraction Single crystal X-ray diffraction study was carried out on the as grown LVP crystal. The calculated unit cell parameters, presented in Table 1 are in good agreement with the corresponding reported value of Anitha et al. [15]. 3.1.2. High-resolution X-ray diffractometry study on LVP Before recording the diffraction curve, to remove the non-crystallized solute atoms remained on the surface of the crystal and also to ensure the surface planarity, the specimen was first lapped and chemically etched in a non preferential etchent of water and acetone mixture in 1:2 volume ratio. Fig. 4 shows the high-resolution rocking or diffraction curve (DC) recorded for a typical LVP specimen grown by slow evaporation solution technique using (002) diffracting planes in symmetrical Bragg geometry by employing the multicrystal X-ray diffractometer described  Vol.8, No.5 Studies on L-valinium Picrate Single Crystal: A Promising NLO Crystal 397 above with MoKα 1 radiation. As seen in the figure the DC contains a single peak without any satellite peaks which may otherwise be observed due to internal structural grain boundaries [17]. The full width at half maximum (FWHM) of the diffraction curves is 30 arc s, which is close to that expected from the plane wave dynamical theory of X-ray diffraction [18] for an ideally perfect crystal. The relatively less angular spread i.e. around 200 arc s, lesser FWHM value and the single peak of the DC indicate that the crystalline quality is reasonably good without having any internal structural grain boundaries. Table 1. Comparison of single crystal X-ray data of LVP crystal Parameters Present work Anitha et al. [15] a (Å) 9.9770 9.9714 b (Å) 6.2394 6.2930 c (Å) 12.6420 12.6480 System monoclinic monoclinic β ( ˚) 110.16 110.50 Space group - P2 1 Fig. 4 Diffraction curve recorded for LVP single crystal using (002) diffracting planes by employing the multicrystal X-ray diffractometer with MoKα 1 radiation 3.2. FT-IR Spectral Analysis The FTIR spectrum of the LVP crystal, recorded in the KBr phase in the frequency region 400cm -1 – 4000 cm -1 using Perkin–Elmer spectrometer, is shown in Fig. 5. The phenolic O  398 T. Uma Devi, N. Lawrence, R. Ramesh Babu, K. Ramamurthi, G. Bhagavannarayana Vol.8, No.5 vibration produces peak at 1136 cm -1 reveals that picric acid necessarily protanates the carboxyl group [19]. The observed vibrational frequencies and the tentative frequency assignments of LVP are given in Table 2. Fig. 5 FT-IR spectrum of LVP 3.3. Optical Transmittance of LVP The optical transmittance spectrum of LVP recorded using Shimadzu model 1601 in the range of 300–1000 nm is shown in Fig. 6a. Optically clear single crystal of thickness about 2 mm was used for this study. There is no appreciable absorption of light in the entire visible range as is the case of other amino acids [14]. The transmittance between 500 and 1000 nm is approximately 65 %. The short wavelength cutoff occurs at 480 nm. The peaks in the range between 300 and 350 nm, are due to n to π* transitions of carbonyl group. The optical transmission range shows that LVP is a potential candidate for SHG. The value of band gap energy was estimated from the graph between hv and ( α hv) 2 by extrapolating the linear portion of the curve to zero absorption (Fig. 6b). The bandgap energy calculated is about 2.24 eV for the LVP single crystal.  Vol.8, No.5 Studies on L-valinium Picrate Single Crystal: A Promising NLO Crystal 399 Table 2 Comparison of vibrational frequencies of LVP LVP (cm -1 ) Present Work LVP (cm -1 ) [18] Assignments [19] 1636 1630 NH 3 + asymmetric deformation 1509 1535 NH 3 + symmetric deformation 1394 1365 CH 3 symmetric deformation 1330 1349 (NO 2 ) symmetric stretching 1271 1267 phenolic C–O stretching . 1064 1060 C–C stretching 1030 1017 –(CH 3 ) 2 sym stretching 944 915 [NH 3 ] + rocking ; C–C stretching 893 872 C-C-N symmetric stretching 821 820 NO 2 deformation 767 747 NO 2 wagging 713 706 CH 3 rocking 662 676 C–C out-of-plane ring deformation 542 521 NO 2 rocking Fig. 6a Transmittance of LVP  400 T. Uma Devi, N. Lawrence, R. Ramesh Babu, K. Ramamurthi, G. Bhagavannarayana Vol.8, No.5 Fig. 6b Plot of ( α hv) 2 vs hv 3.4. Powder SHG Measurement The study of nonlinear optical conversion efficiency was carried out using the experimental setup of Kurtz and Perry [20]. A Q-switched Nd: YAG laser beam of wavelength 1064 nm, with an input power of 5.6 mJ, and pulse of width 8 ns with a repetition rate of 10 Hz were used. The grown single crystal of LVP was powdered with a uniform particle size and then packed in a microcapillary of uniform bore and exposed to laser radiations. The generation of the second harmonics was confirmed by the emission of green light. A sample of potassium dihydrogen phosphate (KDP), also powdered to the same particle size as the experimental sample, was used as a reference material in the present measurement. The relative SHG conversion efficiency of LVP is found to be about 60 times that of KDP. This may be attributed to the molecular structure of LVP in which the carboxyl group of the valinium residue is engaged in a strong hydrogen bond with the picrate anion [16]. The amino group of the L-valinium cation and the picrate anion are held together by an intermolecular hydrogen bond. Table 3 shows comparison of SHG signal energy output of LVP Table 4 compares the relative SHG efficiency of some of the aminoacid picrates. Table 3.Comparison of SHG signal energy output Input power mJ/pulse KDP mV LVP V 5.6 22 1.32 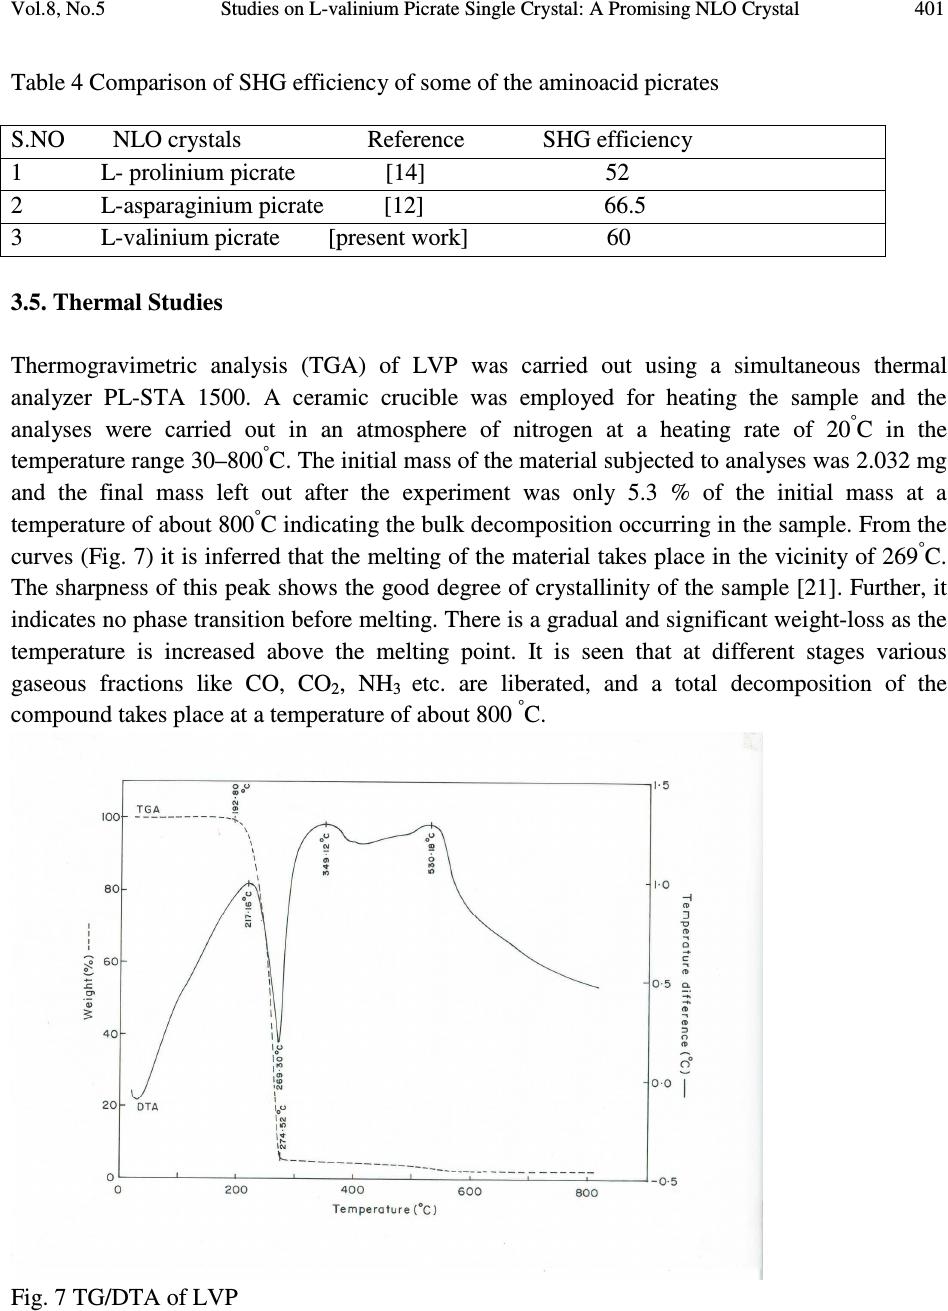 Vol.8, No.5 Studies on L-valinium Picrate Single Crystal: A Promising NLO Crystal 401 Table 4 Comparison of SHG efficiency of some of the aminoacid picrates S.NO NLO crystals Reference SHG efficiency 1 L- prolinium picrate [14] 52 2 L- asparaginium picrate [12] 66.5 3 L-valinium picrate [present work] 60 3.5. Thermal Studies Thermogravimetric analysis (TGA) of LVP was carried out using a simultaneous thermal analyzer PL-STA 1500. A ceramic crucible was employed for heating the sample and the analyses were carried out in an atmosphere of nitrogen at a heating rate of 20 ° C in the temperature range 30–800 ° C. The initial mass of the material subjected to analyses was 2.032 mg and the final mass left out after the experiment was only 5.3 % of the initial mass at a temperature of about 800 ° C indicating the bulk decomposition occurring in the sample. From the curves (Fig. 7) it is inferred that the melting of the material takes place in the vicinity of 269 ° C. The sharpness of this peak shows the good degree of crystallinity of the sample [21]. Further, it indicates no phase transition before melting. There is a gradual and significant weight-loss as the temperature is increased above the melting point. It is seen that at different stages various gaseous fractions like CO, CO 2 , NH 3 etc. are liberated, and a total decomposition of the compound takes place at a temperature of about 800 ° C. Fig. 7 TG/DTA of LVP  402 T. Uma Devi, N. Lawrence, R. Ramesh Babu, K. Ramamurthi, G. Bhagavannarayana Vol.8, No.5 3.6. Vickers Microhardness Study The mechanical strength of the LVP crystal was measured using a Leitz hardness tester fitted with a diamond indenter attached to Leitz incident light microscope. Indentations were made for various loads from 5 g to 50 g. Several trials of indentation were carried out on the prominent face and the average diagonal length was calculated for an indentation time of 5 seconds. The Vickers hardness number (H V ) of the crystal was calculated using the relation H V = 1.8544 P/d 2 where P is the applied load in Kg and d is the average diagonal length of impression in mm. Fig.8 shows the variation of Vickers hardness number with load for LVP. Cracks were observed for loads more than 50 g. Fig.8 Vickers Microhardness values of LVP 4. CONCLUSION The potential organic NLO crystal of L-valinium picrate (LVP) was grown by slow evaporation at room temperature. Single crystal X-ray diffraction study revealed that the LVP crystal grown at room temperature belongs to monoclinic system. The quality of the crystal examined by high- resolution X-ray diffraction study indicates that the crystalline quality is reasonably good without having any internal structural grain boundaries. Vibrational frequencies were assigned from FT- IR spectral analysis, which confirm the presence of functional groups of the LVP. The UV- Visible-NIR spectrum of LVP showed that the crystal is transparent in the range of 500 – 1000 nm. The band gap energy of LVP estimated from the optical transmittance spectrum is about 2.24 eV. TGA shows the good thermal stability of the material. The hardness measurement shows that the grown LVP crystal is mechanically stable only up to 50g. Its relative SHG  Vol.8, No.5 Studies on L-valinium Picrate Single Crystal: A Promising NLO Crystal 403 efficiency tested by high intensity Nd: YAG laser as a source is about 60 times greater than that of KDP. Owing to these properties LVP could be a promising material for NLO applications. REFERENCE [1] Marcy, H. O., Rosker, M. J., Warren, L. F., Cunningham, P. H., Thomas, C. A., Deloach, L. A., Velsco, S. P., Ebbers, C. A., Liao, J. H., and Kanatzidis, M. U., 1995, Opt. Letters, Vol. 20, pp. 252. [2] Gupte, S. S., Marcarno, A., Pradhan, D., Desai, C. F., and Melikechi, N., 2001, J. Appl. Phys., Vol. 89, pp. 4939. [3] Calark, R. S., 1988, Photonics Spectra, Vol. 22, pp. 135. [4] Davydov, B. L., Derkacheva, L. D., Dunina, V. V., Zhabotinskii, M. E., Zolin, V. F., Koreneva, L. G., and Samokhina, M. A., 1971, Optikai Spektroskopiya, Vol. 30, pp. 503. [5] Razzetti, C., Ardoino, M., Zanotti, L., Zha, M., and Paorici, C., 2002, Cryst. Res. Technol., Vol. 37, pp. 456. [6] Bhat, M. N., Dharmaprakash, S. M., 2002, J. Cryst. Growth, Vol. 236, pp. 376. [7] Rao, S. T., 1969, Z. Kristallogr., Vol. 128, pp. 339. [8] Parthasarathy, R., 1966, Acta Cryst., Vol. 21, pp. 422. [9] Pandiarajan, S., Sridhar, B., Rajaram, R. K., 2001, Acta Cryst., Vol. E57, pp. o466 . [10] Srinivasan, N., Rajaram, R. K., Jebaraj, D. D., 1997, Z. Kristallogr., Vol. 212, pp. 311. [11] Nìmec, I., Gyepes, R., Mièka Z., and Trojánek, F., 2002, Mat. Res. Soc. Symp. Proc., Vol. 725, pp. 9.2.1. [12] Srinivasan, P., Kanagasekaran, T., Gopalakrishnan, R., Bhagavannarayana, G., Ramasamy, P., 2006, Cryst. Growth Des., Vol. 6, pp. 1663. [13] Martins, T. S., Matos, J. R., Vicentini, G., Isolani, P. C., 2006, J. Therm. Anal. Calorimetry, Vol. 86, pp. 351. [14] Devi, T. U., Lawrence, N., Babu, R. R., Ramamurthi, K., 2008, J. Cryst. Growth, Vol. 310, pp. 116. [15] Anitha, K., Sridhar, B., and Rajaram, R. K., 2004, Acta Cryst., Vol. E60, pp. o1530. [16] Bhagavannarayana, G., Ananthamurthy, R.V., Budakoti, G. C., Kumar, B., Bartwal K. S., 2005, J. Appl. Cryst., Vol. 38, pp. 768. [17] Betterman B.W., and Cole, H., 1964, Rev. Mod. Phys., Vol. 36, pp. 681 [18] Senthilkumar, S., Mary, M. B., Ramakrishnan, V., 2006, J. Raman Spectrosc., Vol. 38, pp. 288. [19] Biemann, K., 1989, Tables of Spectral Data for Structure Determination of Organic Compounds, Springer-Verlag, Berlin Heidelberg. [20] Kurtz, S. K., Perry, T. T., 1968, J. Appl. Phys., Vol. 39, pp. 3798. [21] Hameed, S. H., Ravi, G., Dhanasekaran, R., Ramasamy, P., 2000, J. Crystal Growth, Vol. 212, pp. 227. |