Paper Menu >>
Journal Menu >>
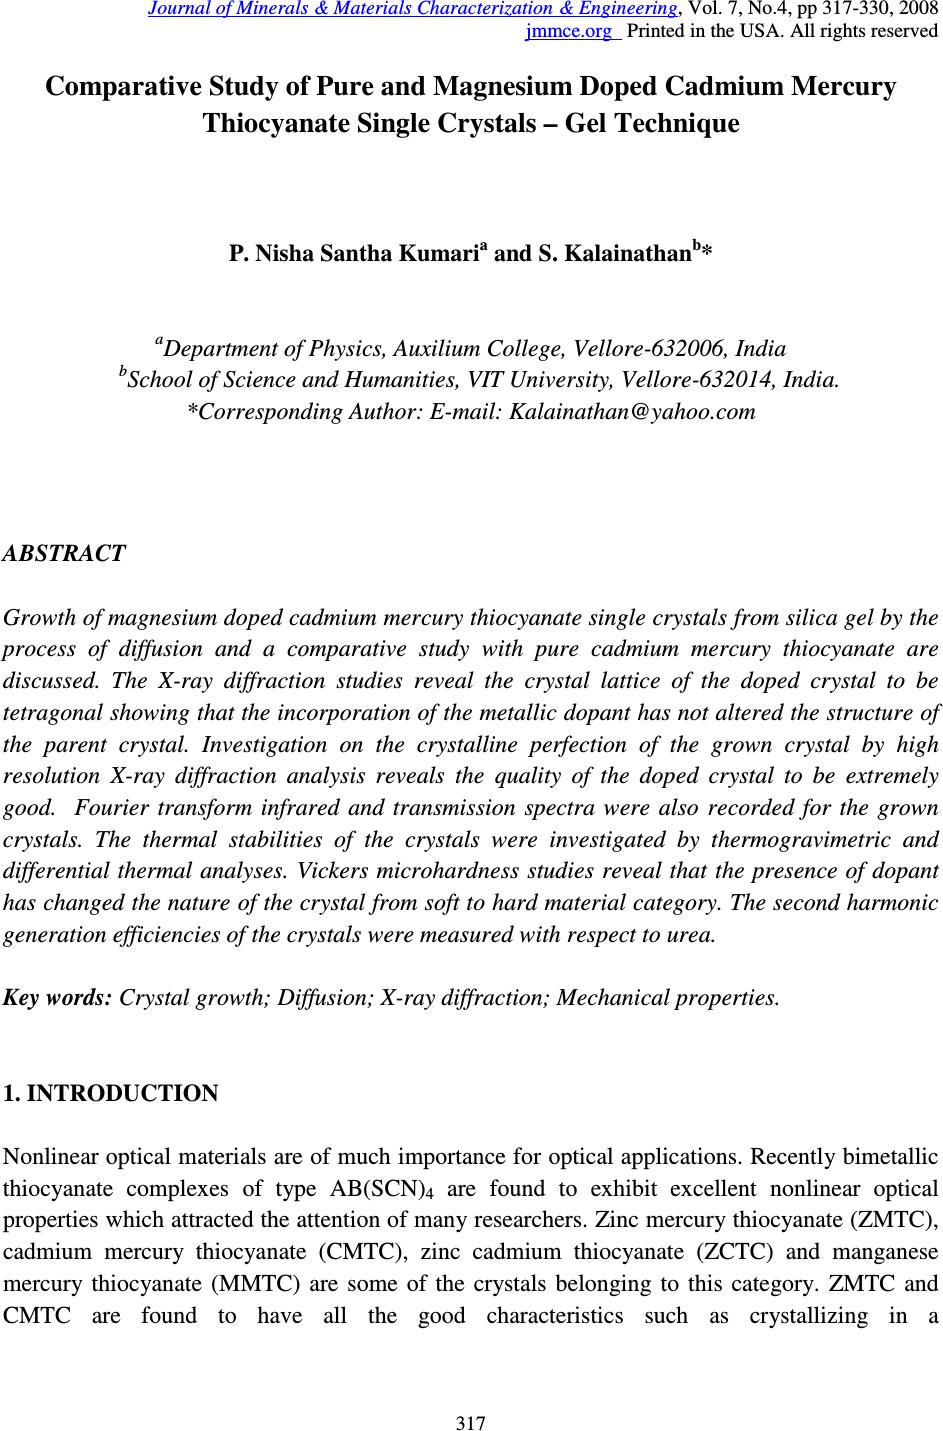 Journal of Minerals & Materials Characterization & Engineering, Vol. 7, No.4, pp 317-330, 2008 jmmce.org Printed in the USA. All rights reserved 317 Comparative Study of Pure and Magnesium Doped Cadmium Mercury Thiocyanate Single Crystals – Gel Technique P. Nisha Santha Kumari a and S. Kalainathan b * a Department of Physics, Auxilium College, Vellore-632006, India b School of Science and Humanities, VIT University, Vellore-632014, India. *Corresponding Author: E-mail: Kalainathan@yahoo.com ABSTRACT Growth of magnesium doped cadmium mercury thiocyanate single crystals from silica gel by the process of diffusion and a comparative study with pure cadmium mercury thiocyanate are discussed. The X-ray diffraction studies reveal the crystal lattice of the doped crystal to be tetragonal showing that the incorporation of the metallic dopant has not altered the structure of the parent crystal. Investigation on the crystalline perfection of the grown crystal by high resolution X-ray diffraction analysis reveals the quality of the doped crystal to be extremely good. Fourier transform infrared and transmission spectra were also recorded for the grown crystals. The thermal stabilities of the crystals were investigated by thermogravimetric and differential thermal analyses. Vickers microhardness studies reveal that the presence of dopant has changed the nature of the crystal from soft to hard material category. The second harmonic generation efficiencies of the crystals were measured with respect to urea. Key words: Crystal growth; Diffusion; X-ray diffraction; Mechanical properties. 1. INTRODUCTION Nonlinear optical materials are of much importance for optical applications. Recently bimetallic thiocyanate complexes of type AB(SCN) 4 are found to exhibit excellent nonlinear optical properties which attracted the attention of many researchers. Zinc mercury thiocyanate (ZMTC), cadmium mercury thiocyanate (CMTC), zinc cadmium thiocyanate (ZCTC) and manganese mercury thiocyanate (MMTC) are some of the crystals belonging to this category. ZMTC and CMTC are found to have all the good characteristics such as crystallizing in a 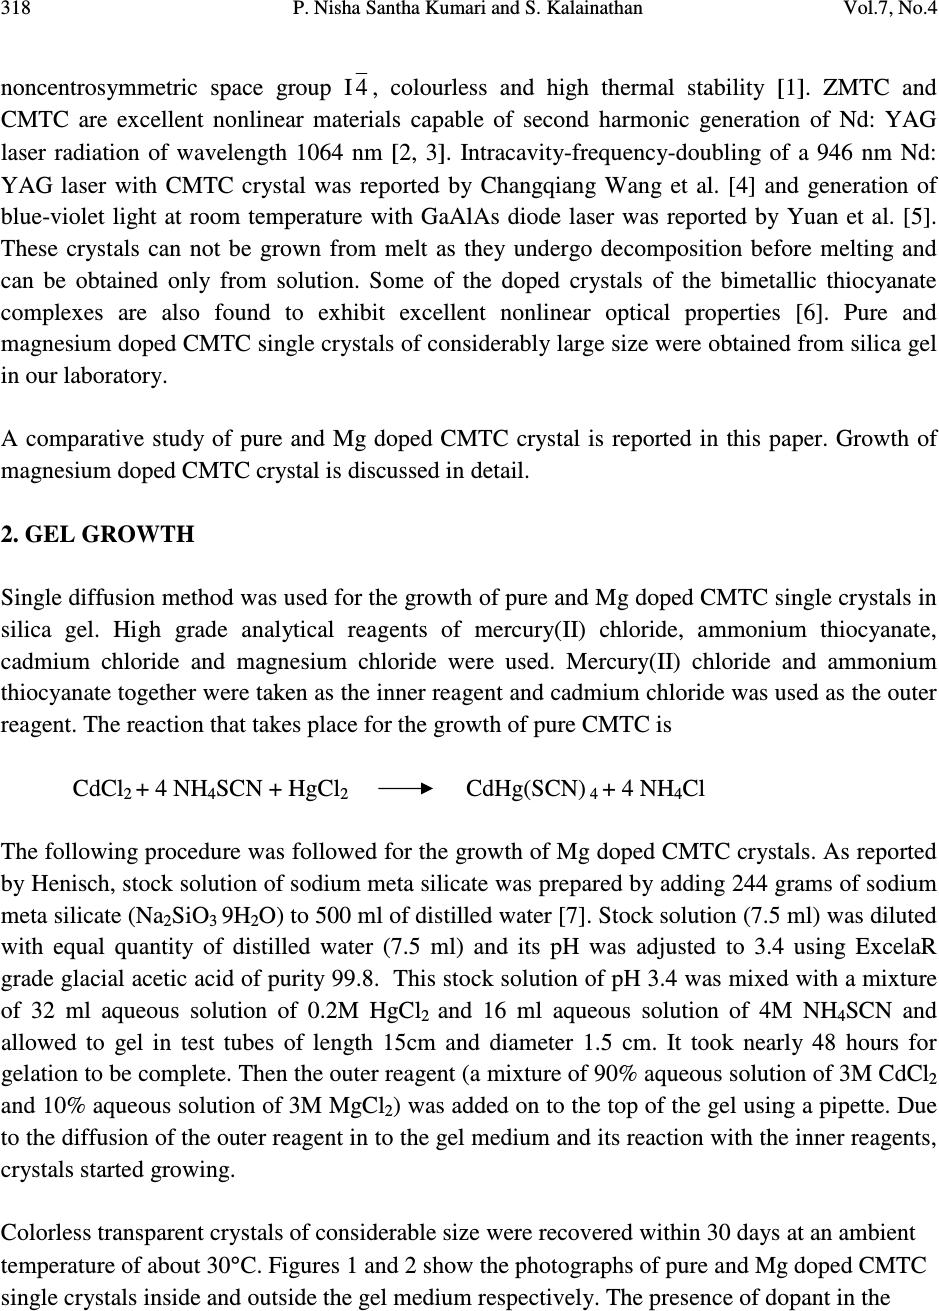 318 P. Nisha Santha Kumari and S. Kalainathan Vol.7, No.4 noncentrosymmetric space group I 4 , colourless and high thermal stability [ 1 ] . ZMTC and CMTC are excellent nonlinear materials capable of second harmonic generation of Nd: YAG laser radiation of wavelength 1064 nm [ 2, 3 ] . Intracavity-frequency-doubling of a 946 nm Nd: YAG laser with CMTC crystal was reported by Changqiang Wang et al. [4] and generation of blue-violet light at room temperature with GaAlAs diode laser was reported by Yuan et al. [5]. These crystals can not be grown from melt as they undergo decomposition before melting and can be obtained only from solution. Some of the doped crystals of the bimetallic thiocyanate complexes are also found to exhibit excellent nonlinear optical properties [6]. Pure and magnesium doped CMTC single crystals of considerably large size were obtained from silica gel in our laboratory. A comparative study of pure and Mg doped CMTC crystal is reported in this paper. Growth of magnesium doped CMTC crystal is discussed in detail. 2. GEL GROWTH Single diffusion method was used for the growth of pure and Mg doped CMTC single crystals in silica gel. High grade analytical reagents of mercury(II) chloride, ammonium thiocyanate, cadmium chloride and magnesium chloride were used. Mercury(II) chloride and ammonium thiocyanate together were taken as the inner reagent and cadmium chloride was used as the outer reagent. The reaction that takes place for the growth of pure CMTC is CdCl 2 + 4 NH 4 SCN + HgCl 2 CdHg(SCN) 4 + 4 NH 4 Cl The following procedure was followed for the growth of Mg doped CMTC crystals. As reported by Henisch, stock solution of sodium meta silicate was prepared by adding 244 grams of sodium meta silicate (Na 2 SiO 3 9H 2 O) to 500 ml of distilled water [7]. Stock solution (7.5 ml) was diluted with equal quantity of distilled water (7.5 ml) and its pH was adjusted to 3.4 using ExcelaR grade glacial acetic acid of purity 99.8. This stock solution of pH 3.4 was mixed with a mixture of 32 ml aqueous solution of 0.2M HgCl 2 and 16 ml aqueous solution of 4M NH 4 SCN and allowed to gel in test tubes of length 15cm and diameter 1.5 cm. It took nearly 48 hours for gelation to be complete. Then the outer reagent (a mixture of 90% aqueous solution of 3M CdCl 2 and 10% aqueous solution of 3M MgCl 2 ) was added on to the top of the gel using a pipette. Due to the diffusion of the outer reagent in to the gel medium and its reaction with the inner reagents, crystals started growing. Colorless transparent crystals of considerable size were recovered within 30 days at an ambient temperature of about 30 ° C. Figures 1 and 2 show the photographs of pure and Mg doped CMTC single crystals inside and outside the gel medium respectively. The presence of dopant in the  Vol.7, No.4 Comparative Study of Pure and Magnesium Doped Cadmium Mercury 319 crystal has been quantitatively computed from the inductively coupled plasma analysis as 0.0093 % using the formula: Weight % = (Concentration in ppm or mg/L X Volume in ml X 10 -4 ) / Weight of the sample in g Concentration of Mg = 0.184 mg/L, Weight of the sample = 0.09866 g, Volume = 50 ml. Fig. 1. Single crystals in gel medium (a) Pure CMTC (b) Mg doped CMTC. Fig. 2. As grown single crystals (a) Pure CMTC (b) Mg doped CMTC. 3. CHARACTERIZATIONS The experimental details of the characterizations carried out for the gel-grown single crystals are briefly described below. The powder X-ray diffractometry analysis was performed with a graphite monochromated CuK α radiation. Single crystal X-ray diffraction analysis was performed on ENRAF NONIUS FR590 diffractometer with Mo K α radiation of wavelength 0.7170 Å. (a) (b) (a) (b)  320 P. Nisha Santha Kumari and S. Kalainathan Vol.7, No.4 The crystalline perfection of the grown crystals was analyzed with a multicrystal X-ray diffractometer developed at National Physical Laboratory (NPL) [8]. In this system, a fine focus (0.4 x 8 mm; 2 kW Mo) X-ray source energized by a well-stabilized Philips X-ray generator (PW 1743) was employed. The well-collimated and monochromated MoK α 1 beam obtained from the three monochromator Si crystals set in dispersive (+,-,-) configuration has been used as the exploring X-ray beam. This arrangement improves the spectral purity ( ∆λ / λ << 10 -5 ) of the MoK α 1 beam. The divergence of the exploring beam in the horizontal plane (plane of diffraction) was estimated to be << 3 arc sec. The specimen crystal is aligned in the (+,-,-,+) configuration. Due to dispersive configuration, though the lattice constant of the monochromator crystal and the specimen are different, the unwanted dispersion broadening in the diffraction curve of the specimen crystal is insignificant. The specimen can be rotated about a vertical axis, which is perpendicular to the plane of diffraction, with minimum angular interval of 0.5 arc sec. The diffracted intensity is measured using a scintillation counter and is mounted with its axis along a radial arm of the turn table. The rocking or diffraction curves were recorded by changing the glancing angle (angle between the incident X-ray beam and the surface of the specimen) around the Bragg diffraction peak position θ B starting from a suitable arbitrary glancing angle (denoted as zero). The Fourier transform infra red spectra were recorded for the powdered samples with AVATAR 330 FTIR spectrometer in the region 4000--400 cm -1 using the KBr pellet technique. The transmission spectra were recorded for the samples in solution state using HITACHI U-2800 double beam spectrophotometer in the wavelength range 200-1000 nm. To investigate the thermal stability of the crystals, thermogravimetric and differential thermal analyses (TG/DTA) were carried out in nitrogen atmosphere in the temperature range 50-- 1100 ° C using an STA 409PC instrument. Vickers microhardness studies were carried out using an MH-112 Vickers microhardness tester (Japan). Kurtz powder test was carried out to determine its second harmonic generation efficiency in comparison with urea. 4. RESULTS AND DISCUSSION 4.1. X-ray Diffraction Analysis The powder X-ray diffraction patterns of pure and Mg doped CMTC crystals are shown in Fig. 3. The diffraction planes are identified and indexed. The single crystal X-ray data collected using ENRAF NONIUS FR590 diffractometer were solved by the direct method and refined by the full matrix least square technique using SHELHL program. The crystal structure of Mg doped  Vol.7, No.4 Comparative Study of Pure and Magnesium Doped Cadmium Mercury 321 CMTC is determined to be tetragonal revealing that the incorporation of the dopant has not changed the structure of the parent crystal. The variations in intensity of peaks, lattice parameters and increase in cell volume attribute to the incorporation of the dopant in the crystal. The lattice parameters of pure and Mg doped CMTC crystals are a = b = 11.473 Å, c = 4.250 Å, ∝ = β = γ = 90 ° and V = 559.43 Å 3 (Pure CMTC). a = b = 11.445 Å, c = 4.206 Å, ∝ = β = γ = 90 ° and V = 550.94 Å 3 (Mg doped CMTC). Fig. 3. Powder X-ray diffraction pattern (a) Pure CMTC (b) Mg doped CMTC. 10 20 30 40 50 60 70 0 100 200 300 400 500 600 700 C M T C Intensity 2 Theta (110) (200) (101) (211) (301) (321) (411) (440) (202) (521) (312) (541) (422) (631) (701) (800) (622) (a) 1 02 03 0405 06 07 08 0 0 1 0 0 0 2 0 0 0 3 0 0 0 4 0 0 0 5 0 0 0 6 0 0 0 Mg doped CMTC Intensity 2 Theta (200) (101) (211) (330) (321) (112) (521) (202) (620) (402) (512) (213) (840) (b)  322 P. Nisha Santha Kumari and S. Kalainathan Vol.7, No.4 4.2. X-ray Rocking Curve Studies Fig. 4 shows the high-resolution diffraction curves recorded for (2 0 0) plane of pure CMTC and (1 0 1) plane of Mg doped CMTC with a multicrystal X-ray diffractometer in symmetrical Bragg geometry. Before recording the diffraction curves the specimen surfaces were prepared by lapping and polishing and then chemically etched by a non-preferential chemical, mixed with water and acetone in 1:2 ratios. The diffraction curve for pure CMTC contains two additional peaks which are 16 and 37 arc sec away from the main peak. These two additional peaks correspond to two internal structural very low angle (tilt angle ≤ 1 arc min) boundaries [9] whose tilt angles (misorientation angle between the two crystalline regions on both sides of the structural grain boundary) are 16 and 21 arc sec from their adjoining regions. The FWHM (full width at half maximum) of the main peak and the low angle boundaries are respectively 20, 17 and 21 arc sec. Though the specimen contains very low angle boundaries, the relatively low angular spread of around 150 arc sec of the diffraction curve and the low FWHM values show that the crystalline perfection is quite good . In the case of Mg doped CMTC, the solid line in the figure is well fitted with the experimental points represented by the open circles. The specimen does not contain any internal structural grain boundaries. The FWHM (full width at half maximum) of the sharp main peak is very low (32 arc sec) showing that the crystalline perfection is very good revealing that it is a suitable candidate for nonlinear applications. Fig. 4. X-ray rocking curve recorded for (202) plane (a) Pure CMTC (b) Mg doped CMTC. 4.3. Fourier Transform Infrared Spectroscopic Studies The Fourier transform infrared spectral analysis is a technique in which almost all functional groups in a molecule absorb characteristic frequencies. The absorption of IR radiation causes (b)  Vol.7, No.4 Comparative Study of Pure and Magnesium Doped Cadmium Mercury 323 bending and stretching vibrations. The most important range being 4000—400 cm -1 , FTIR spectrum was recorded in that range using KBr pellet technique. Fig. 5 shows the FTIR spectra of pure and Mg doped CMTC. The absorption peaks and the assignment of frequencies are shown in Table 1. Fig. 5. FTIR spectrum (a) Pure CMTC (b) Mg doped CMTC. Pure CMTC 20 30 40 50 60 70 80 90 100 % T ransm i tt ance 1000 2000 3000 Wavenumbers (cm-1) (a) Mg doped -40 -20 0 20 40 60 80 100 %Transmittance 1000 2000 3000 Wavenumbers (cm-1) (b)  324 P. Nisha Santha Kumari and S. Kalainathan Vol.7, No.4 Table 1. FTIR bands of pure and Mg doped CMTC. Crystals ν νν ν CN ν νν ν CS δ δδ δ NCS 2 δ δδ δ NCS CMTC 2110.24 767.75 463.18, 440.86 927.73, 883.33 Mg doped 2111.42 715.42 459.69, 439.83 928.84, 874.01 It is well known that CN stretching vibration often lies higher than 2100 cm -1 , CS stretching lies between 860-780 cm -1 (N-bonding) or 720-690 cm -1 (S-bonding) and SCN bending vibration lies near 480 cm -1 (N-bonding) or 420 cm -1 (S-bonding) [10, 11]. From the table it is obvious that ν CN is higher than 2100 cm -1 in both the cases and the CS vibration is observed around 770 cm -1 in pure CMTC and around 715 cm -1 in Mg doped CMTC indicating S-bonding in the complex in Mg doped CMTC crystal. The intense broad band observed around 3500 cm -1 and the weak band around 1650 cm -1 in the IR spectra of the pure and Mg doped crystals correspond to stretching and bending modes of water respectively. 4.4. Transmission Spectral Analysis The transmission spectra were recorded in solution state using the ethanol-water (ratio 1:1) solvent. The powdered samples were dissolved in the mixed solvent (803 mmol/l) and transmission spectra were recorded using HITACHI model U-2800 double beam spectrophotometer in the wavelength range 200-1000 nm. The spectra of pure and doped CMTC are shown in Fig. 6. The transparency cut offs are at 311 and 315 nm respectively in pure and Mg doped CMTC. 200 300400 500600 70080090010001100 nm CM TC 0 10 20 30 40 50 60 70 80 90 100 % T (a)  Vol.7, No.4 Comparative Study of Pure and Magnesium Doped Cadmium Mercury 325 Fig. 6. Transmission spectrum (a) Pure CMTC (b) Mg doped CMTC. 4.5. Thermal Analysis Thermogravimetric and differential thermal (TG/DTA) analyses were carried out for the grown crystals in nitrogen atmosphere at a heating rate of 20°C/min. Fig. 7 shows the TG/DTA curves of pure and Mg doped CMTC. The losses of masses at different stages in pure and doped CMTC are shown in Table 2. Table 2: Thermal analysis (TG) data of pure and Mg doped CMTC. Pure CMTC Mg doped CMTC Tempe. Range Mass loss Temp. Range Mass loss 272 - 298°C 8.48 % 274 – 324°C 8.84 % 298 - 668°C 65.71 % 324 - 600°C 56.87 % 668 - 1099°C 4.49 % 600 - 792°C 7.47 % Residue 19.22 % 911 - 1099°C 1.4 % Residue 23.96 % 200 300400500 600700 80090010001100 nm M g-d o p e d-CMTC 0 10 20 30 40 50 60 70 80 90 100 % T (b) 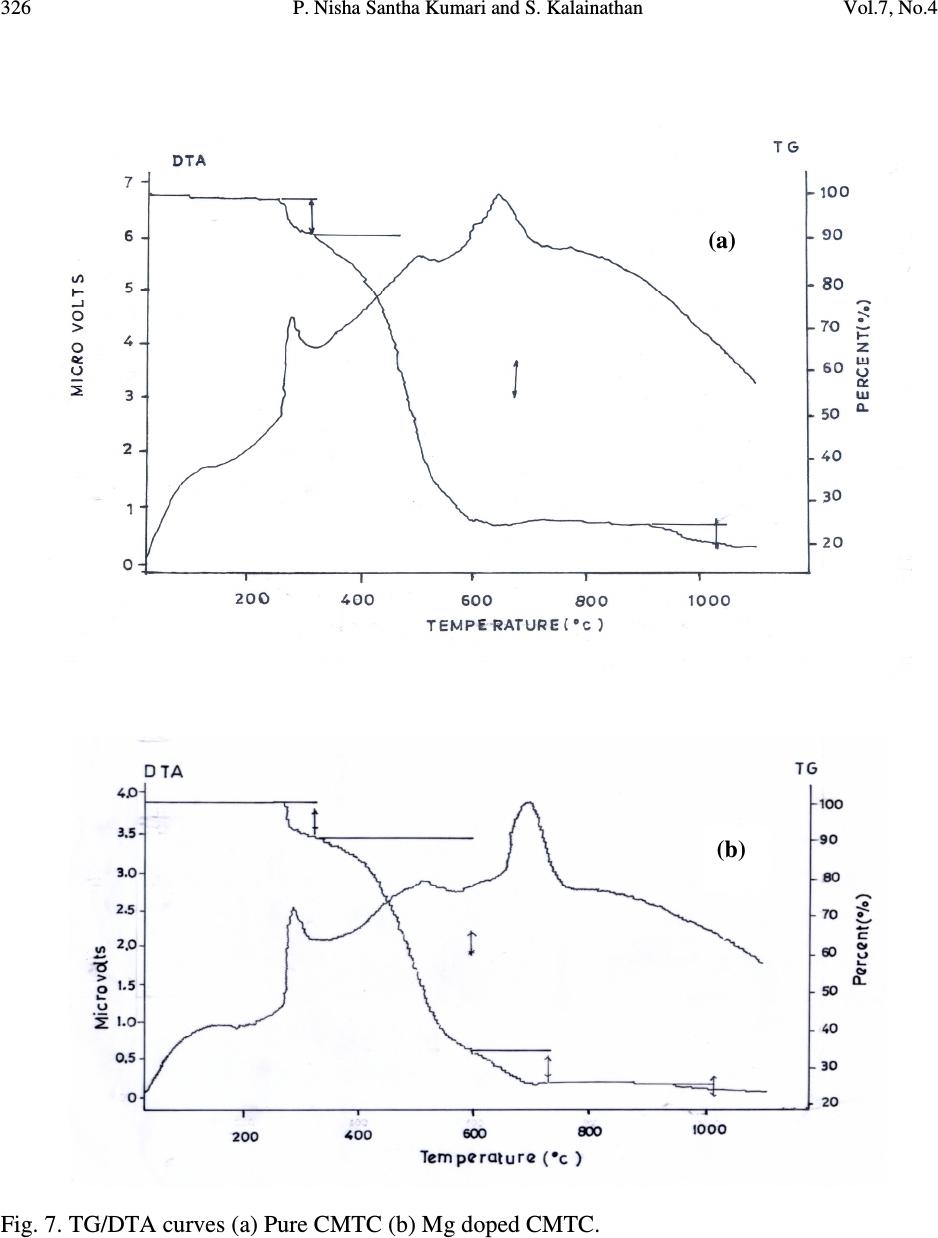 326 P. Nisha Santha Kumari and S. Kalainathan Vol.7, No.4 Fig. 7. TG/DTA curves (a) Pure CMTC (b) Mg doped CMTC. (a) (b)  Vol.7, No.4 Comparative Study of Pure and Magnesium Doped Cadmium Mercury 327 The observed mass loss (2.1 % for pure and 1.46 % for Mg doped) below the decomposition point is due to dehydration. CMTC crystals are thermally stable up to 272°C and decomposition starts only at 272°C. The TG curve of pure CMTC shows three steps. At 272°C, breakdown of the three-dimensional steric structure takes place with the evaluation of 7/8 (CN) 2 (cyanogen) corresponding to the mass loss in the first step. The major mass loss in the second step corresponds to the evaluation of 1/8 (CN) 2, 1/4 N 2 (nitrogen) gas, 2 CS 2 (carbon disulphide) and sublimation of Hg. In the third step, the temperature being greater than 767°C (the boiling point of cadmium) sublimation of cadmium initiates and at 1099°C, 93.24% of cadmium remains as residue. The DTA curve shows two significant exothermic peaks at 280°C and 646°C corresponding to the evaluation of volatile gases corresponding to steps one and two respectively in the TG curve The thermogram shows that Mg doped CMTC crystals are thermally stable up to 274°C and decomposition starts only at 274°C. The TG curve shows four steps. In the first step, breakdown of three-dimensional steric structure occurs with the evaluation of volatile gases. The major mass loss (56.87%) in the second step corresponds to the sublimation of Hg. In the third step along with the evaluation of volatile gases sublimation of cadmium initiates which continues in the fourth step. At 1099°C cadmium metal along with magnesium remains as residue (23.96 %). This is confirmed by an increase in the residue percentage. The observed high decomposition temperature (274°C) shows the greater thermal stability of the Mg doped CMTC crystals. The DTA curve shows two significant exothermic peaks at 284°C and 690°C corresponding to steps one and three of the TG curve. 4.6. Hardness Test Vickers hardness indentations were made on the flat polished face of the crystals at room temperature for loads 10, 25 and 50 g using Vickers hardness tester fitted with Vickers diamond indenter and attached to an incident light microscope. Since crack initiation and material chipping became significant beyond 50g of the applied load, hardness test could not be carried out above this load. The lengths of the two diagonals of the indentations were measured and the Vickers hardness number was computed using the formula H V = 1.8544 P / d 2 Where H V is the Vickers hardness number in kg/mm 2 , P is the indenter load in kg and d is the diagonal length of the impression in mm. The variation of H V with load and Plot of log P vs. log d for pure and Mg doped CMTC are shown in Fig. 8. In the case of pure CMTC H V increases with increase in P and Meyer’s index number ‘n’ is estimated as 2.89 [12]. The Vickers  328 P. Nisha Santha Kumari and S. Kalainathan Vol.7, No.4 hardness number of Mg doped CMTC crystal decreases with increase of load and the Meyer’s index number ‘n’ is estimated from the slope as 1.52. Hence we can say that Pure CMTC belongs to soft material category and Mg doped CMTC belongs to the hard material category [13, 14]. Fig. 8 (a). Plot of H V vs. P for pure CMTC. (b). Plot of H V vs. P for Mg doped CMTC. (c). Plot of log P vs. log d for pure CMTC. (d). Plot of log P vs. log d for Mg doped CMTC. 4.7. Powder Kurtz Method A preliminary study on the second harmonic generation efficiency of the crystal with reference to urea was carried out by powder technique developed by Kurtz and Perry [15]. In this experiment Q-switched Nd-YAG laser with the first harmonic output of 1064 nm was used. The 1 02 0304 05 0 9 0 1 0 0 1 1 0 1 2 0 1 3 0 1 4 0 1 5 0 1 6 0 Hv in kg/mm 2 P in g (a) 10 20 30 40 50 70 80 90 100 110 120 130 140 Hv in kg/mm 2 P in g (b) 1 .1 01 .1 51.2 01.2 51 .3 01.3 51.40 0 .8 0 .9 1 .0 1 .1 1 .2 1 .3 1 .4 1 .5 1 .6 1 .7 1 .8 log P (Pin g) log d (d in µ m) (c) 1.01.1 1.2 1.3 1.4 1.5 1.6 0. 9 1. 0 1. 1 1. 2 1. 3 1. 4 1. 5 1. 6 1. 7 1. 8 log P (Pin g) log d (d in µ m) (d)  Vol.7, No.4 Comparative Study of Pure and Magnesium Doped Cadmium Mercury 329 crystal was ground to homogeneous powder and tightly packed in a micro capillary tube and mounted in the path of the laser beam of pulse energy 5 mJ. The SHG was confirmed by the emission of green light ( λ = 532 nm) collected by photomultiplier tube and displayed on the oscilloscope. SHG signals of intensity 930 mV and 864 mV were recorded for pure and Mg doped CMTC while that for urea was 150 mV. The second harmonic generation efficiencies of pure and Mg doped CMTC are respectively found to be 6.2 and 5.8 times greater than that of urea. 5. CONCLUSION Mg doped CMTC single crystals of good optical quality have been obtained from silica gel in an acidic medium with gel technique by the process of diffusion. The reagents required in this case are magnesium chloride, cadmium chloride, mercury(II) chloride and ammonium thiocyanate. The X-ray diffraction study reveals that Mg doped CMTC single crystals formed in silica gel are very much crystalline in nature having tetragonal structure. HRXRD studies reveal that the crystalline perfection of the doped crystal is extremely good. High thermal stability of the crystal is confirmed by TG/DTA analysis and Vickers microhardness studies show that the mechanical property of the crystal is good. In comparison with urea its second harmonic generation efficiency is greater thus making it an excellent candidate for nonlinear applications. ACKNOWLEDGEMENT The authors thank the Management of VIT University, Vellore for their constant encouragement and support. The authors are grateful to Dr.G.Bhagavannarayana, Materials Characterization Division, National Physical Laboratory, The Head, Materials Characterization Division, NPL and The Director, NPL for the support to carry out the HRXRD studies. REFERENCES [ 1 ] X.Q.Wang et al. Mater.Res.Bull. 37, P1859-1871 (2002). [ 2 ] J.G.Bergman, J.J.Mcfee, G.R.Crane, Mater. Res. Bull. 5, P913 (1970). [ 3 ] W.Sturmer, U.Deserno, Phys.Lett. A 32, P539 (1970). [4] Changqiang Q. Wang et al. Optics &Laser Technol. 30, P291-293 (1998). [5] D.R.Yuan et al. Appl. Phys. Lett. 70, P544 (1997). [6] G.P.Joseph et al. Cryst.Res.Technol. 42, P295-299 (2007). [ 7 ] Heinz K.Henisch, Crystals in Gels and Liesegang Rings, Cambridge University press, Cambridge, 1988. [8] Krishan Lal and G. Bhagavannarayana, J. Appl. Cryst. 22, P209-215 (1989). [9]G. Bhagavannarayana et al. Appl. Cryst. 38, P768-771 (2005). [10]K.Nakamoto, Infrared and Raman spectra of Inorganic and co-ordination compounds, Third  330 P. Nisha Santha Kumari and S. Kalainathan Vol.7, No.4 edition, Wiley, New York, 1978. [11]R.M.Silverstein and F.X.Webster, Spectroscopic identification of organic compounds, sixth edition, Wiley, New York, 1998. [12] P.Nisha Santha Kumari, S.Kalainthan, N.Arunai Nambi Raj, Materials Letters, 62, P305- 308 (2008). [13]E.M.Onitsch, Mikroscopia, 2, P131 (1947). [14]M.Hanneman, Metall. Manchu. 23, P135 (1941). [15]S.K.Kurtz and T.T.Perry, J. Appl. Phys. 39, P3798 (1968). |