Paper Menu >>
Journal Menu >>
 Journal of Minerals & Materials Characterization & Engineering, Vol. 7, No.1, pp 71-82, 2007 jmmce.org Printed in the USA. All rights reserved 71 Development of Mathematical Equation for Fraction of Solid in AlSi7Mg Alloy Solidification Simulation O.O. Oluwole*, G.O. Oluwadare , A.A. Afonja Materials Science and Engineering Department, Obafemi Awolowo University, Ife, Nigeria. * Correspondence author: e-mail leke_oluwole@yahoo.co.uk, Phone:+2348033899701 ABSTRACT Thermodynamic data is made use of in calculating fraction of metal solidified in solidifcation simulation. However, thermodynamic data for many industrial alloys in their solidification ranges are not available for most practicing engineers. It is thus desirable to develop reliable equations that can be used in calculating fraction of metal solidified for solidification simulation. This work has developed an equation to calculate fraction of metal solidified for AlSi7Mg alloy solidifying under fast cooling conditions using generated values from thermodynamic data. Keywords: Solidification simulation, mathematical equation, fraction of solid, AlSi7Mg 1. INTRODUCTION Numerical simulation is a very useful tool in predicting the final state of cast parts. The purpose of simulating solidification in castings is to identify designs that are likely to cause defects due to the temperature variations in the solidifying metal. Also microstructure simulation is being done to ascertain the microstructures formation before casting. If successive time- solidification temperatures profiles show hotspots which will induce solidification defects such as shrinkage porosities, pipe and hot tears, the design variables could be modified or the decisions to use solidification aids such as chills and paddings could be made [1]. Thus, the ability to model a variety of casting variables before any tooling is built becomes desirable. Today, numerical investigations of casting processes can be performed on both the macroscopic and microscopic levels [2,3]. While macro-simulations allow the global prediction of mold filling, solidification and stress formation, micro simulation seeks to predict micro structural formation [4,5]. Heat conduction models are used in solidification simulation. The heat source in the solidifying liquid is the latent heat of fusion released gradually as the solidification proceeds. 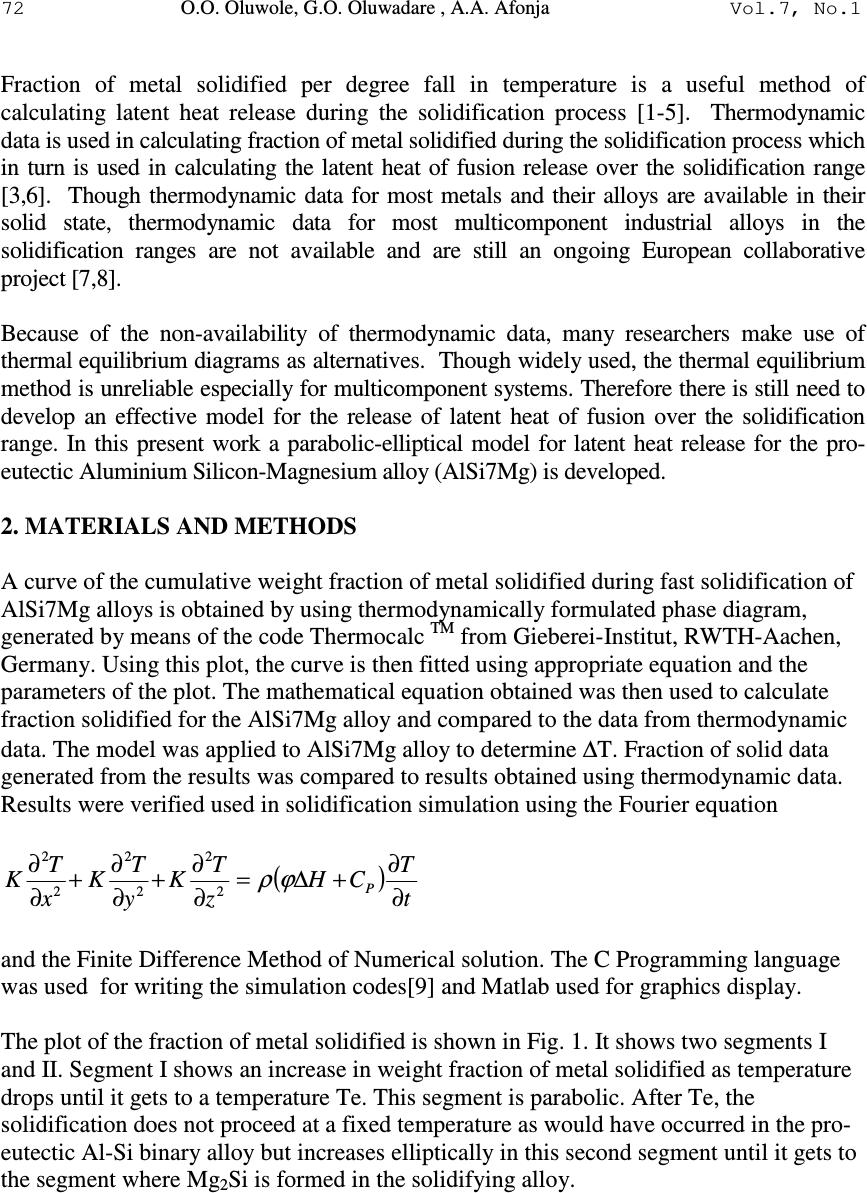 72 O.O. Oluwole, G.O. Oluwadare , A.A. Afonja Vol.7, No.1 Fraction of metal solidified per degree fall in temperature is a useful method of calculating latent heat release during the solidification process [1-5]. Thermodynamic data is used in calculating fraction of metal solidified during the solidification process which in turn is used in calculating the latent heat of fusion release over the solidification range [3,6]. Though thermodynamic data for most metals and their alloys are available in their solid state, thermodynamic data for most multicomponent industrial alloys in the solidification ranges are not available and are still an ongoing European collaborative project [7,8]. Because of the non-availability of thermodynamic data, many researchers make use of thermal equilibrium diagrams as alternatives. Though widely used, the thermal equilibrium method is unreliable especially for multicomponent systems. Therefore there is still need to develop an effective model for the release of latent heat of fusion over the solidification range. In this present work a parabolic-elliptical model for latent heat release for the pro- eutectic Aluminium Silicon-Magnesium alloy (AlSi7Mg) is developed. 2. MATERIALS AND METHODS A curve of the cumulative weight fraction of metal solidified during fast solidification of AlSi7Mg alloys is obtained by using thermodynamically formulated phase diagram, generated by means of the code Thermocalc TM from Gieberei-Institut, RWTH-Aachen, Germany. Using this plot, the curve is then fitted using appropriate equation and the parameters of the plot. The mathematical equation obtained was then used to calculate fraction solidified for the AlSi7Mg alloy and compared to the data from thermodynamic data. The model was applied to AlSi7Mg alloy to determine ∆T. Fraction of solid data generated from the results was compared to results obtained using thermodynamic data. Results were verified used in solidification simulation using the Fourier equation ( ) t T CH z T K y T K x T K P ∂ ∂ +∆= ∂ ∂ + ∂ ∂ + ∂ ∂ ϕρ 2 2 2 2 2 2 and the Finite Difference Method of Numerical solution. The C Programming language was used for writing the simulation codes[9] and Matlab used for graphics display. The plot of the fraction of metal solidified is shown in Fig. 1. It shows two segments I and II. Segment I shows an increase in weight fraction of metal solidified as temperature drops until it gets to a temperature Te. This segment is parabolic. After Te, the solidification does not proceed at a fixed temperature as would have occurred in the pro- eutectic Al-Si binary alloy but increases elliptically in this second segment until it gets to the segment where Mg 2 Si is formed in the solidifying alloy. 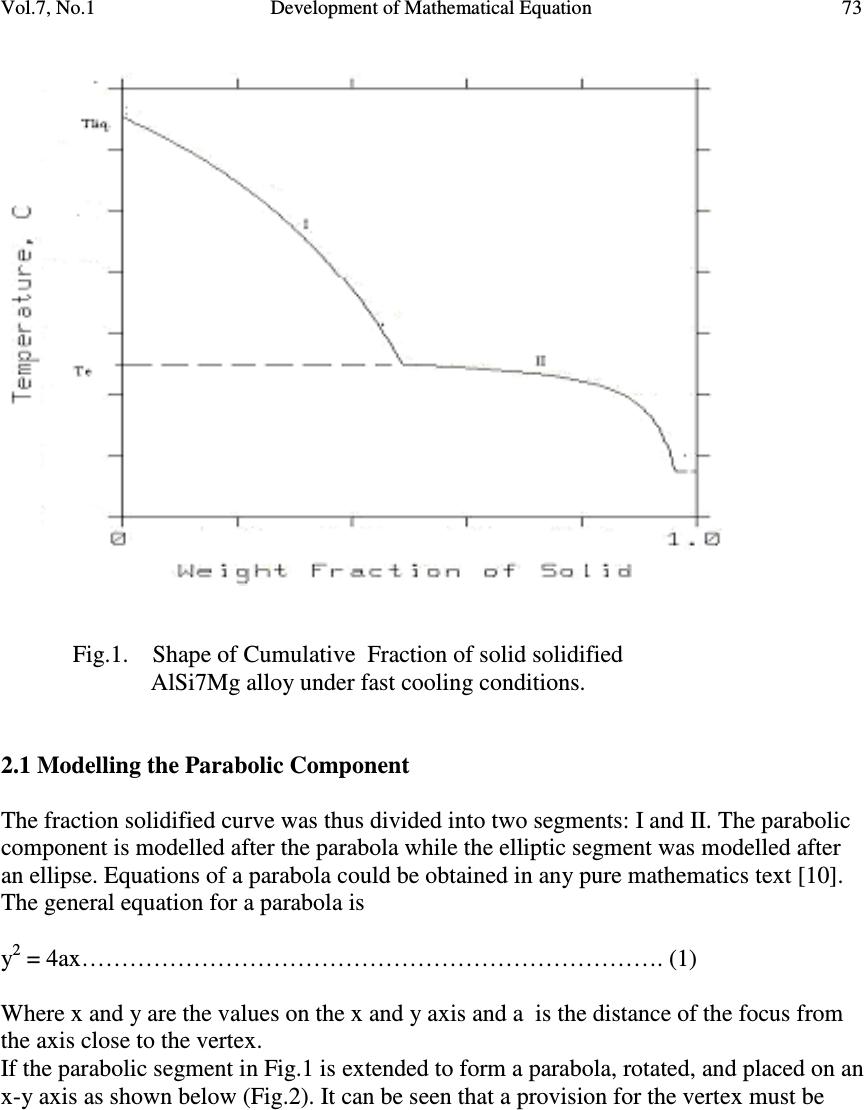 Vol.7, No.1 Development of Mathematical Equation 73 Fig.1. Shape of Cumulative Fraction of solid solidified AlSi7Mg alloy under fast cooling conditions. 2.1 Modelling the Parabolic Component The fraction solidified curve was thus divided into two segments: I and II. The parabolic component is modelled after the parabola while the elliptic segment was modelled after an ellipse. Equations of a parabola could be obtained in any pure mathematics text [10]. The general equation for a parabola is y 2 = 4ax………………………………………………………………. (1) Where x and y are the values on the x and y axis and a is the distance of the focus from the axis close to the vertex. If the parabolic segment in Fig.1 is extended to form a parabola, rotated, and placed on an x-y axis as shown below (Fig.2). It can be seen that a provision for the vertex must be 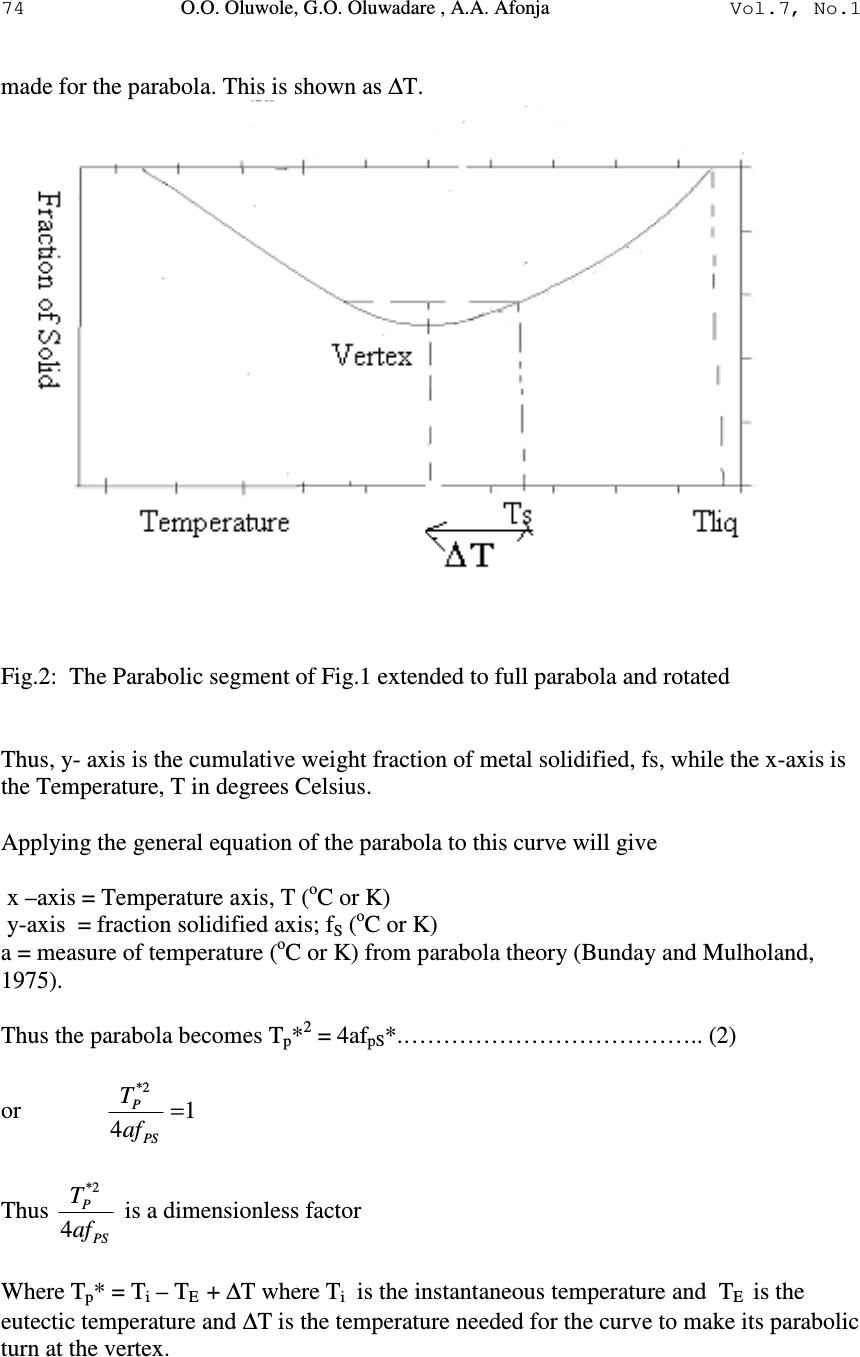 74 O.O. Oluwole, G.O. Oluwadare , A.A. Afonja Vol.7, No.1 made for the parabola. This is shown as ∆T. Fig.2: The Parabolic segment of Fig.1 extended to full parabola and rotated Thus, y- axis is the cumulative weight fraction of metal solidified, fs, while the x-axis is the Temperature, T in degrees Celsius. Applying the general equation of the parabola to this curve will give x –axis = Temperature axis, T ( o C or K) y-axis = fraction solidified axis; f S ( o C or K) a = measure of temperature ( o C or K) from parabola theory (Bunday and Mulholand, 1975). Thus the parabola becomes T p * 2 = 4af pS *.……………………………….. (2) or 1 4 2* = PS P af T Thus PS P af T 4 2* is a dimensionless factor Where T p * = T i – T E + ∆T where T i is the instantaneous temperature and T E is the eutectic temperature and ∆T is the temperature needed for the curve to make its parabolic turn at the vertex.  Vol.7, No.1 Development of Mathematical Equation 75 f pS * = f Se - f Si where f Se is the fraction solidified at the eutectic temperature and f Si is the fraction solidified at Temperature T i . a is the focus of the parabola which can be obtained at maximum T* and maximum f*. Maximum T P * = T L + ∆T - T e Maximum f P * = f Se ∆T = temperature needed for the curve to make its parabolic turn at the vertex. 2.2 Modelling the Elliptic Component The elliptic component of Fig. 1 can be modelled after a quadrant of an ellipse as shown in Fig. 3 below. Fig. 3 Elliptic component of Fig. 1 shown as a quadrant of an ellipse with major and minor axis a and b respectively. The general equation for an ellipse is 1 2 2 2 2 =+ b y a x……………………….(3) Applying this to the quadrant gives 1 )()1( 2 2* 22 2* = − + − es se TT T f f………………………………………………….(4) where f se = cumulative fraction solidified at Te f* = f S - f se T* = T – Ts where Ts is the solidus temperature  76 O.O. Oluwole, G.O. Oluwadare , A.A. Afonja Vol.7, No.1 The Model The Parabo-elliptic model can be stated as At T > Te; i.e. Te < T< T L T p * 2 = 4a f pS * ……………………………………………………………….(5) Where T p * = T i – T e +∆T where T i is the instantaneous temperature and T e is the eutectic temperature. f pS * = f Se - f Si where f Se is the fraction solidified at the eutectic temperature and f Si is the fraction solidified at Temperature T i . a is the focus of the parabola which can be obtained at maximum T* and maximum f*. Maximum T P * = T L + ∆T - T e Maximum f P * = f Se At TeT ≤ ; i.e TeTTs ≤ ≤ 1 )()1( 2 2* 22 2* = − + − es se TT T f f ……………………………………………….(6) where f se = cumulative fraction solidified at Te f* = f S - f se T* = T – Ts where Ts is the solidus temperature 2.3 Applying The Model The model was applied to AlSi7Mg alloy solidifying in chilled mould. Fraction of solid data generated from the results were used in numerical simulation of solidification behaviour for un-risered casting. Riser size selected from the simulation was input back into the program incorporating effect of riser. 3. RESULTS 3.1 Comparison of Model Results and Fraction of Solid From Thermodynamic Data The parabo-elliptic model was used in calculating cumulative fraction of metal solidified for AlSi7Mg alloy and compared to values obtained using thermodynamic data. These are presented in Figs. 4 and 5. Regression analysis show no significant difference in the results. The parabo-elliptic model equations applicable to AlSi7Mg are: The Parabolic segment of the AlSi7Mg alloy  Vol.7, No.1 Development of Mathematical Equation 77 ∆ T = 10; a = 1299.38; Equation of Parabola; T* 2 = 5197.5f* f = 0.481 – f*; T = T*+ 565; Calculations were made at T* = 0,15,25,35,45,50 The elliptic segment a = 15 ; b = 0.466; Equation of ellipse: 1 )469(.)18( 2 2 2 2 =+ yx T = T* + 565; f = f* + 0.481; Fig. 4: Cumulative Fraction of Metal solidified per deg. Celsius fall in temperature for AlSi7Mg alloy . Fig. 5: Fraction of metal solidified per deg. Celsius fall in temperature for AlSi7Mg alloy  78 O.O. Oluwole, G.O. Oluwadare , A.A. Afonja Vol.7, No.1 3.2 Simulation of Chilled Casting with and without Riser Simulation of 10 cm by 7cm by 5 cm AlSi7Mg alloy block solidifying in chilled steel mould was simulated and from the area of an all mushy zone at time= 1.32 seconds (Fig. 6a and b), a riser size was selected to feed that mushy zone when there is no more hot liquid to feed the zone of dendrite formation. The riser size selected from the simulation of the riserless casting was seen to be in agreement with riser size calculated from riser size diagrams [11]. It was seen to effectively feed the mushy zone shifting the heat center into the riser as time progressed (Figs. 7-9). Figs. (10 and 11) showed ineffective risering from bad riser size selection. Table 1: Regression of AlSi7Mg: Scheil Vs Model (fraction of solid) Multiple R 0.996 R Square 0.991 Adjusted R 0.990 Standard Error 0.00232 Significant level 0.000 Fig. 6a: All Mushy zone layer at τ = 1.32 sec spreading from y=4 to y=6 X=3 to x=7 and z=3 to z=7 Fig. 6b: Mushy zone layer at τ = 1.32 sec spreading from y=4 to y=6 x=3 to x=7 and z=3 to z=7 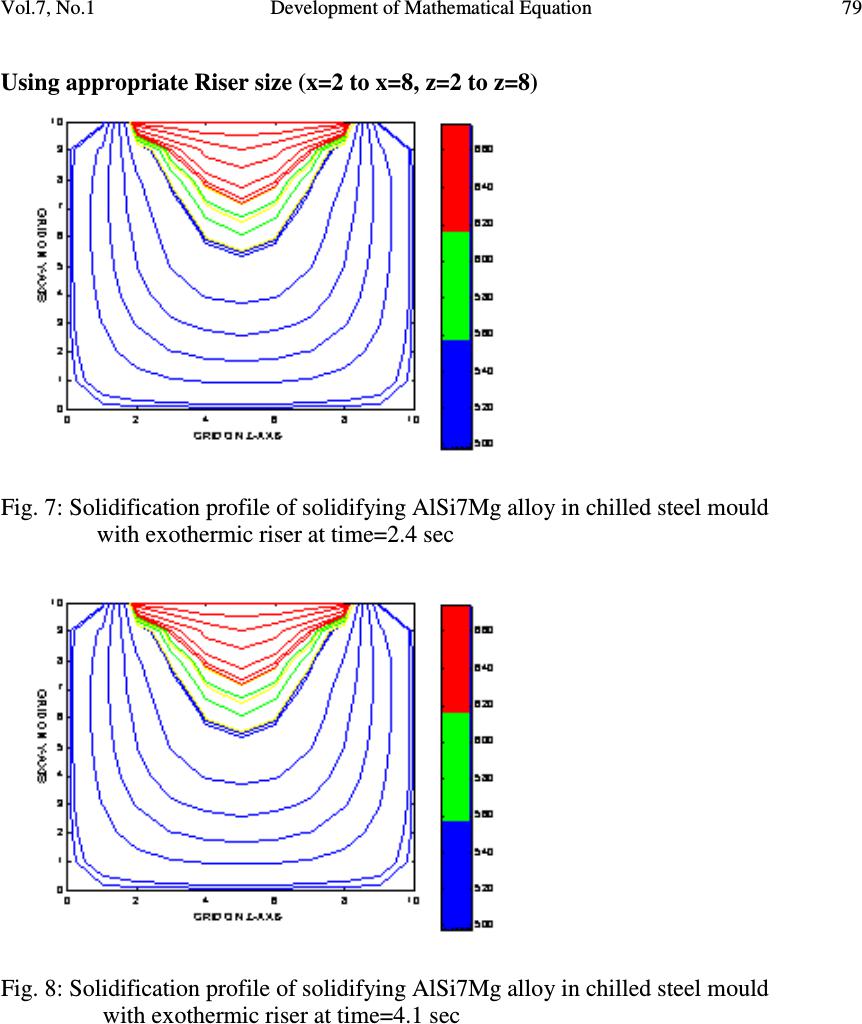 Vol.7, No.1 Development of Mathematical Equation 79 Using appropriate Riser size (x=2 to x=8, z=2 to z=8) Fig. 7: Solidification profile of solidifying AlSi7Mg alloy in chilled steel mould with exothermic riser at time=2.4 sec Fig. 8: Solidification profile of solidifying AlSi7Mg alloy in chilled steel mould with exothermic riser at time=4.1 sec 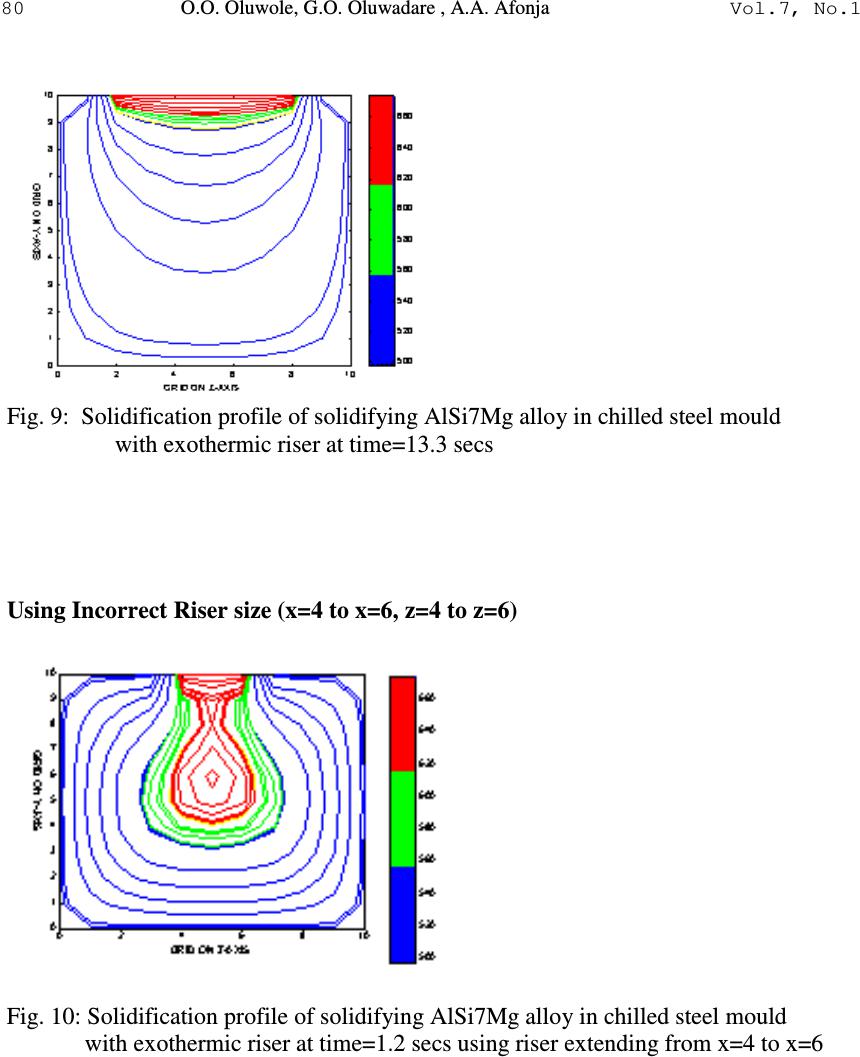 80 O.O. Oluwole, G.O. Oluwadare , A.A. Afonja Vol.7, No.1 Fig. 9: Solidification profile of solidifying AlSi7Mg alloy in chilled steel mould with exothermic riser at time=13.3 secs Using Incorrect Riser size (x=4 to x=6, z=4 to z=6) Fig. 10: Solidification profile of solidifying AlSi7Mg alloy in chilled steel mould with exothermic riser at time=1.2 secs using riser extending from x=4 to x=6 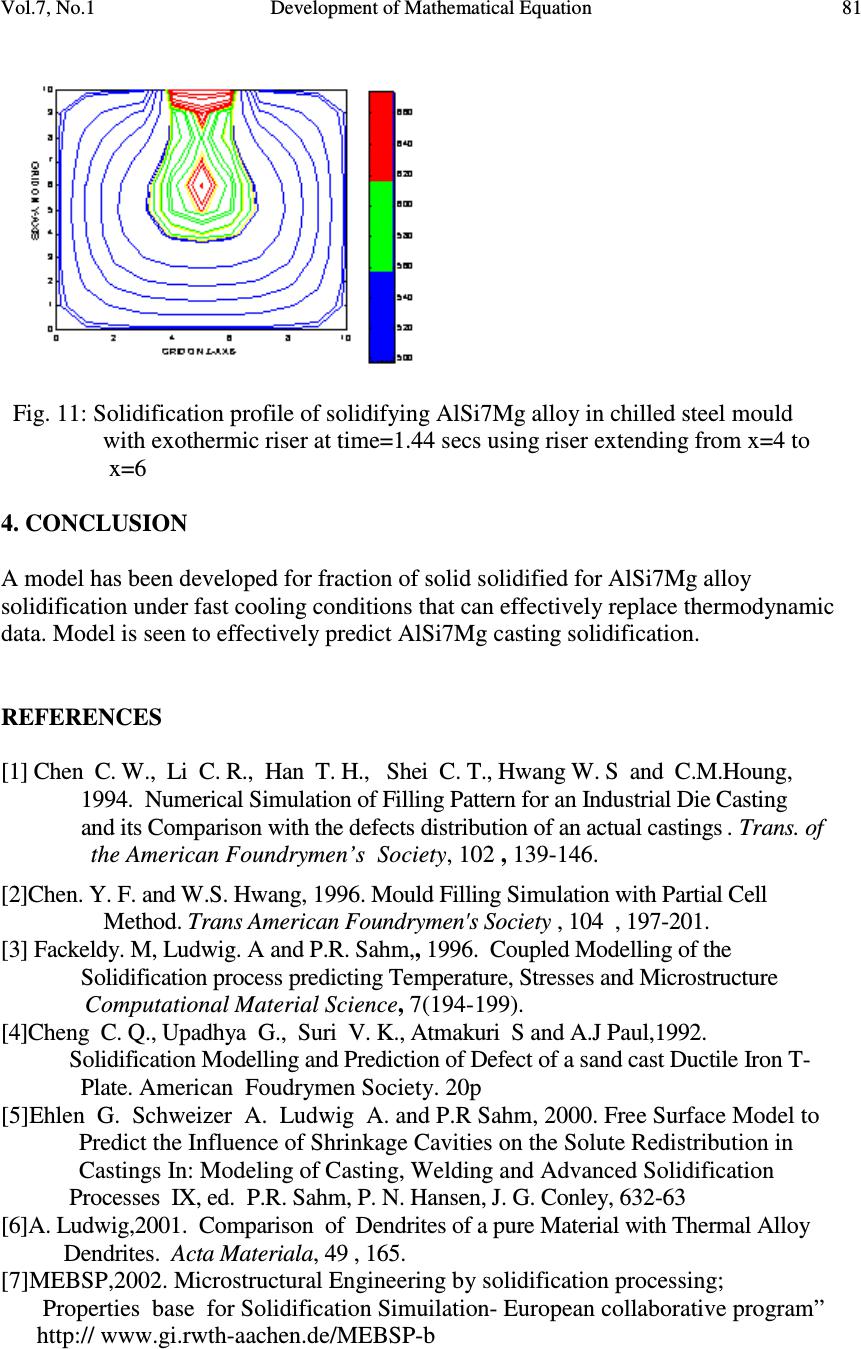 Vol.7, No.1 Development of Mathematical Equation 81 Fig. 11: Solidification profile of solidifying AlSi7Mg alloy in chilled steel mould with exothermic riser at time=1.44 secs using riser extending from x=4 to x=6 4. CONCLUSION A model has been developed for fraction of solid solidified for AlSi7Mg alloy solidification under fast cooling conditions that can effectively replace thermodynamic data. Model is seen to effectively predict AlSi7Mg casting solidification. REFERENCES [1] Chen C. W., Li C. R., Han T. H., Shei C. T., Hwang W. S and C.M.Houng, 1994. Numerical Simulation of Filling Pattern for an Industrial Die Casting and its Comparison with the defects distribution of an actual castings . Trans. of the American Foundrymen’s Society , 102 , 139-146. [2]Chen. Y. F. and W.S. Hwang, 1996. Mould Filling Simulation with Partial Cell Method. Trans American Foundrymen's Society , 104 , 197-201. [3] Fackeldy. M, Ludwig. A and P.R. Sahm,, 1996. Coupled Modelling of the Solidification process predicting Temperature, Stresses and Microstructure Computational Material Science , 7(194-199). [4]Cheng C. Q., Upadhya G., Suri V. K., Atmakuri S and A.J Paul,1992. Solidification Modelling and Prediction of Defect of a sand cast Ductile Iron T- Plate. American Foudrymen Society. 20p [5]Ehlen G. Schweizer A. Ludwig A. and P.R Sahm, 2000. Free Surface Model to Predict the Influence of Shrinkage Cavities on the Solute Redistribution in Castings In: Modeling of Casting, Welding and Advanced Solidification Processes IX, ed. P.R. Sahm, P. N. Hansen, J. G. Conley, 632-63 [6]A. Ludwig,2001. Comparison of Dendrites of a pure Material with Thermal Alloy Dendrites. Acta Materiala , 49 , 165. [7]MEBSP,2002. Microstructural Engineering by solidification processing; Properties base for Solidification Simuilation- European collaborative program” http:// www.gi.rwth-aachen.de/MEBSP-b  82 O.O. Oluwole, G.O. Oluwadare , A.A. Afonja Vol.7, No.1 [8] Ludwig. A , Quested. B . and G.Neuer,2001. How to find Thermophysical Material Property data for casting Simulations. Advanced. Engineering Materials, 3, 11 [9] Oluwole.O Ph.D Thesis, Obafemi Awolowo University, (2004) 266 pages. [10] Bunday B . D and H. Mulholand (1975). Pure Mathematics for Advanced Level Butterworths , London , 94 -129, 170 – 187. [11] E. Myskowski, H. Bishop and W. PelliniT Riser Diagrams Trans. AFS, 63 (1955) 271. |