 Journal of Financial Risk Management 2012. Vol.1, No.2, 7-14 Published Online June 2012 in SciRes (http://www.SciRP.org/journal/jfrm) http://dx.doi.org/10.4236/jfrm.2012.12002 Copyright © 2012 SciRes. 7 Structural Change Modeling of Singapore Private Housing Price in Simultaneous Equation Model Weihong Huang1, Yang Zhang2 1Division of Economics, Nanyang Technological University, Singapore City, Singapore 2Faculty of Business Administration, University of Macau, Macau, China Email: awhhuang@ntu.edu.sg, yzhang@umac.mo Received March 2nd, 2012; revised April 15th, 2012; accepted May 10th, 2012 This paper investigates the structural change behavior of Singapore’s private housing market and in par- ticular the impact of government policies on housing price determination. A structural model of price is established and the “Regressive Segmentation (RS)” method is applied to detect the changing points without prior knowledge of the structural changes. Our study shows that the changing points indicated by the RS method are consistent with the timing of the policy changes. Keywords: Private Housing Market; Structural Change; Simultaneous Equation Model Introduction Booms and slumps in housing prices have attracted the atten- tion of both the general public and academic economists ever since. From the academic point of view, the ready availability of time-series data and the important policy implications of high and volatile prices have meant that empirical modeling of housing prices has been both a fertile and a challenging area. In Singapore there are two segments in residential housing market, the private housing market and the HDB1 resale hous- ing market. The main difference between the two is that the HDB resale housing market is, to some extent, regulated and subsidized, while the private housing market receives limited government intervention although the prices in both markets are determined by the market forces. Private housing market operates in a laissez-faire economic system, where housing prices are mainly determined by a func- tion of the demand and supply in the market. (Sing, Tsai, & Chen, 2004) This segment of the market is dominated by few major private developers. A variety of housing forms, with the hierarchical structure from apartment, condominiums, terrace, semi-detached house to detached housing, is made available by private developers to meet different preference and aspiration of potential buyers. The private housing units have much higher housing prices with better designs, quality of finishes and fully- equipped recreationally facilities. Getting into the private hous- ing market is therefore viewed as the upper end of Singapore owner-occupiers’ housing career. Ownership of private residen- tial property is well regarded as a social status, and a dream of HDB dweller, and those who have not owned a house. Although being relatively small, the private housing market has a significant impact on the Singapore economy. According to the estimation given by Phang (2001), the ratio of gross housing wealth in the private housing sector to GDP is 1.48, while the same ratio in the public housing sector is 1.38. This implies that the fluctuation of private housing prices could have important implications for the national wealth holding. More- over, becoming a private home-owner has become a national phenomenon, attracting a significant proportion of public home-owners to upgrade to private housing. The public housing subsidies therefore leak out into the private housing sector through such upward mobility and its social economic impacts are significant. Although Singapore has a relatively free economy, its hous- ing market is far from being perfect. It is strongly dominated by the public sector, in the forms of both direct provision and con- trol of major housing stock, and regulating the eligibility crite- ria, housing finance, prices, rentals and transaction costs. The government’s intervention through the sale of leasehold private residential lands program and the government linked property companies also helps indirectly to cushion unnecessary price inflation. The impacts of the public housing policies on the private housing prices are profound, albeit indirect. As pointed out by Phang et al. (1995), the effect of government interven- tion on the public housing could filter into the private housing market. Changes in the supply, expected price, finance and eligibility criteria of public housing will influence the private property market significantly. These policy distortions have resulted in remarkable structural changes in the private property market over time. With the market more responsive and susceptible to external shocks, price correction should be less sticky vis-à-vis public housing market. In recent years, Singapore’s residential pro- perty market, especially the private housing market has been suffering from irregular price fluctuations. This has caused much public concern about the affordability of private housing. Thus the study of the structure of Singapore private housing market and the behavior of the market is of great importance in controlling real estate inflation. Interest in this sector also stems from the fact that it is subject to the full rigor of market forces, in sharp contrast to the established public housing market where state-administered social pricing prevails mainly through subsidies and loans to the HDB. This paper investigates structural changes in Singapore’s private housing market and in particular the impact of govern- ment policies on housing price determination. A structural 1HDB, Housing Development Board, is a statutory board of the Ministry o ational Development, considered to be the national housing agency.  W. H. HUANG, Y. ZHANG model on price is established and the “Regressive Segmenta- tion” (RS) method is applied to detect the changing points without prior knowledge of the structural breaks. The rest of the paper is arranged as follows. Literatures provides a review of literatures and Method presents the method which is able to detect, in simultaneous equations model, the changing points with no prior information on the timing of the structural changes. Empirical results are discussed in Empirical Result and Discussion and Conclusion concludes. Literatures The literature on modeling of housing prices is very exten- sive, especially in the developed housing markets in the UK and North America. Many empirical housing models have been developed based mainly on the stock-flow adjustment or the classical Hendry’s neo-classical frameworks. In Hendry’s the- ory of equilibrium demand and supply functions, the price of existing houses was derived as a function of personal dispos- able income, rental rate, interest rate, stock of mortgage, tax rate, and number of families. Dicks (1990) extended Hendry’s model for prices of new housing in the UK. Hsieh (1990) fur- ther separated housing demand into service and investment demand in a study of Taiwan’s housing market. Following the traditional two-equation stock-flow model of the residential market, the demand is typically stated as a func- tion of the real price of housing, the user cost of financing that price, the alternative cost of renting as well as demographic characteristics and real permanent income. In supply side, con- struction is always assumed to depend on housing prices, factor costs and various interest rates (Di Pasquale & Wheaton, 1994). Empirical practices show that the functional forms and lags used tend to be largely data determined (Muellbauer & Murphy, 1997). The stock-flow approach posits that the housing market will clear through prices that equate demand with the existing stock of housing. Supply is often taken to be exogenous as it is de- termined by the decisions of housing producers in prior periods. Such a specification fails to include supply-side features (Mue- llauer & Murphy, 1997) and ignores the relationship between housing stock and land market conditions (Di Pasquale & Wheaton, 1994). Taking housing stock as fixed will lead to a short run fluctuation in which price are completely demand- driven. However, as shown in many studies (Peng & Wheaton, 1994; Rosen & Smith, 1983), the effect of a demand shock on prices depends on the state of supply. This is particularly rele- vant for the Singapore market where land sales program is po- tentially useful mechanism for bringing the housing market into steady-state equilibrium (Lum, 2002). Despite the small market share of the private residential property market in Singapore, research, however has been con- centrated on this sector of the market. In the city-state of Sin- gapore, the studies focusing on modeling private residential housing market dynamics contain only limited theoretical stru- cture. Empirical analysis includes the impacts of government policies on private housing prices (Phang & Wong, 1997) and the inflation-hedging characteristics of private housing prices (Chen & Sing, 2000). Ho and Cuervo (1999) and Tu (2001) incorporated an error correction term in the cointegration models to adjust for the short-term non-stationary variations. Ho and Tay (1993) deve- loped a system of six simultaneous equations for the supply of and demand for private residential properties in Singapore in a two-stage least squares process. Other studies include Ong and Sing (2002) on price discovery between private and public housing market using a Granger causality error-correction mo- del and Sing (2001) on the dynamics of the condominium mar- ket in Singapore. The free-market operation of the private market implies that the market is more responsive and susceptible to shocks in economics. But few have been seen to study the structural change of long run behavior of private housing market in Sin- gapore, especially in structural equation model. This provides the basic rational for this empirical work. Method The basis of the method, for specialized cases, is documented by Fisher (1958) and Guthery (1974). Thorough treatment and description of the main idea in the context of simultaneous equation model seems still sparse, with recent treatment in Huang and Zhang (2004). Normally, structural change is said to be present within the range of the index i, which in time series data, corresponds to time or observation. With the index or par- titioning variable identified, the inferential problem confronting us involves three parts: 1) the specification of the number of changes in the model, l; 2) the detection of the change point {is}, or the boundaries of intervals over which each of the model pieces applies; 3) the estimation of the model parame- ters within each subdomain. If l and the {is} were specified, step 3 would simply consist of applying the classical theory, interval by interval. Summing the residual sums of squares for the various intervals yields an overall index of the quality of fit of the segmented model. With l fixed, the {is} may be estimated by minimizing this index. Further minimization of the index to estimate l will base on information criterion for model selection problems. In estimating the appropriate sample separation in simulta- neous equation system, there are two approaches to analyze the timing and form of structural changes, either to estimate equa- tion by equation individually using a limited information esti- mator, or globally consider joint estimation of the entire system. First using limited information estimation, without loss of any generality, we may consider the first equation in the system with normal assumptions applied, and write it as 1111 11 γyYX u . The reduced form corresponding to this is II YZ V , where 11 , I YyY, 12 ,Z X, 11 π, I and 11 ,VvV I. is the G matrix of non-stochastic exogenous variables in the complete system, 1 is a Gm 1 (1) matrix of reduced form coefficients, and V(Gm is a 11) matrix of reduced form disturbances whose rows are assumed to be normally and independently distributed with zero mean and covariance β . Comparing the structural and reduced forms of the model, we have where 1. Thus, one may es- timate 1 u by utilizing appropriate estimators for VI and . Then 0 1111 1 ββ I uvV V 0 1 β1, 0 1 β V ˆˆ may be estimated by applying OLS to yield II VYZ , since V u is reduced form coefficient and OLS will give consistent estimation. Meanwhile, can be esti- mated from structural form equation using 2SLS. Thus, the appropriate estimator of 1 would then be . Since we know that 0 1 β 0 ˆ β 1 ˆI uV 1 ˆ ZI VM , where Z Y1 () IZZZ Z , it follows that 1 u may be obtained directly as the residual vector of the unrestricted OLS regress of on 1 111 ˆ βyY , that is, Copyright © 2012 SciRes. 8  W. H. HUANG, Y. ZHANG regressing 0 1 ˆ I yY on . Denoting the coefficient vector of said regression by and would be expressed alternatively as . 1G tt yZ 2 ,1 t δ 1 2 l t 1 u 2 ii t di 1 Applying recursive segmentation method, we define target function, e, as the statistics that describe the overall goodness- of-fit of the model using certain estimation criteria. The value of the target function within a segment is called the diameter, denoted as d. Obviously, e is a function of d. The use of ordi- nary least square (OLS) gives specific form to the target func- tion and diameters and simplifies the discussion. We therefore have ˆ δ Z ti () min ˆ δ s tt yZ uy 1 ,1 2, , ss i sl 11 (, 1, 2, s s i st i epNl min ) ,sl 11 11 2 ˆ δδ 1, ss ss tt t ti di yZ where is the tth element of matrix. And e is defined as: t yy 11 1 11 δ s s i tt sti ll ss s yZ i As shown above, target function (, el)pN can be decom- posed into the sum of individual diameters. Therefore the ulti- mate goal is to obtain the optimal segmentation: 12 ,, , l ii i (,)pNl , which minimizes the target function, i.e., (,) min ppNl p (, ) e pNl (N,) e l. let denote the resulting esti- ˆ δ mates based on the given l partition 12 l. Substituting these estimates in the objective function and denoting the re- sulting sum of squared residuals as 12 l, the esti- mated break points ,, i i ,i ,, ,i ii SSE 12 ,,ii ,l i can be alternatively denoted as 12 ,,..., arg m , lii i 12 ,i 12 , ,,ii in l i,l iSSE i. As an additive function of diameters, the target function (,) epNl satisfies the separability condition in a multi-stage decision-making problem in dynamic programming. Thus, by using the technique of backward recursive optimization, 12 , or the optimal changing points can be identified recursively without an exhaustive grid search. Details of this algorithm are shown in Huang and Zhang (2004). ,, , l ii i If full information, or systems methods of estimation is used, we may formulate the full system as YZ U , where and() 0EU E δ I UU 3SLS . In line with the principle of system methods, the technique of three-stage least square is used for joint estimation of the entire system of equations. Thus the 3SLS estimator is ˆ 1 ˆˆ 1ˆ 1 Y ZZ I I where ˆ is the IV estimator for 2SLS. Again, the model is assumed to have structural changes in the whole sample period, i.e., subsamples. Following the definition of diame- ter and target function stated previously and after a choice of a 1 l l normalization rule, we have , ,1 ,1 ss di ii 11 1 M h h d ss i where 1 ,1 hss dii is the diameter of the hth equation, for the individual segment staring from i to . 1ss is the summation of all the diameters throughout the system. Given the structural changes in the form of 11 s i (,dii1) 12 ,,, l ii i(,PN )l, we have 1 111 ,1 , (,) llM sshss ssh ediidii pNl 1 1 . Those corre- sponding diameters can be calculated from 3SLS estimators. Similarly, we have the optimum of target function as (,) min (,) (,) ppNl ee pNl pNl . Again, the estimated break points will be 12 12 12 , ,..., ,, ,argmin,, , l ll iii ii iSSEiii. It is ap- parent that the technique of backward recursive optimization and dynamic programming procedure are applicable and again RS procedure can be implemented to detect the structural changes without grid search calculation. By using recursive classification, we can obtain different re- cursive segmentations simultaneously, given exact number of segments l, on which in practice we may not have such infor- mation. Another standard problem is that improvement in the objective function is always possible by allowing more breaks. That is to say, in determining optimal l0, it is expected intui- tively that a more complicated model will provide a better ap- proximation to reality. But, on the contrary, in most practical situations a less complicated model is likely to be preferred if we wish to pursue the accuracy of estimation. Information cri- terion which derives from maximizing the posterior likelihood in a model selection paradigm and enjoys widespread use in model identification provides a natural baseline. Akaike (1973) found a simple relationship between expected Kullback-Leibler information and Fisher’s maximized log-likelihood function. This relationship leads to a simple, effective, and very general methodology for selecting a parsimonious model for the analy- sis of empirical data. The general form of Information Criterion (IC) is: 2ln () s ICL MPm s , where M is the value of the maximum likelihood function of the model, while Pm is the penalty function. Thus, the RS method should choose be the model with smallest IC value. By using computer simula- tion, the investigation of the penalty function with different va- lues of observations, variables and variance suggests that the AIC function by Akaike, BIC of Schwarz and CAI of Sugiura are all appropriate. Based on the results obtained in previous section, for given number of l, we have found the optimal seg- mentations and the corresponding estimation of the whole sam- ple. Now the determination of l0 will be obtained according to the IC criteria, i.e., the one which allows the greatest reduction in the IC value: 0arg min 12 ,,,..., l i i s. s li lIC Empirical Result and Discussion Model Specification As indicated in Ho and Cuervo (1999), “structural demand and supply” model would have been more appropriate com- pared with the VECM (Vector Error Correction Model) if the objective of the study were to establish causal relationships for structural analysis; to determine elasticities and multipliers for policy analysis; and to make forecasts for planning purposes. Because of these merits of system analysis, we will in this stu- dy look at the demand and supply of private housing market using simultaneous equation model. Our model extends the analysis in previous literature by proposing a new approach to structural modeling of the time series path of private housing market. This allows us to disentangle supply-side factors from demand-side influence, and in particular, the structural breaks Copyright © 2012 SciRes. 9  W. H. HUANG, Y. ZHANG in housing market behaviors over time. Several important macro-economic determinants of private housing prices are identified and tabulated in Table 1. The Demand Model Private housing prices (RPPI) In order to obtain an aggregate measurement of price level in the private residential property market, the private Residential Property Price Index (RPPI1) is used. The RPPI data from first quarter of 1990 to the first quarter of 2004 is collected from REALIS2—Real Estate Information System. Public Housing Prices (HDB) Prices of public housing units sever as the benchmark of the price of private housing market. The Resale Price Index of HDB Flat3 was used as a proxy4. This HDB variable is sup- posed to capture the price level of public housing. This data is obtained from the website of Housing Development Board, where 1998Q4 is adopted as the base period with index at 100. The pricing of HDB flats is largely determined by the statutory board and is considered a policy decision, bearing in mind that affordability is the main thrust of public housing here, although it does take into account prevailing property market conditions. The intermarket mobility between public and private market occurs as the income of the population increases and prefer- ences change. Appreciation in the values of public flats en- hances the affordability of flat-owners to upgrade. Upgraders, defined as those who upgrade from public to private housing, typically reply on the capital appreciation of their flats to enable them to purchase private properties (Ong, 1999). On this account, the rising public resale price directly in- creased the accessibility of public home-owners to upgrade to private housing, which will transfer the public housing subsi- dies to private housing. So public housing price is an important determinant in demand for private housing. This upgrading effect exceeds the effect of being substitute for private housing. Therefore the HDB resale price is expected to be positively related to the demand for private housing. National income (GDP5) An earlier Ministry of Trade and Industry’s article (2001) has Table 1. Private housing market determinants. Demand Side Factors Supply Side Factors Private housing prices Private housing stock National income Private housing price Mortgage rate Basic materials costs Public housing prices Labor costs Consumer price index Mortgage rate shown that private residential property prices in Singapore are fundamentally driven by economic growth, which captures both the improvement in household purchasing power as well as population growth. Phang et al. (1995) also suggests that the fundamental of the private property market is determined by factors of the macro-economic environment. Singapore’s housing finance system allows the would-be private home buyers to use their monthly Central Provident Fund6 (CPF) contribution to pay off their mortgage debts. The contribution rates are adjustable and are positively related to medium to long term economic performance. This positive re- lationship implies that macroeconomic performance may di- rectly affect the would-be home-buyers’s housing affordability. Ong and Sing (2002) provides evidence that real GDP is a significant variable reflecting the impact of long-run economic performance on the housing market. From the third quarter of 1986 until end of 1996, the growth of Singapore economy has been strong. The growth in household income and their CPF boosted the private housing market. Conversely, the poor eco- nomic performance in 1996 and 1997 has resulted in a dramatic fall in the prices of private properties. Therefore, GDP value is chosen as one of the potential key factors determining private housing prices, with a positive relationship expected. Mortgage rate (PLR) It has been suggested by economic theory that interest rates and house prices be inversely related. Generally, lower interest rates tend to increase housing demand, and therefore pushing up housing prices. However, this effect is softened by a similar increase in the supply of housing in response to higher house prices and lower construction financing costs result from re- duced interest rates. Thus, interest rates influence house prices through the demand for, and supply of private housing. We use PLR (Prime Lending Rate)7 in our model, which is the average of nominal bank lending rate, serves as the measure of the cost of housing finance or the cost of borrowing. 1The Residential Property Price Index is computed for all residential trans- actions on a quarterly basis. It should be differentiated from the Property Price Index that is an agglomeration of residential, commercial and indus- trial property sales. 2This database is provided by Urban Redevelopment Authority (URA), the national planning authority of Singapore which is entrusted with the re- sponsibility of planning the physical development and optimizing the scarce land resource in Singapore. The URA provides comprehensive and up-to- date data and information of the real estate market to improve the market’s efficiency and transparency. The private residential property price indices ublished by the URA are transaction based indices compiled from caveats lodged with the Land Registry. 3The HDB Resale Price Index is based on the transactions of public Hous- ing Development Board flats on the resale market. In other words, resale transactions are open-market transactions that occur subsequent to the ini- tial sale, which is heavily subsidized by the government. 4Both RPPI and HDB resale price indexes are complied based on transac- tions and do not suffer from the smoothing biases in appraisal price series. 5Rate of the GDP growth, used to estimate the changes in the income level, obtained from TRENDS, the Time Series Retrieval and Dissemination database maintained by the Department of Statistics in Singapore is used to construct the time-series for the variables identified in the model. All the variables are in their quarterly series. The TRENDS database is the national repository of macroeconomic variables and sector-specific variables for the Singapore economy. The reliability and integrity of this database, which is maintained and updated by the Ministry’s DOS, are beyond any measure o doubt. Other variables It is shown from housing economics literature that wage, as a 6CPF is the Singaporean’s social security system, mainly providing pension schemes and medical care schemes. It is mandatory for both the employee and the employer to contribute monthly a certain fraction of the employees’ salary to the fund to take care of the retirement, homeownership, and health- care needs of the members. The CPF Board was set up to administer and reserve the value of the savings of its members. The CPF enables easy home-ownership through two popular schemes-the Public Housing Scheme for HDB flats and the Residential Properties Scheme for all housing proper- ties built on freehold land or with a lease of at least 60 years remaining. 7Prime leading rate, the average of nominal bank lending rate, obtained from International Financial Statistics (IFS), the International Monetary Fund’s rincipal statistical publication and is the standard source for all aspects o international and domestic finance. Copyright © 2012 SciRes. 10 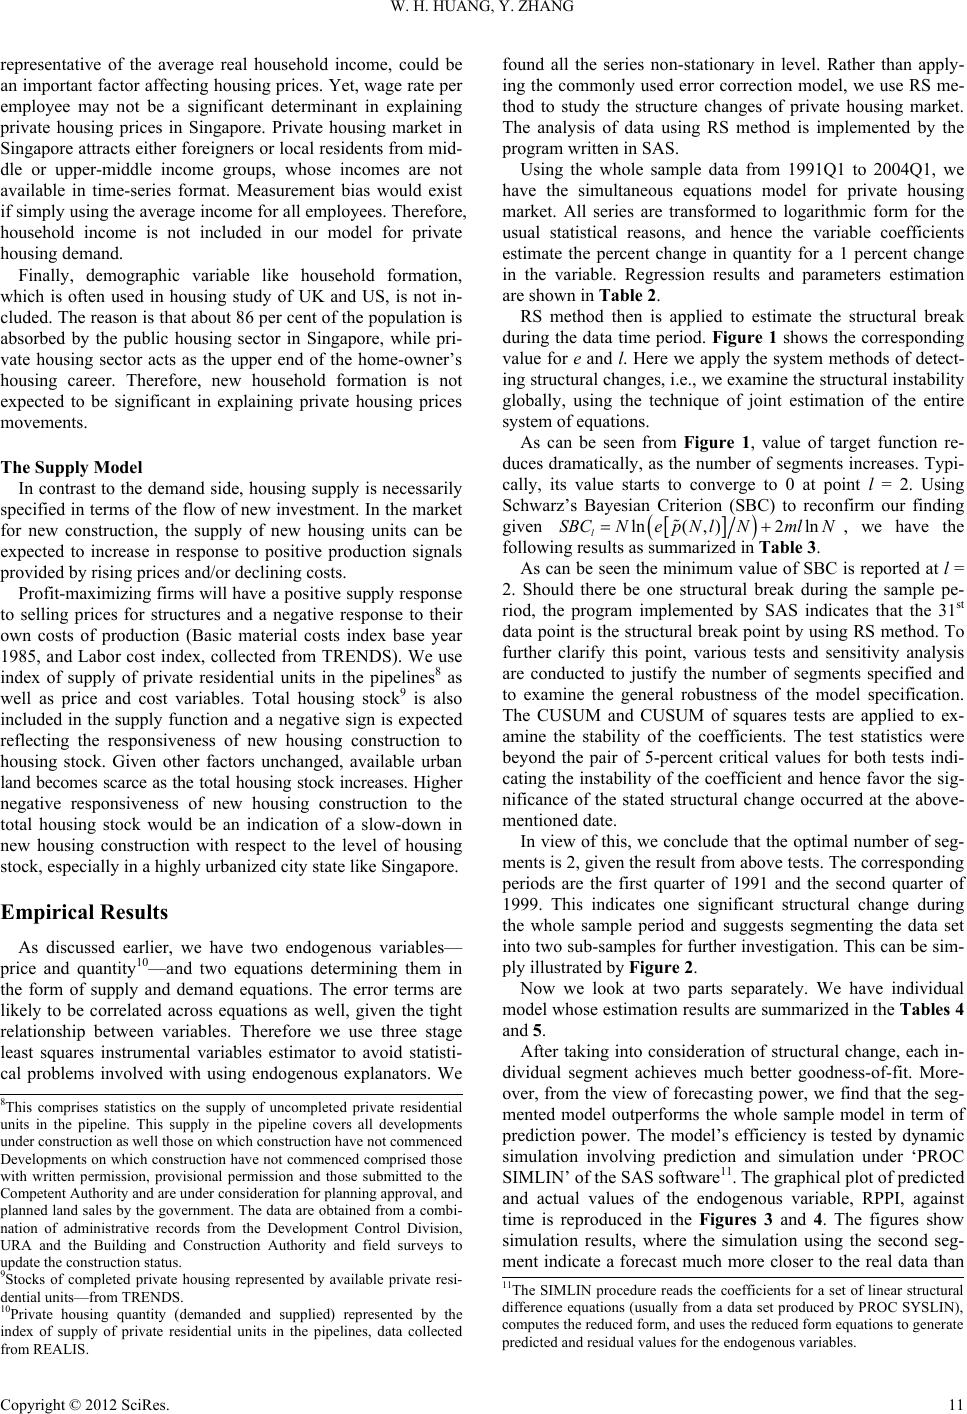 W. H. HUANG, Y. ZHANG representative of the average real household income, could be an important factor affecting housing prices. Yet, wage rate per employee may not be a significant determinant in explaining private housing prices in Singapore. Private housing market in Singapore attracts either foreigners or local residents from mid- dle or upper-middle income groups, whose incomes are not available in time-series format. Measurement bias would exist if simply using the average income for all employees. Therefore, household income is not included in our model for private housing demand. Finally, demographic variable like household formation, which is often used in housing study of UK and US, is not in- cluded. The reason is that about 86 per cent of the population is absorbed by the public housing sector in Singapore, while pri- vate housing sector acts as the upper end of the home-owner’s housing career. Therefore, new household formation is not expected to be significant in explaining private housing prices movements. The Supply Model In contrast to the demand side, housing supply is necessarily specified in terms of the flow of new investment. In the market for new construction, the supply of new housing units can be expected to increase in response to positive production signals provided by rising prices and/or declining costs. Profit-maximizing firms will have a positive supply response to selling prices for structures and a negative response to their own costs of production (Basic material costs index base year 1985, and Labor cost index, collected from TRENDS). We use index of supply of private residential units in the pipelines8 as well as price and cost variables. Total housing stock9 is also included in the supply function and a negative sign is expected reflecting the responsiveness of new housing construction to housing stock. Given other factors unchanged, available urban land becomes scarce as the total housing stock increases. Higher negative responsiveness of new housing construction to the total housing stock would be an indication of a slow-down in new housing construction with respect to the level of housing stock, especially in a highly urbanized city state like Singapore. Empirical Results As discussed earlier, we have two endogenous variables— price and quantity10—and two equations determining them in the form of supply and demand equations. The error terms are likely to be correlated across equations as well, given the tight relationship between variables. Therefore we use three stage least squares instrumental variables estimator to avoid statisti- cal problems involved with using endogenous explanators. We found all the series non-stationary in level. Rather than apply- ing the commonly used error correction model, we use RS me- thod to study the structure changes of private housing market. The analysis of data using RS method is implemented by the program written in SAS. Using the whole sample data from 1991Q1 to 2004Q1, we have the simultaneous equations model for private housing market. All series are transformed to logarithmic form for the usual statistical reasons, and hence the variable coefficients estimate the percent change in quantity for a 1 percent change in the variable. Regression results and parameters estimation are shown in Table 2. RS method then is applied to estimate the structural break during the data time period. Figure 1 shows the corresponding value for e and l. Here we apply the system methods of detect- ing structural changes, i.e., we examine the structural instability globally, using the technique of joint estimation of the entire system of equations. As can be seen from Figure 1, value of target function re- duces dramatically, as the number of segments increases. Typi- cally, its value starts to converge to 0 at point l = 2. Using Schwarz’s Bayesian Criterion (SBC) to reconfirm our finding given ln2 ln (,) l SBCNml N eN pNl , we have the following results as summarized in Table 3. As can be seen the minimum value of SBC is reported at l = 2. Should there be one structural break during the sample pe- riod, the program implemented by SAS indicates that the 31st data point is the structural break point by using RS method. To further clarify this point, various tests and sensitivity analysis are conducted to justify the number of segments specified and to examine the general robustness of the model specification. The CUSUM and CUSUM of squares tests are applied to ex- amine the stability of the coefficients. The test statistics were beyond the pair of 5-percent critical values for both tests indi- cating the instability of the coefficient and hence favor the sig- nificance of the stated structural change occurred at the above- mentioned date. In view of this, we conclude that the optimal number of seg- ments is 2, given the result from above tests. The corresponding periods are the first quarter of 1991 and the second quarter of 1999. This indicates one significant structural change during the whole sample period and suggests segmenting the data set into two sub-samples for further investigation. This can be sim- ply illustrated by Figure 2. Now we look at two parts separately. We have individual model whose estimation results are summarized in the Tables 4 and 5. After taking into consideration of structural change, each in- dividual segment achieves much better goodness-of-fit. More- over, from the view of forecasting power, we find that the seg- mented model outperforms the whole sample model in term of prediction power. The model’s efficiency is tested by dynamic simulation involving prediction and simulation under ‘PROC SIMLIN’ of the SAS software11. The graphical plot of predicted and actual values of the endogenous variable, RPPI, against time is reproduced in the Figures 3 and 4. The figures show simulation results, where the simulation using the second seg- ment indicate a forecast much more closer to the real data than 8This comprises statistics on the supply of uncompleted private residential units in the pipeline. This supply in the pipeline covers all developments under construction as well those on which construction have not commenced Developments on which construction have not commenced com rised those with written permission, provisional permission and those submitted to the Competent Authority and are under consideration for planning approval, and planned land sales by the government. The data are obtained from a combi- nation of administrative records from the Development Control Division, URA and the Building and Construction Authority and field surveys to update the construction status. 9Stocks of completed private housing represented by available private resi- dential units—from TRENDS. 10Private housing quantity (demanded and supplied) represented by the index of supply of private residential units in the pipelines, data collected from REALIS. 11The SIMLIN procedure reads the coefficients for a set of linear structural difference equations (usually from a data set produced by PROC SYSLIN), computes the reduced form, and uses the reduced form equations to generate predicted and residual values for the endogenous variables. Copyright © 2012 SciRes. 11 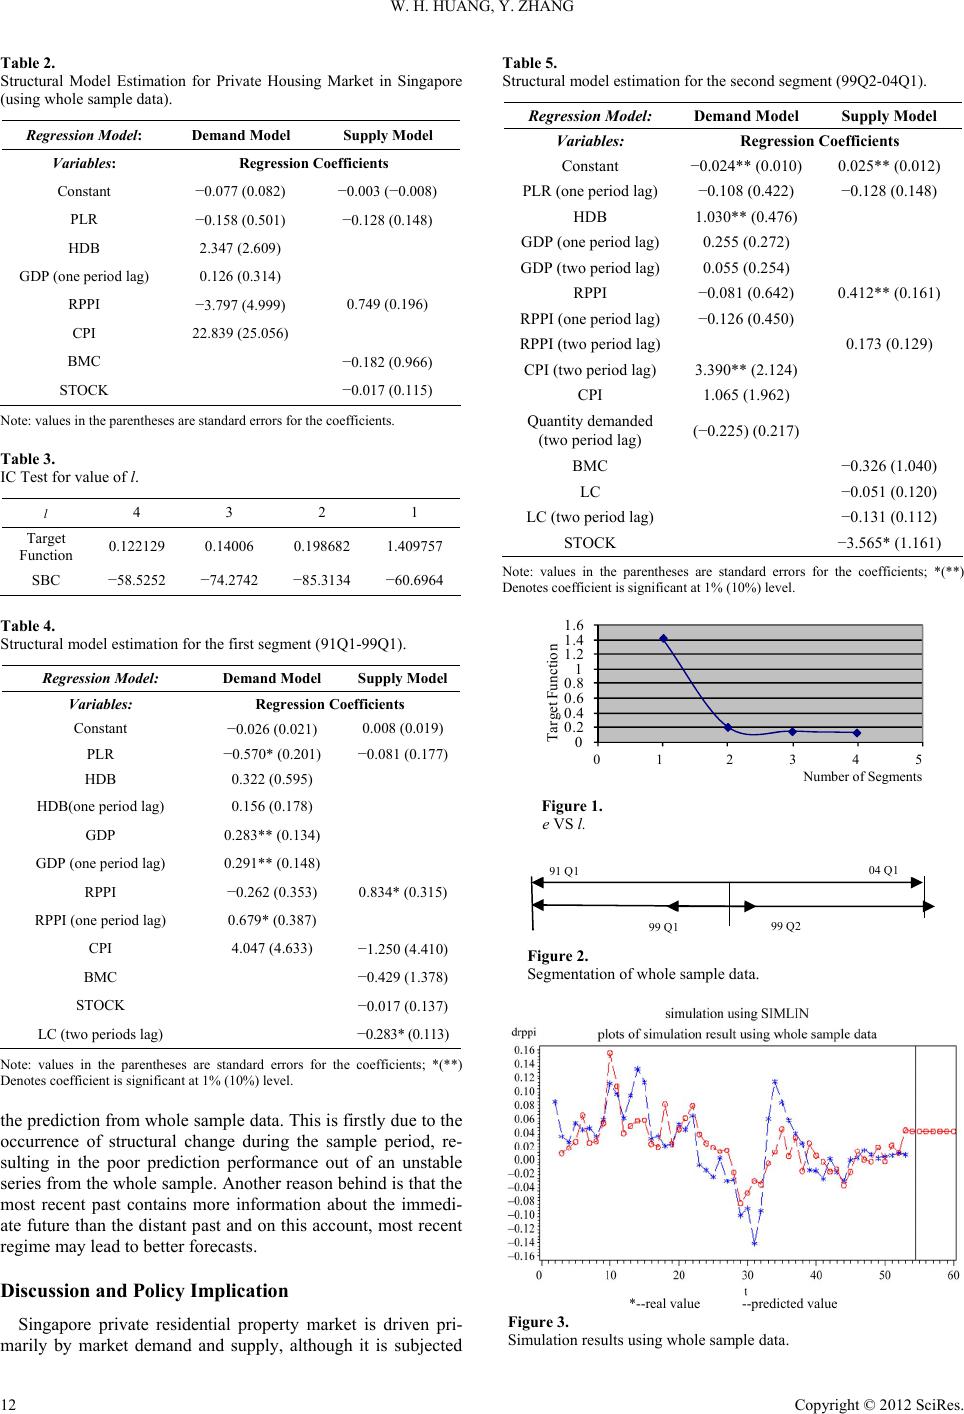 W. H. HUANG, Y. ZHANG Table 2. Structural Model Estimation for Private Housing Market in Singapore (using whole sample data). Regressio n Model: Demand Model Supply Model Variables: Regression Coefficients Constant −0.077 (0.082) −0.003 (−0.008) PLR −0.158 (0.501) −0.128 (0.148) HDB 2.347 (2.609) GDP (one period lag) 0.126 (0.314) RPPI −3.797 (4.999) 0.749 (0.196) CPI 22.839 (25.056) BMC −0.182 (0.966) STOCK −0.017 (0.115) Note: values in the parentheses are standard errors for the coefficients. Table 3. IC Test for value of l. l 4 3 2 1 Target Function 0.122129 0.14006 0.198682 1.409757 SBC −58.5252 −74.2742 −85.3134 −60.6964 Table 4. Structural model estimation for the first segment (91Q1-99Q1). Regression Model: Demand Model Supply Model Variables: Regression Coefficients Constant −0.026 (0.021) 0.008 (0.019) PLR −0.570* (0.201) −0.081 (0.177) HDB 0.322 (0.595) HDB(one period lag) 0.156 (0.178) GDP 0.283** (0.134) GDP (one period lag) 0.291** (0.148) RPPI −0.262 (0.353) 0.834* (0.315) RPPI (one period lag) 0.679* (0.387) CPI 4.047 (4.633) −1.250 (4.410) BMC −0.429 (1.378) STOCK −0.017 (0.137) LC (two periods lag) −0.283* (0.113) Note: values in the parentheses are standard errors for the coefficients; *(**) Denotes coefficient is significant at 1% (10%) level. the prediction from whole sample data. This is firstly due to the occurrence of structural change during the sample period, re- sulting in the poor prediction performance out of an unstable series from the whole sample. Another reason behind is that the most recent past contains more information about the immedi- ate future than the distant past and on this account, most recent regime may lead to better forecasts. Discussion and Policy Implication Singapore private residential property market is driven pri- marily by market demand and supply, although it is subjected Table 5. Structural model estimation for the second segment (99Q2-04Q1). Regression Model: Demand Model Supply Model Variables: Regression Coefficients Constant −0.024** (0.010) 0.025** (0.012) PLR (one period lag) −0.108 (0.422) −0.128 (0.148) HDB 1.030** (0.476) GDP (one period lag) 0.255 (0.272) GDP (two period lag) 0.055 (0.254) RPPI −0.081 (0.642) 0.412** (0.161) RPPI (one period lag) −0.126 (0.450) RPPI (two period lag) 0.173 (0.129) CPI (two period lag) 3.390** (2.124) CPI 1.065 (1.962) Quantity demanded (two period lag) (−0.225) (0.217) BMC −0.326 (1.040) LC −0.051 (0.120) LC (two period lag) −0.131 (0.112) STOCK −3.565* (1.161) Note: values in the parentheses are standard errors for the coefficients; *(**) Denotes coefficient is significant at 1% (10%) level. 0 0.2 0.4 0.6 0.8 1 1.2 1.4 1.6 Target Function 0 1 2 3 4 5 Number of Segments Figure 1. e VS l. 91 Q104 Q1 99 Q2 99 Q1 Figure 2. Segmentation of whole sample data. *--real value --predicted value Figure 3. Simulation results using whole sample data. Copyright © 2012 SciRes. 12 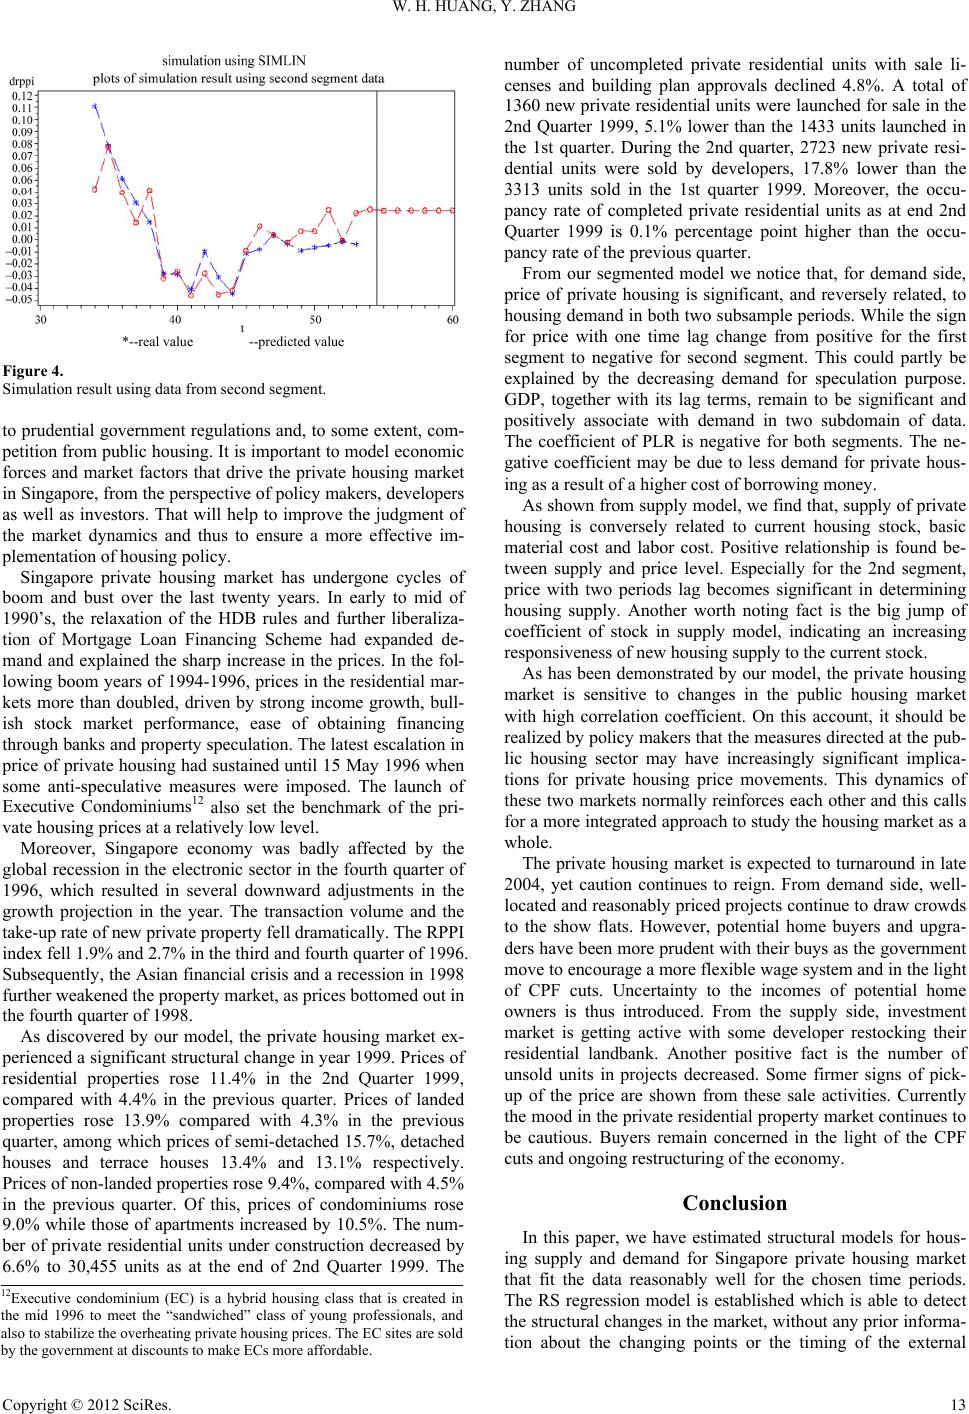 W. H. HUANG, Y. ZHANG *--real value --predicted value Figure 4. Simulation result using data from second segment. to prudential government regulations and, to some extent, com- petition from public housing. It is important to model economic forces and market factors that drive the private housing market in Singapore, from the perspective of policy makers, developers as well as investors. That will help to improve the judgment of the market dynamics and thus to ensure a more effective im- plementation of housing policy. Singapore private housing market has undergone cycles of boom and bust over the last twenty years. In early to mid of 1990’s, the relaxation of the HDB rules and further liberaliza- tion of Mortgage Loan Financing Scheme had expanded de- mand and explained the sharp increase in the prices. In the fol- lowing boom years of 1994-1996, prices in the residential mar- kets more than doubled, driven by strong income growth, bull- ish stock market performance, ease of obtaining financing through banks and property speculation. The latest escalation in price of private housing had sustained until 15 May 1996 when some anti-speculative measures were imposed. The launch of Executive Condominiums12 also set the benchmark of the pri- vate housing prices at a relatively low level. Moreover, Singapore economy was badly affected by the global recession in the electronic sector in the fourth quarter of 1996, which resulted in several downward adjustments in the growth projection in the year. The transaction volume and the take-up rate of new private property fell dramatically. The RPPI index fell 1.9% and 2.7% in the third and fourth quarter of 1996. Subsequently, the Asian financial crisis and a recession in 1998 further weakened the property market, as prices bottomed out in the fourth quarter of 1998. As discovered by our model, the private housing market ex- perienced a significant structural change in year 1999. Prices of residential properties rose 11.4% in the 2nd Quarter 1999, compared with 4.4% in the previous quarter. Prices of landed properties rose 13.9% compared with 4.3% in the previous quarter, among which prices of semi-detached 15.7%, detached houses and terrace houses 13.4% and 13.1% respectively. Prices of non-landed properties rose 9.4%, compared with 4.5% in the previous quarter. Of this, prices of condominiums rose 9.0% while those of apartments increased by 10.5%. The num- ber of private residential units under construction decreased by 6.6% to 30,455 units as at the end of 2nd Quarter 1999. The number of uncompleted private residential units with sale li- censes and building plan approvals declined 4.8%. A total of 1360 new private residential units were launched for sale in the 2nd Quarter 1999, 5.1% lower than the 1433 units launched in the 1st quarter. During the 2nd quarter, 2723 new private resi- dential units were sold by developers, 17.8% lower than the 3313 units sold in the 1st quarter 1999. Moreover, the occu- pancy rate of completed private residential units as at end 2nd Quarter 1999 is 0.1% percentage point higher than the occu- pancy rate of the previous quarter. From our segmented model we notice that, for demand side, price of private housing is significant, and reversely related, to housing demand in both two subsample periods. While the sign for price with one time lag change from positive for the first segment to negative for second segment. This could partly be explained by the decreasing demand for speculation purpose. GDP, together with its lag terms, remain to be significant and positively associate with demand in two subdomain of data. The coefficient of PLR is negative for both segments. The ne- gative coefficient may be due to less demand for private hous- ing as a result of a higher cost of borrowing money. As shown from supply model, we find that, supply of private housing is conversely related to current housing stock, basic material cost and labor cost. Positive relationship is found be- tween supply and price level. Especially for the 2nd segment, price with two periods lag becomes significant in determining housing supply. Another worth noting fact is the big jump of coefficient of stock in supply model, indicating an increasing responsiveness of new housing supply to the current stock. As has been demonstrated by our model, the private housing market is sensitive to changes in the public housing market with high correlation coefficient. On this account, it should be realized by policy makers that the measures directed at the pub- lic housing sector may have increasingly significant implica- tions for private housing price movements. This dynamics of these two markets normally reinforces each other and this calls for a more integrated approach to study the housing market as a whole. The private housing market is expected to turnaround in late 2004, yet caution continues to reign. From demand side, well- located and reasonably priced projects continue to draw crowds to the show flats. However, potential home buyers and upgra- ders have been more prudent with their buys as the government move to encourage a more flexible wage system and in the light of CPF cuts. Uncertainty to the incomes of potential home owners is thus introduced. From the supply side, investment market is getting active with some developer restocking their residential landbank. Another positive fact is the number of unsold units in projects decreased. Some firmer signs of pick- up of the price are shown from these sale activities. Currently the mood in the private residential property market continues to be cautious. Buyers remain concerned in the light of the CPF cuts and ongoing restructuring of the economy. Conclusion In this paper, we have estimated structural models for hous- ing supply and demand for Singapore private housing market that fit the data reasonably well for the chosen time periods. The RS regression model is established which is able to detect the structural changes in the market, without any prior informa- tion about the changing points or the timing of the external 12Executive condominium (EC) is a hybrid housing class that is created in the mid 1996 to meet the “sandwiched” class of young professionals, and also to stabilize the overheating private housing prices. The EC sites are sold by the government at discounts to make ECs more affordable. Copyright © 2012 SciRes. 13  W. H. HUANG, Y. ZHANG Copyright © 2012 SciRes. 14 shocks. This method provides a systematic and operational app- roach that can accurately detect structural changing points without any knowledge of the pattern and timing of possible structural shifts. The method is based on the principle of dy- namic programming and the use of recursive regression allows global minimizers to be obtained using a number of sums of squared residuals rather than an exhaustive grid search. By applying structural change analysis, we are able to detect the structural break point and segmented models show better goodness-of-fit in estimation and improved accuracy in fore- casting. The structural changes we detect are proved to be con- sistent with policy change and external shocks to the model. Our model reconfirms the findings by Lum (2002), that demand and supply macro-variables are found to be significant deter- minant for private housing prices over the long run. The land sale program and the liberalization of public housing market were proven to be effective short-run policy tools adopted by government in stabilizing the private housing market. REFERENCES Akaike, H. (1973). “nformation theory and an extension of the maxi- mum likelihood principle. 2nd International Symposium on Informa- tion Theory, Tsahkadsor, 2-8 September 1973. Chen, M. C., & Sing, T. F. (2000). Inflation-hedging characteristics of residential property prices: A comparative analysis between the UK and the asian markets. 5th Annual Asian Real Estate Society Confer- ence, Beijing, 26-30 July 2000. Dicks, M. J. (1990). A simple model of the housing market. Bank of England Discussion Paper, London, 49. Di Pasquale, D., & Wheaton, W. (1994). Housing market dynamics and the future of housing prices. Journal of Urban Economics, 35, 1-27. doi:10.1006/juec.1994.1001 Ho, K. H. D., & Cuervo, J. C. (1999). A cointegration approach to the price dynamics of private housing—A singapore case study. Journal of Property Investment & Finance, 17, 35-60. Ho, K. H. D., & Tay, P. H. D. (1993). An econometric forecast of the private residential price index in Singapore. Journal of Real Estate and Construction, 3, 39-50 Hsieh, L. M. (1990). Estimation of determinants of real estate prices and macro economic variables. China Economic Research Institute. Huang, W., & Zhang, Y. (2004). Estimating structural change in linear simultaneous equations. Proceedings of 2004 Australasian Meeting of the Econometric Society, Melbourne, 7-9 July 2004. Lum, S. K. (2002). Market fundamentals, public policy and private gain: House price dynamics in Singapore. Journal of Property Research, 19, 121-143. doi:10.1080/09599910210125232 Monetary Authority of Singapore (2001). Special feature on recent developments in the property market. MAS Economics Department Quarterly Bulletin. MTI (2001). Residential property prices and national income. Eco- nomic Survey of Singapore, F i rst Quarter, 49-51. Muellbauer, J., & Murphy, A. (1997). Booms and busts in the UK housing market. Economic Journal, 107 , 1720-1746. doi:10.1111/j.1468-0297.1997.tb00076.x Ong, S. E., & Sing, T. F. (2002). Price discovery between private and public housing markets. Urban Studies, 39, 57-67. doi:10.1080/00420980220099069 Ong, S. E. (1999). Housing affordability and upward mobility from public to private housing in Singapore. Workshops on Housing Pol- icy in Emerging Economics, Singapore City. Peng, R., & Wheaton, W. C. (1994). Effects of restrictive land supply on housing in hong kong: and econometric analysis. Journal of Housing Research, 5, 263-291 Phang, S. Y., & Wong, W. K. (1997). Government policies and private housing prices in Singapore. Urban Studies, 34, 1819-1829. doi:10.1080/0042098975268 Phang, S. Y., Wong, W. K., Tay, K. P., & Amy, L. K. (1995). The effect of government policies on private residential property prices in Singapore. NUS/AREUEA International Congress on Real Estate. Phang, S. Y. (2001). Housing POLICY, WEALTH FORMATION ANd the Singapore Economy. Housing St udies , 16, 443-459. doi:10.1080/02673030120066545 Rosen, K. T., & Smith, L.B. (1983). The price-adjustment process for rental housing and the natural vacancy rate. American Economic Re- view, 73, 779-786. Schwarz, G. (1978). Estimating the dimension of a model. Annals of Statistics, 6, 461-464. doi:10.1214/aos/1176344136 Scott, B. G. (1974). Partition regression (in theory and methods). Jour- nal of the American Statistical Association, 69, 945-947. Sing, T. F., Tsai, I-C., & Chen, M.-C. (2004). Price discovery and seg- mentation in the public and private housing markets in Singapore. Working Paper, Singapore City: Department of Real Estate, National University of Singapore. Sing, T. F. (2001). Dynamics of the condominium market in Singapore. International Real Estate Review, 4, 135-158 Sugiura, N. (1978). Further analysis of the data by Akaike’s informa- tion criterion and the finite corrections. Communications in Statistics, Theory and Methods, A7, 13-26. doi:10.1080/03610927808827599 Tu, Y. (2001). Modeling Singapore urban private housing market dy- namics. Working Paper Series, Singapore City: Department of Real Estate, National University of Singapore Fisher, W. D. (1958). On grouping for maximum homogeneity. Journal of the American Statistical Association, 53, 789-798.
|