Paper Menu >>
Journal Menu >>
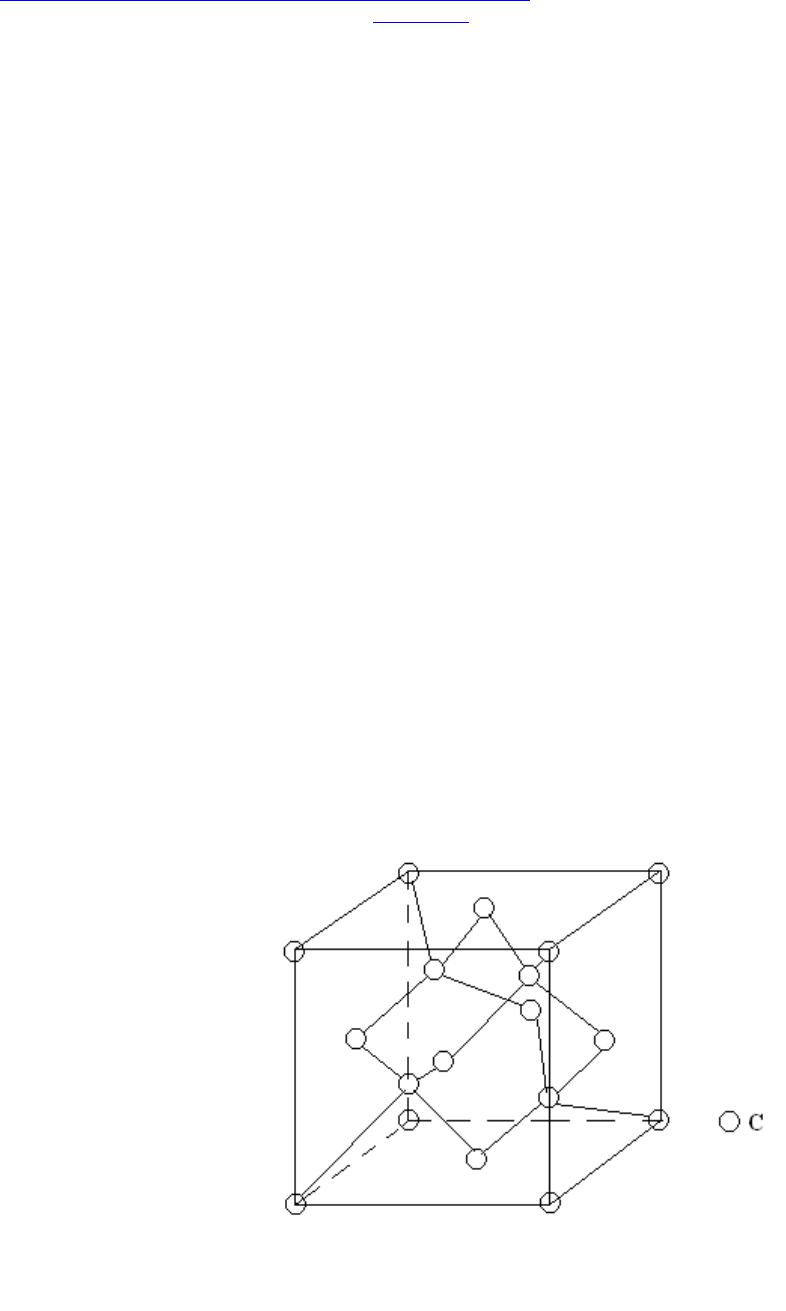 Journal of Minerals & Materials Characterization & Engineering, Vol. 4, No. 2, pp 95-106, 2005 jmmce.org Printed in the USA. All rights reserved 95 Figure 1: A cubic crystal structure unit cell of a diamond; After source [1] Analysis Of Gem-Quality And Experimental Estimat ion Of Toleration Ranges In Geometrical Features Of Brilliant Type Cut Diamonds Audy J.*, Audy K . and Haines T. Edith Cowan University, South West Campus Bunbury, Western Australia, 6230 *corresponding author t.n . (08) 9780 7797, e-mail: j.audy@ecu.edu.au Abstract: The measures that influence the quality of diamonds are cut, shape, colour, clarity and weight. These features are therefore of some economic significance. It has long been recognized that similar type diamonds with identical cuts are subject to some variability in geometrical features that can give rise to differences in their quality. In the present study a brief review is presented of previous investigations that looked at properties of diamonds. This is followed by an overview of current practices in estimating the quality of diamonds with particular focus on brilliant type cut diamonds. The results are presented with prominent dimensional features, namely, girdle diameter, table, crown, girdle width, pavilion and their corresponding angles that were measured on 12 stones, six in each of 2 sets, ‘as bought’ brilliant type cut diamonds from one supplier. Variations in scatter and the mean value of each dimensional feature between the two sets of diamonds were estimated using relevant statistical methods. The results are discussed in the paper from both a qualitative and a quantitative point of view. It is suggested that this sort of information may be used to assist in assessing the quality of brilliants and selecting geometrically similar stones for jewels, when needed. Keywords: Diamonds, Brilliant Type Cuts, Statistical Analyses, Similarities and Differences, Gem Quality INTRODUCTION Diamonds have long been known for their hardness [1], durability and, in polished conditions, for transparency and high surface reflectivity [2]. Chemically, they are an unusual occurrence of carbon crystallized in the cubic system [1], although octahedrons and rhombic dodecahedrons are other crystal forms most commonly found [2]. According to B.C. Forbes they are "only lumps of coal that stuck to their jobs". In diamonds, each carbon binds to four other carbons by 96Audy J.*, Audy K. and Haines T.Vol. 4, No. 2 very strong covalent bonding, see Figure 1. This bonding is responsible for excellent hardness of about 7000 measured with the Knoop scale under a load of 100g [1]. With respect to the first two features, on Mohs’ scale diamonds rate the highest number - ten [2]. This means that they are able to scratch all other minerals, since everything else rates lower on the scale. Because of this, diamonds became recognized as abrasive tool materials [3] long before they were polished into precious gems. With respect to the other two features, their refractive index measured in sodium light is 2.4175 [3] and the chromatic dispersion is 0.63 [3] which results in a high surface reflectivity of about 17% [3] that makes them desirable as the most valuable gemstones for jewels. The ancient Greek word for a diamond is αδαµασ [2 and 3] (adamas) meaning invincible. Generally, diamonds are very pure minerals, with only nitrogen present in substantial amounts, but less than 0.5% [4], and other ‘trace’ elements [4], namely boron, nickel, silicon and hydrogen, if any. Nitrogen, trace elements and plastic deformation of lattice planes were reported [4] to be responsible for creating a wide range of coloured diamonds. The colourless diamonds are very valuable. Yellowish diamonds with a variety of shadings are quite common. Blue and green diamonds are rarities. Pink and red diamonds are the rarest of all. Because of their unusual properties, diamonds became a challenge for scientists to study them, miners to mine them, jewelers to polish them, collectors to collect them, women to admire them and dealers to trade them. I know a few people who left their countries in haste. They could not sell their house and cars, and did not want to carry (or had no time to withdraw) cash, so they simply picked up their gems and walked away. One should agree that with those small shiny stones it is quite easy to move the value around the world. Diamonds are believed to enhance love, reproduction and immortality. They represent power and wealth, but sometimes they did not bring the expected luck to their owners, as it was, for example, in the case of the famous Koh-i-Noor (Mountain of Light) believed to be originally a piece of a 240 carat [2] heavy diamond called Great Mogul. Legend has it that Koh-i-Noor was cursed and brought misfortune and death to any man who possessed it. For more than 500 years the gem went from one owner to another and was passed on or seized by various rulers in Persia and India, until the 1850’s when it was presented to Queen Victoria. This diamond was later re-cut to a ~106 carat [2] oval brilliant in order to improve its brilliance and now belongs to the Royal family crown jewels. From this story it is evident that weight is not necessarily the most important feature of diamonds and could be sacrificed in order to improve light reflection and hence the brilliance of a diamond. With diamonds life is always full of surprises, as happened in the case of Shirley Strawn from Murfreesboro, Arkansas, USA. Literature source [5] reported that Shirley was a frequent visitor to the 887-acre Crater of Diamonds State Park, where for a daily rent of $5, the public can search the site and look for diamonds. The work was exhausting and the diamonds she found were so small that they hardly covered her expenses. Then after one and half years without missing a day she found a three-carat stone. When polished into a 1.09-carat round brilliant, it was certified to be an extremely rare gem - D-flawless in clarity, color and cut. There were rumors that this brilliant (one 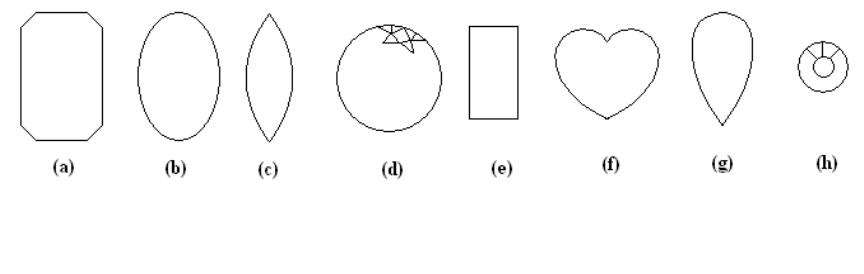 Vol. 4, No. 2. Analysis Of Gem-Quality And Experimental Estimation Of Toleration 97 Ranges In Geometrical Features Of Brilliant Type Cut Diamonds in a billion) may be worth more than $300,000 but Shirley sold her treasure for $34,700 to the Arkansas Park Headquarters. This story indicated that flawless diamonds are very rare and even a small ‘perfect’ diamond can become extremely valuable when cut and polished in the correct way. This paper focuses on analysis of current practices in determining the quality of brilliant type cut diamonds in the light of standards and procedures associated with prominent diamond features. This is followed by a study of ‘measured’ variations of dimensional features on twelve ‘as bought’ brilliant type cut diamonds (6 stones in each of 2 sets) from one supplier. Appropriate statistical tests were chosen to determine whether or not the mean values and variances could be considered statistically equal at the selected confidence levels to establish differences, if any, between these same type diamonds. QUANTITATIVE AND QUALITATIVE MEASURES OF DIAMONDS The weight, shape and cut of a diamond can be measured directly and, as such, are of a quantitative nature. In contrast, the colour and clarity are mostly qualitative. However, they can be assessed indirectly, by comparing ‘an observed’ image against those in standard(s) as shown later in the text, and, as such, are somewhat of a semi- quantitative nature. The weight of diamonds is measured in carats. A carat is one fifth of a gram, which is a standard basic unit for the measurement of diamond weight. Every carat is divided into 100 points, eg 0.25ct = ¼ carat, 0.5ct = ½ carat etc. Diamonds occur in nature as minerals in different shapes. A relatively large rough diamond stone could under a dealer’s loupe easily turn out to be a ‘double decker’ which means that it consists of two-different quality-stones fused together. Generally, natural diamonds are quite dull and have a rather unattractive dark color [2 to 4]. They have to be shaped in a way that ‘fits’ best to the features of the rough stone. The geometric form of a diamond is dictated by the shape of the gem. Some of the most popular diamond shapes/cuts are shown in a sketch in Figure 2. Into those shapes the diamond’s facets are then cut and polished in order of revealing ‘the true’ brilliance and fire of the stone(s). Therefore, the cut is the only Figure 2: Simple sketch showing eight popular diamond cuts, namely, emerald (a); oval (b); marquise (c); brilliant (d); baguette (e); heart shape (f); pear (g) and single cut (h). After source [2]. 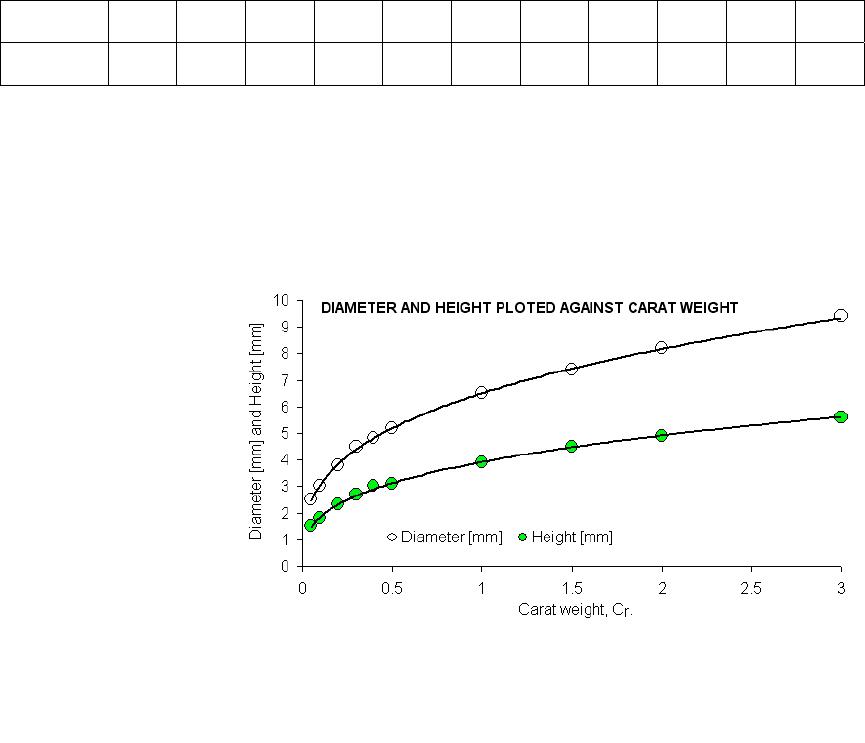 98Audy J.*, Audy K. and Haines T.Vol. 4, No. 2 Figure 3: Relationship between Diameter, Height and Carat Weight of Brilliant Type cut diamonds. feature under human control that gives the diamonds their precise facets / angles and proportions for gaining the needed reflection and refraction of light. Diamond colours range from rare colourless to common yellowish and the clarity depends on the amount of inclusions visible under magnification of 10 times. REPORTED PROCEDURES TO DETERMINE THE QUALITY OF BRILLIANT TYPE CUT DIAMONDS Table 1 shows the ‘as reported’ standard relationship between carat weight, cr, diameter, D, and height, H, of brilliant type cut diamonds. Figure 3 shows a plot of carat weight against the diameter and height as a function of data from Table 1. It is evident from Figure 3 that the plotted trend curves a r e t h o s e o f power regression type(s). The associated r eg r es s io n c u rve equations are given below. Table 1: Reported relationship between carat weight, cr, diameter, D, and height, H, of brilliant type cut diamonds cr0.050.1 0.2 0.3 0.4 0.5etc 1 1.5 23 D [mm]2.533.84.54.85.2etc 6.57.48.2 9.4 () 3269.0 52.6 r cxD =(1) () 3257.0 9264.3 r cxH =(2) It is evident from Equations 1 and 2 that power regression type curves from Figure 3 have different intercepts (6.52 for D and 3.9264 for H) and different slopes (0.3269 for D and 0.3257 for H). Moreover, quantitatively the slope and intercepts for the diameter(s) were greater than those for the height(s). Consequently it indicates that there is some focus on the diameter rather than the height of diamonds. However these two dimensional features are interrelated and as such can 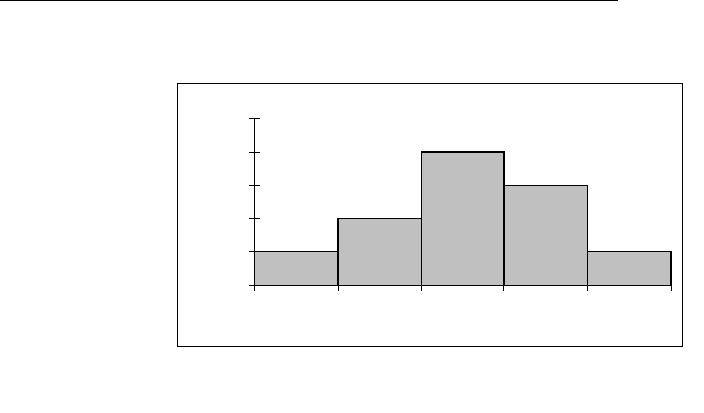 Vol. 4, No. 2. Analysis Of Gem-Quality And Experimental Estimation Of Toleration 99 Ranges In Geometrical Features Of Brilliant Type Cut Diamonds Figure 4Percentage deviation for the predicted carat weight of brilliant t yp e cut diamonds. not be treated separately when calculating the carat weight of diamonds. Since the dimensional trends in Figure 3 have shown monotonic patterns, a multi-variable regression analysis was employed to curve fit the geometrical trends with respect to carat weight for brilliant type cut diamonds. The equation is given below. ( ) 8994.0 1599.2 )(00509.0 HxDxcr=(3) Furthermore an attempt has been made to determine how closely the empirical- type Equation 3 fits the ‘as reported’ data shown earlier in Table 1. The ‘predicted’ carat weight values were compared with the ‘reported’ ones and the percentage difference, E, between the predicted and expected values was calculated using an Equation 4, shown below. ht valuecarat weig expected ht value)carat weig predicted ht valuecarat weig (expected x 100 Edeviation %=(4) The histograms for the percentage deviation and its associated σE value are shown in Figure 4. From this histogram it is evident that the mean percentage difference (of about -0.08%) and the standard deviation (of about 4.2%) are very low. This numerical exercise indicated that the curve-fitted empirical Equation 3 can be used as an easier alternative for prediction of carat weight from the diameter and height of brilliant type cut diamonds without much loss of accuracy. A ‘reported’ geometry for the ‘ideal’ cut of brilliant type diamonds is shown in Figure 5. Numerical recommendations in Figure 5, left, were adopted from source [6]. Figure 5, centre, shows a computer modified image with laser engraving on girdle. Such image “logo’ is typical on diamonds from recognized dealers. It is invisible to the eye, and can be read only under 10 power magnification. It is a proof of authenticity. Unfortunately (or fortunately for some), it can easily be polished off (within about 2 to 3 hours) in order to avoid identification of, for example, stolen diamonds. Figure 5 right, shows technical terms for various dimensional features. A comparison of these technical terms in different sources [2, 3, 5, 6 and 7] indicates that there is some general agreement on the nomenclature and prominent dimensional features. The most prominent dimensional features specified for brilliant type cut diamonds are: girdle diameter, table Mean value = -0.08 [%] Standard Deviation = 4.2 [%] 0 1 2 3 4 5 -7 -5024 Devia ti on [%] Frequency 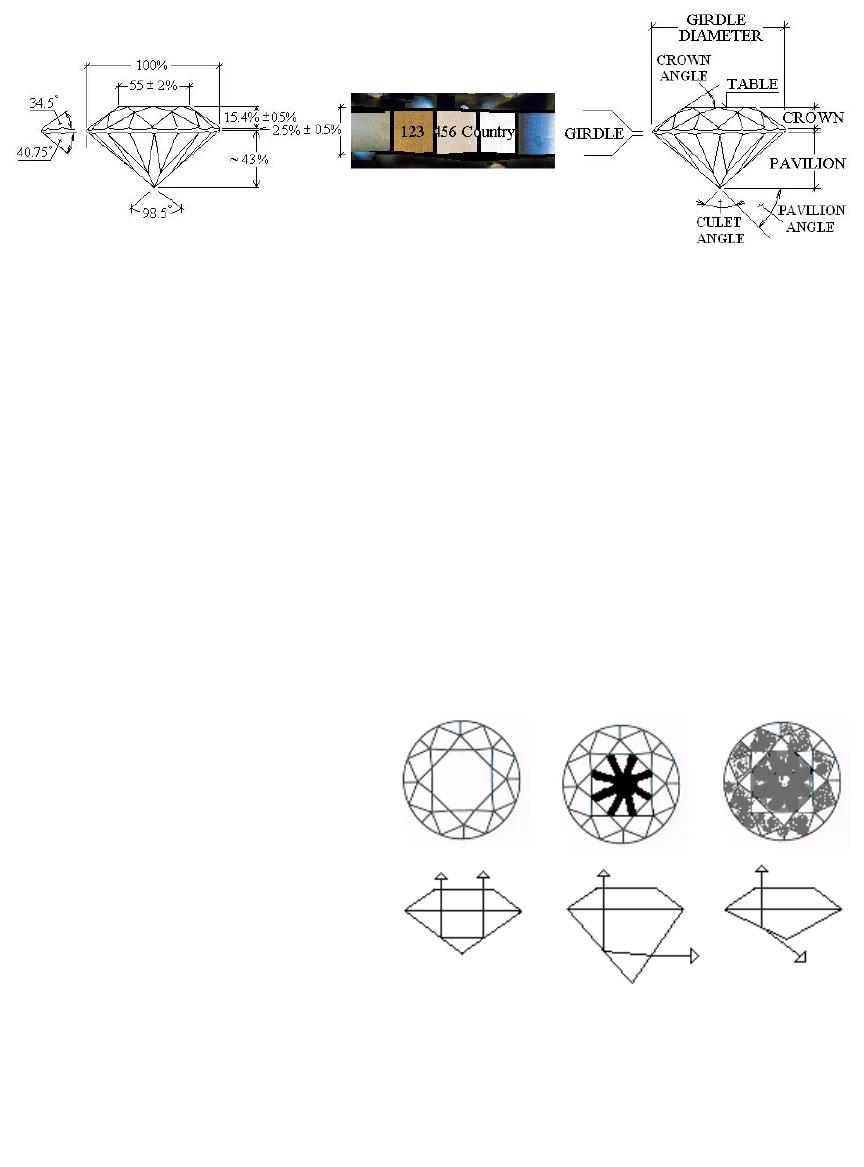 100Audy J.*, Audy K. and Haines T.Vol. 4, No. 2 Figure 6: Sketches of a br illiant type cut diamond showing, from left to right, ‘ideal’ cut, ‘deep’ cu t, and ‘shallow’ cut, with arrows indicating the light reflection. After source [6]. size, crown height, girdle width, pavilion depth, crown angle, pavilion angle, and culet angle. Some of these features are defined in literature [2, 3 and 6]. From Figure 5 left, it appears that the tightest tolerance limits are for the crown height (±0.5%) and girdle width (±0.5%). Thus, the crown and girdle are dimensional features of some geometrical significance when grinding the brilliant type cut diamonds. In contrast, source [6] provided only nominal values of angles. Calculations with input data of girdle diameter being 100%, table ranging from 53% to 57% i.e. 55±2% and crown ranging from 14.9% to 15.9% i.e. 15.4±0.5% showed that the crown angle may vary from about 32° to about 37°. This variation is equal to a tolerance of ±2.5% for the nominal value of 34.5°. Similarly, the culet angle and pavilion angle values will vary depending on the ‘real’ value of pavilion length which is provided by source [6] as a balance of about 43%. Figure 6 was adopted from source [6] and shows sketches of brilliant type cut diamonds for ‘ideal’ cut, left, deep cut, centre, and shallow cut, right. For the ideal cut brilliant, light is reflected from facet to facet and leaves straight through the top. For a deep cut brilliant, the reflected light comes back through the side instead of coming back to the top. For the shallow cut brilliant, the reflected light is lost through the bottom leaving a dull reflection in the table. Figure 7 shows possible ways to improve brilliance of deep Figure 5: Sketches and a computer modified image of a brilliant type cut diamond showing, from left to right, mean values and tolerances, laser engraving on a girdle, and the key dimensional features. After sources [6 and 7]. 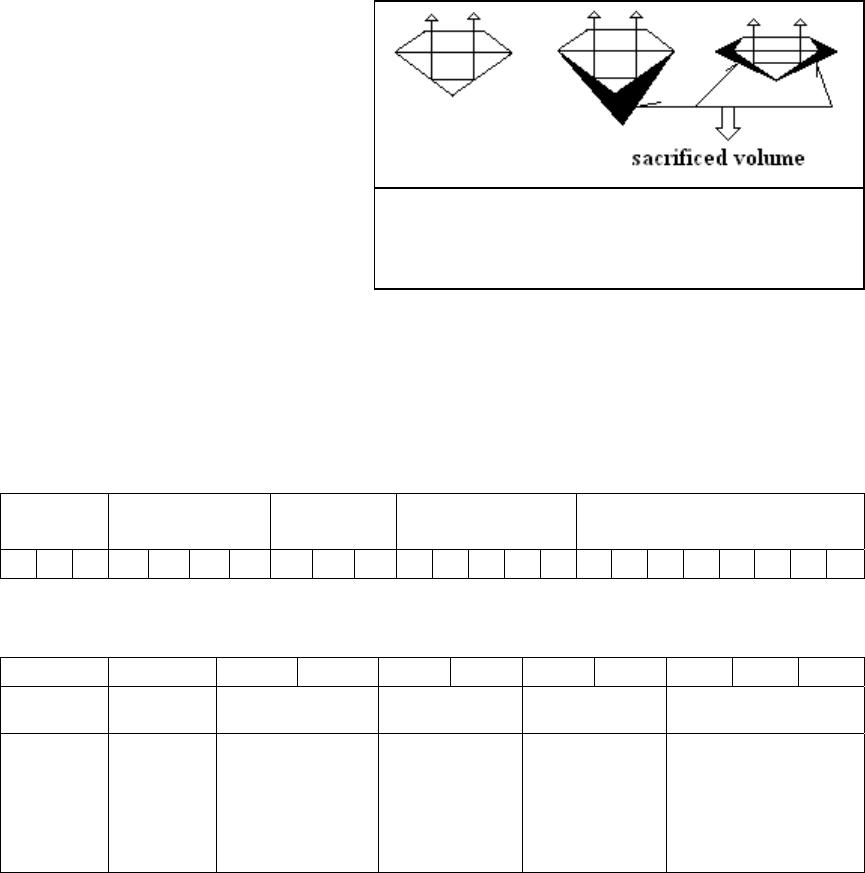 Vol. 4, No. 2. Analysis Of Gem-Quality And Experimental Estimation Of Toleration 101 Ranges In Geometrical Features Of Brilliant Type Cut Diamonds Figure 7: Sketches showing possible improvements in light reflection of brillia nt type cut diamonds b y sacrificing the volume (carat weight) of diamonds. cut and shallow cut diamonds by doing the right cut. From this it is evident that the original rough diamonds have to be sacrificed in order to achieve their brilliance, and not all dealers or jewelers may accept such drastic changes. Table 2 shows a standard for ranking diamonds according to their colour, for ‘best’ from left to most common, right. Finally it should be mentioned that the diamond’s clarity grade is affected by the number of inclusions, their size and location. Ranking is shown in Table 3. Table 2Colour grading scale for brilliant type cut diamonds. After source [7]. colourle ss near colorlessfaint yellow very light yellow light yellow DEF G HIJKLMNOP QRSTUVWXYZ Table 3: Ranking brillian t type cut diamonds in terms of inclusion s. After sources [6 and 7] SymbolFlawless VVS1VVS2VS1VS2SI1SI2I1I2I3 Meaning Without inclusions Very Very Slight Inclusions Very Slight Inclusions Slight Inclusions Imperfect Identificat ion No inclusions visible under 10x magnificat ion Minute and hard to locate inclusions under 10x magnification Minor inclusions difficult to locate under 10x magnification Noticeable inclusions easily to locate under 10x magnification Inclusions are visible to the eye There have been numerous trials to find a way of reducing the amount of inclusions in diamonds. Probably the most successful is the use of a laser beam capable of burning deep and small diameter holes through the diamond table into the inclusion inside the diamond body. The inclusion is then etched off and the hole is covered with a glass like patch. However, such glass patches influence the light reflection of the diamond and as such can easily be identified. From the information selected in Section 3 it is evident that the brilliance of diamonds depends on the type of cut. The rest is in the hands of nature. One may ‘ignore’ carat weight, slightly compromise on clarity and colour, but should never compromise on cut [6] in order to get the most brilliance from the diamond. 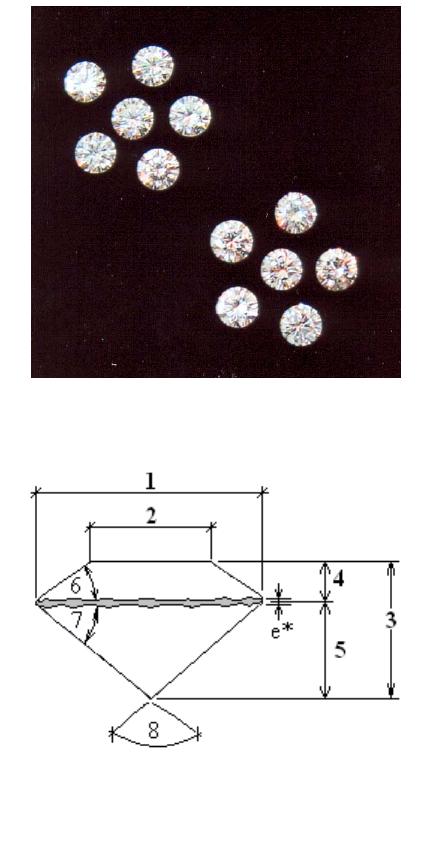 102Audy J.*, Audy K. and Haines T.Vol. 4, No. 2 Figure 8 : Experimental brilliant type cut diamonds EXPERIMENTAL DETAILS OF BRILLIANT TYPE CUT DIAMONDS Measured Geometrical Parameters Twelve brilliant type cut diamonds in two sets (6 stones in each set) from one supplier were selected for investigation, see Figure 8. These diamonds were all the same ‘nominal’ shape, size and cut, weighing individually about 0.05 carats. They were from Africa, colour, I, type clarity, SI. Their geometrical features were measured as shown in Figure 9. The five main geometrica features, namely girdle diameter, 1; table, 2;total height, 3; crown, 4; and pavilion, 5; were measured using an electronic digital caliper and a Type Micro-lite measuring Instrument. Angle features, namely, crown angle, 6, pavilion angle, 7, and culet angle, 8; were calculated from ‘as measured’ dimensional features, 1 to 5. It should be noted that small diamond size and limit of measuring technique did not allow for the measurement of the girdle width. Consequently, it was expected that the girdle width would represent some source of error, e*, which may affect the measurements associated with the crown, 4, and pavilion, 5, features. Finally it should be mentioned that the carat weight was estimated individually for each diamond from its girdle diameter, 1, and the total height, 3, using Equation 3. Statistical Analysis of Experimental Results A number of statistical tests have been selected and employed to analyse the data associated with the measured geometrical features and carat weight of commercial brilliant type cut diamonds. Key features of this statistical approach are documented in Figure 10. The Fisher test (recommended for comparing variances of two sample data) was chosen to test the homogeneity of variances. When the test passed at the selected confidence level the homogeneity of variances was confirmed, and the Student or t-test was used to determine whether or not the mean values of the twelve sample data could be considered statistically equal at the selected confidence level. If the variances were not Figure 9Key to measurement of features of brilliant type cut diamonds 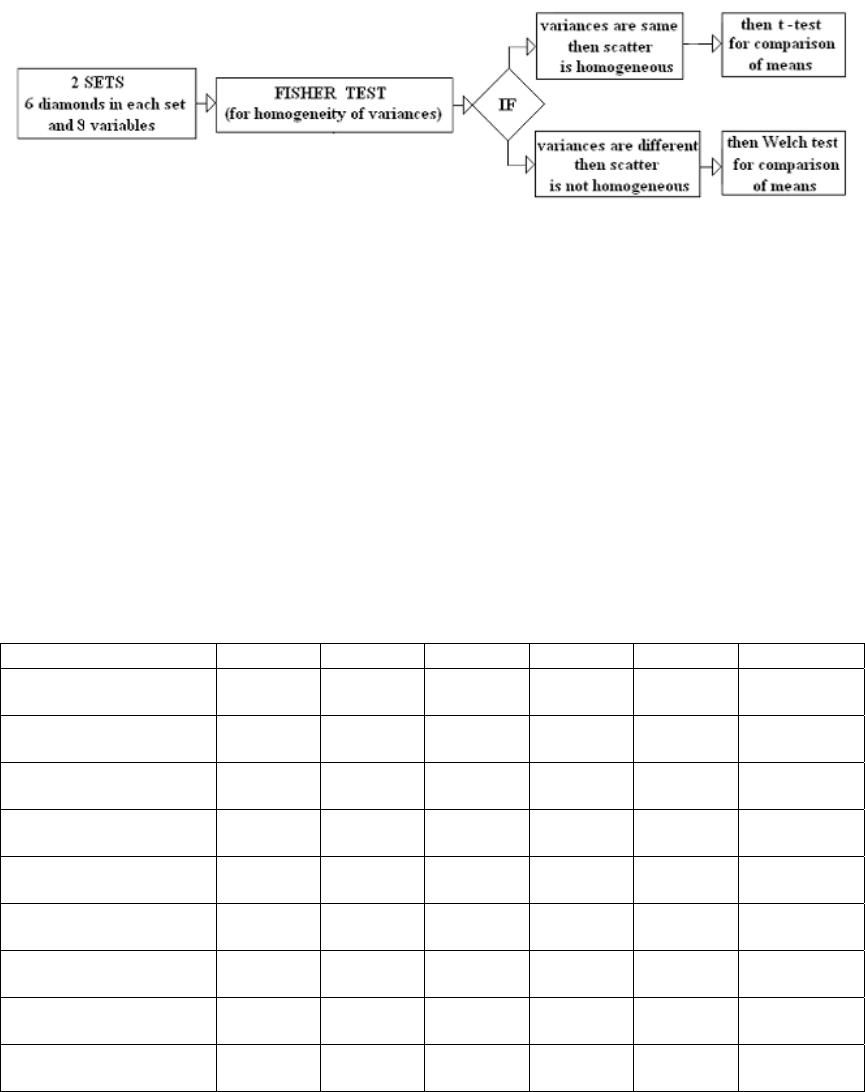 Vol. 4, No. 2. Analysis Of Gem-Quality And Experimental Estimation Of Toleration 103 Ranges In Geometrical Features Of Brilliant Type Cut Diamonds homogeneous according to the Fisher test, the Welch test was used instead of the Student of t-test to compare the mean values of two sample data. RESULTS AND DISCUSSION The measured and calculated result data associated with the geometry of the investigated brilliant type cut diamonds are given in Table 4. Statistical analysis of the results from Table 4 is shown in Table 5. From Table 5 it is evident that both the Fisher Test and T-test passed in all cases because the FRatio (calculated) values were lower than the FStat (tabulated) values, and TTest (calculated) values were lower than TStat (tabulated) values, respectively. This means that variances were homogeneous and means equal, thus showing no difference between the diamonds. Table 4: Tabulated data showing measu r ed and calculated result values for brilliant type cut diamonds VariableSet(s)MeanMinMaxRange St. Dev., σE Girdle Diameter [mm]Set 1 Set 22.502 2.503 2.49 2.49 2.51 2.51 0.02 0.02 0.0075 0.0082 Total Height [mm]Set 1 Set 21.390 1.383 1.37 1.36 1.41 1.41 0.04 0.05 0.014 0.018 Table [mm]Set 1 Set 21.398 1.400 1.38 1.37 1.41 1.42 0.03 0.05 0.012 0.021 Crown [mm]Set 1 Set 20.34 0.345 0.30 0.32 0.36 0.37 0.06 0.05 0.023 0.019 Pavilion [mm]Set 1 Set 21.050 1.038 1.03 1.02 1.08 1.06 0.05 0.04 0.021 0.016 Crown Angle [deg]Set 1 Set 231.6 32.0 29.1 30.2 33.2 33.5 4.15 3.26 1.576 1.331 Pavilion Angle [deg]Set 1 Set 240.0 39.7 39.4 39.1 41 40.2 1.56 1.08 0.60 0.44 Culet Angle [deg]Set 1 Set 2100.0 100.7 98.2 99.7 101.3 101.8 3.1 2.21.199 0.880 Carat Weight [c r ]Set 1 Set 20.0496 0.0495 0.049 0.048 0.05 0.05 0.001 0.002 0.00065 0.00063 For comparison purposes the diamonds were treated as one group. This followed because it was statistically shown that all the geometrical features and carat weight were statistically equal at 95% and higher confidence levels. Comparing the numerical F igure 10: Statistical approach used to analyse the measured geometry of brilliant type cut diamonds 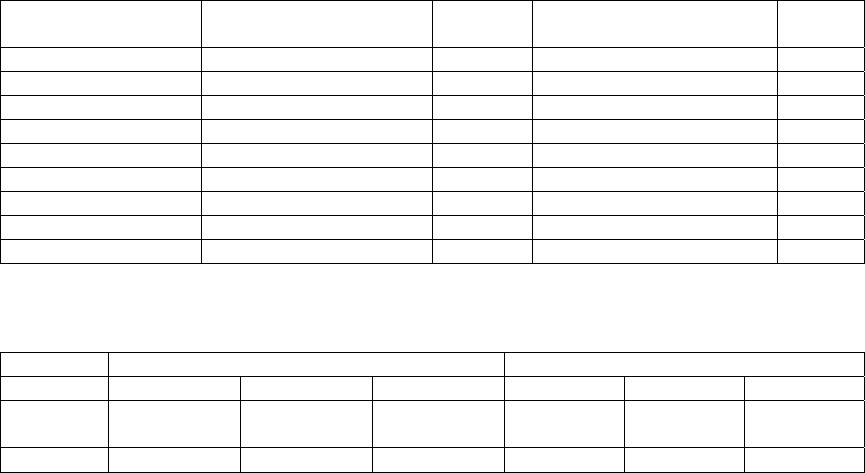 104Audy J.*, Audy K. and Haines T.Vol. 4, No. 2 recommendations for the ideal cut of brilliant cut diamonds taken from standard [6] to the experimental data of nominal values and the tolerance ranges for dimensional and angular features determined in this study are shown in Table 6. Table 5: Results of Statistical Tests conducted on 2 sets of diamonds at degree of freedom of 5 for each set and 95% and higher confidence level. Set 1 versus Se t 2VariancesPooled Value Means Grand Mean Girdle Diameter [mm]FRatio (1.17) < FStat (5.05)marginalTTest (0.37) < TStat (2.228)2.50 Table [mm]FRatio (3.23) < FStat (5 .05)marginalTTest (0.17) < TStat (2.228)1.40 Total Height [mm]FRatio (1.54) < FStat (5.05)marginalTTest (0.725) < TStat (2.228)1.39 Crown [mm]FRatio (1.49) < FStat (5.05)marginalTTest (0.415) < TStat (2.228)0.34 Pavilion Depth [mm]FRatio (1.71) < FStat (5.05)marginalTTest (1.082) < TStat (2.228)1.04 Crown Angle [deg]F Ratio (1.40) < FStat (5.05)2.12TTest (0.46) < TStat (2.228)31.83 Pavilion Angle [deg]FRatio (1.83) < FStat (5.05)0.28TTest (1.097) < TStat (2.228)39.86 Culet angle [deg]FRatio (1.85) < FStat (5 .0 5)1.1TTest (1.092) < TStat (2.228)100.4 Carat Weight [ d eg]FRatio (1.08) < FStat (5.0 5)marginalTTest (1.092) < TStat (0.403)0.05 Table 6: Comparison of measured an d reported da ta associated with dimensional features of brilliant type cut diamonds.Dimensional Features [%]Angular Features [deg] TableCrownPavilionCrown PavilionCulet Experime ntal values55.9%±1.2% 13.7%±1.4% 41.7%±1.4% 31.8°±2.2°39.8°±0.55°100.4°±1.8° Source [6]55%±2% 15.4%±0.5% ~43% 34.5°±2.5°~43 ~98.5° From Table 6 it is evident that the measured data matched favourably with reported data that were adopted from specifications set by source [6]. For example, the measured values of 55.9%±1.2% for the table dimension allowed the largest size to be 57.1% and the lowest size to be 54.7% while source [6] recommended 57% and 53%. For the crown, the measured nominal value of 13.7% was lower and its tolerance range of ±1.4% was higher than those of 15.5%±0.5% from source [6]. It is believed that this could have been caused by error source, e*, as it was not possible to measure girdle width. The measured dimensional values for the pavilion were 41.7%±1.4% suggesting the largest size to be 43.1% and the smallest size 40.3%. This is in agreement with source [6] which recommends the nominal value for that dimensional feature to be ~43%. The measured value of crown angle was 31.8°±2.2°. This means that the largest angular limit is 34° and the lowest angular limit is 29.6°. It is partially in agreement with source [6] which recommends 37° for the highest allowed angular limit and 32° for the lowest. Again the experimental lowest angular limit of 29.6° was slightly lower, which could have probably been caused by e* mentioned earlier. The as measured value of 39.8°±0.55° for the pavilion angle suggested the lower and higher angular limits to be 39.25° and 40.35°, respectively, which was very close to the value of ~43°±balance from source [6]. Finally the as measured culet angle values were 100.4°±1.8° , for a highest angular limit of 102.2° and the lowest angular limit of 98.6° which was close to that of 98.5° recommended by source [6].  Vol. 4, No. 2. Analysis Of Gem-Quality And Experimental Estimation Of Toleration 105 Ranges In Geometrical Features Of Brilliant Type Cut Diamonds From the above analysis it is evident that the 12 commercial - brilliant type cut - diamonds fit into the ideal cut represented by dimensional features recommended by a world-wide leader [6] in the diamond trade. Consequently, any combination of six stones in two pairs can be used, for example, when making a pair of earrings. Finally it should be mentioned that nowadays there are modern devices which are used for precise measurements of diamonds eg scanners for polished diamonds. However such technique is not always available to jewellers and dealers with diamonds. Therefore, the measuring and statistical approach proposed in this paper is expected to provide a sort of information that may be used for evaluation of geometrical features of brilliant type cut diamonds and / or to assist in the selection of geometrically similar diamonds. CONCLUSIONS The most important conclusions that can be drawn from this study are summarized as follows: The variances (scatter) in dimensional features and carat weight for two sets of brilliant type cut diamonds were examined by F-test and were found to be homogeneous at 95% and higher confidence levels. The mean values of each dimensional feature between two sets of diamonds were examined by t-test and were found to be equal at 95% and higher confidence levels, which allowed using the common grand mean value for each dimensional and angular feature. No qualitative or quantitative differences in ‘as measured’ geometry and carat weight of brilliant type cut diamonds have been found between two sets consisting each of six commercial diamonds. This indicated very high quality within the sets and between the sets. Comparison of results data with nominal and tolerance ranges recommended for ideal brilliant type cut diamonds showed substantial agreement. This indicated the very high quality of the investigated diamonds and highlighted the need for selection of well characterized brilliant type cut diamonds if one is going to use them for top range jewelry making. REFERENCES 1.Callister W.D.Jr.: “Fundamentals of Materials Science and Engineering: An Integrated Approach”, 2nd Edition, John Wiley & Sons, Inc., ISBN 0-471-47014-7, USA, 2005, p. 219 2.Funk and Wagnalls: “Encyclopedia”, 1973, Library of Congress Catalog Card Number 72-170933, USA, Volume 7, p. 462.  106Audy J.*, Audy K. and Haines T.Vol. 4, No. 2 3.Snell F.D. and Ettre L.S.: “Encyclopedia of Industrial Chemical Analysis”, Volume 11, John Willey and Sons Inc., Catalogue Card Number 65-27477, USA, pp.462 to 474. 4.Collins A.T.: “Improving the Colour of Gem-Quality Diamonds by High Pressure, High Temperature Annealing”, Materials Today, Elsevier, ISSN: 1396-7021, Vol.3 Issue 3, 2000, pp. 3 to 6. 5.National Geographic, “Diamonds, The Real Story”, Vol. 201. No. 3, March 2002 6.Lazare Diamonds The Ideal Cut, Larry Jewelry, Singapore, Paragon Ngee Ann City Tower Raffles City Shopping Centre, tel: (65) 732 3222, or 235 5848, or 336 9648 7Diamond Criteria, Australian Standard Brochure ACKNOWLEDGEMENT The authors would like to acknowledge the provision of photographic camera, advice and help from Mr. Peter Griffin from Central Photographic associated with taking the photograph of brilliant type cut diamonds shown in Figure 8. |