Paper Menu >>
Journal Menu >>
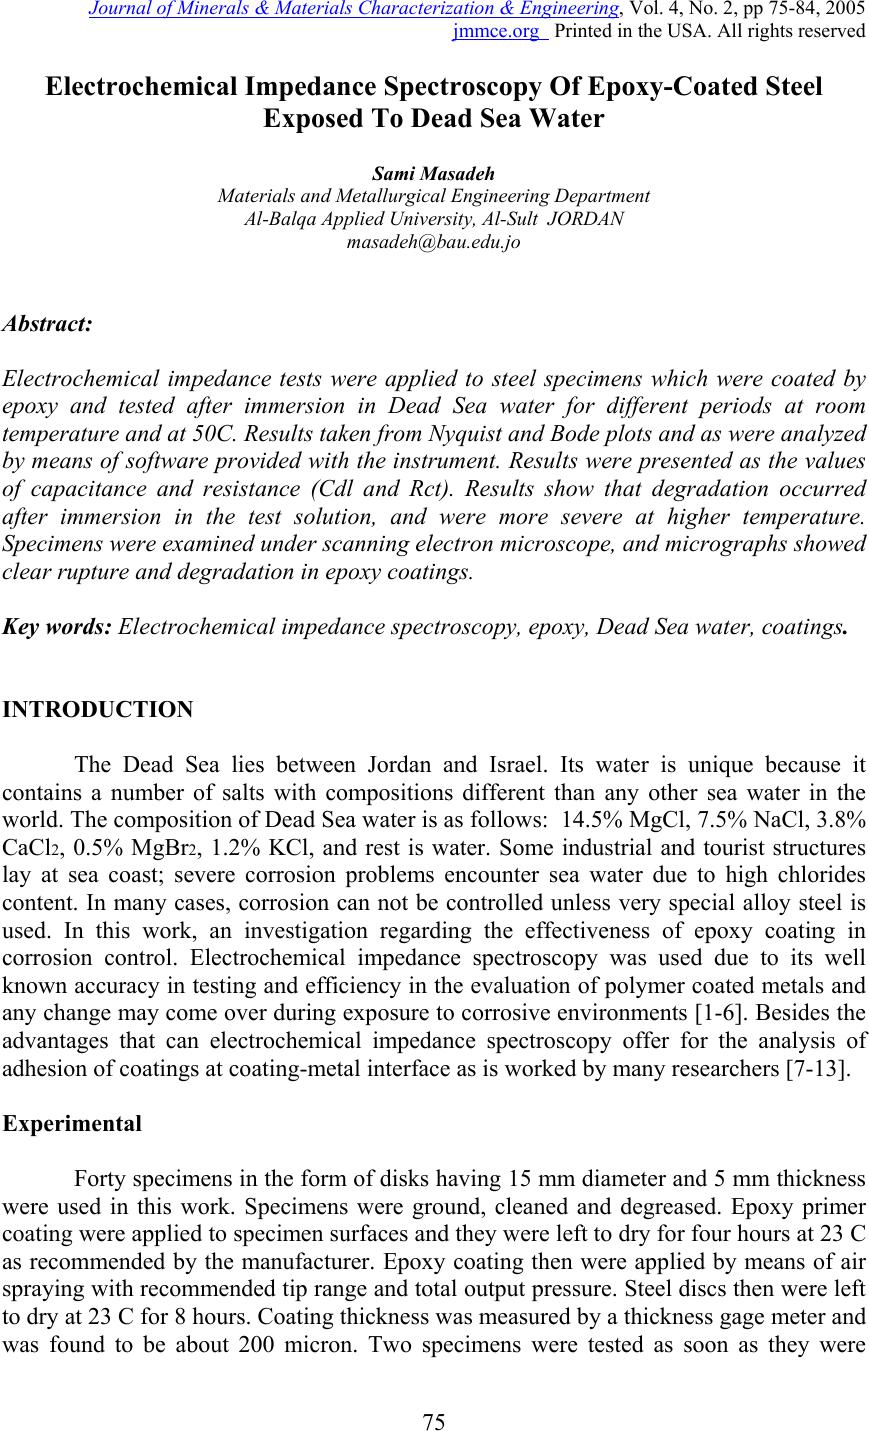 Journal of Minerals & Materials Characterization & Engineering, Vol. 4, No. 2, pp 75-84, 2005 jmmce.org Printed in the USA. All rights reserved 75 Electrochemical Impedance Spectroscopy Of Epoxy-Coated Steel Exposed To Dead Sea Water Sami Masadeh Materials and Metallurgical Engineering Department Al-Balqa Applied University, Al-Sult JORDAN masadeh@bau.edu.jo Abstract: Electrochemical impedance tests were applied to steel specimens which were coated by epoxy and tested after immersion in Dead Sea water for different periods at room temperature and at 50C. Results taken from Nyquist and Bode plots and as were analyzed by means of software provided with the instrument. Results were presented as the values of capacitance and resistance (Cdl and Rct). Results show that degradation occurred after immersion in the test solution, and were more severe at higher temperature. Specimens were examined under scanning electron microscope, and micrographs showed clear rupture and degradation in epoxy coatings. Key words: Electrochemical impedance spectroscopy, epoxy, Dead Sea water, coatings. INTRODUCTION The Dead Sea lies between Jordan and Israel. Its water is unique because it contains a number of salts with compositions different than any other sea water in the world. The composition of Dead Sea water is as follows: 14.5% MgCl, 7.5% NaCl, 3.8% CaCl2, 0.5% MgBr2, 1.2% KCl, and rest is water. Some industrial and tourist structures lay at sea coast; severe corrosion problems encounter sea water due to high chlorides content. In many cases, corrosion can not be controlled unless very special alloy steel is used. In this work, an investigation regarding the effectiveness of epoxy coating in corrosion control. Electrochemical impedance spectroscopy was used due to its well known accuracy in testing and efficiency in the evaluation of polymer coated metals and any change may come over during exposure to corrosive environments [1-6]. Besides the advantages that can electrochemical impedance spectroscopy offer for the analysis of adhesion of coatings at coating-metal interface as is worked by many researchers [7-13]. Experimental Forty specimens in the form of disks having 15 mm diameter and 5 mm thickness were used in this work. Specimens were ground, cleaned and degreased. Epoxy primer coating were applied to specimen surfaces and they were left to dry for four hours at 23 C as recommended by the manufacturer. Epoxy coating then were applied by means of air spraying with recommended tip range and total output pressure. Steel discs then were left to dry at 23 C for 8 hours. Coating thickness was measured by a thickness gage meter and was found to be about 200 micron. Two specimens were tested as soon as they were 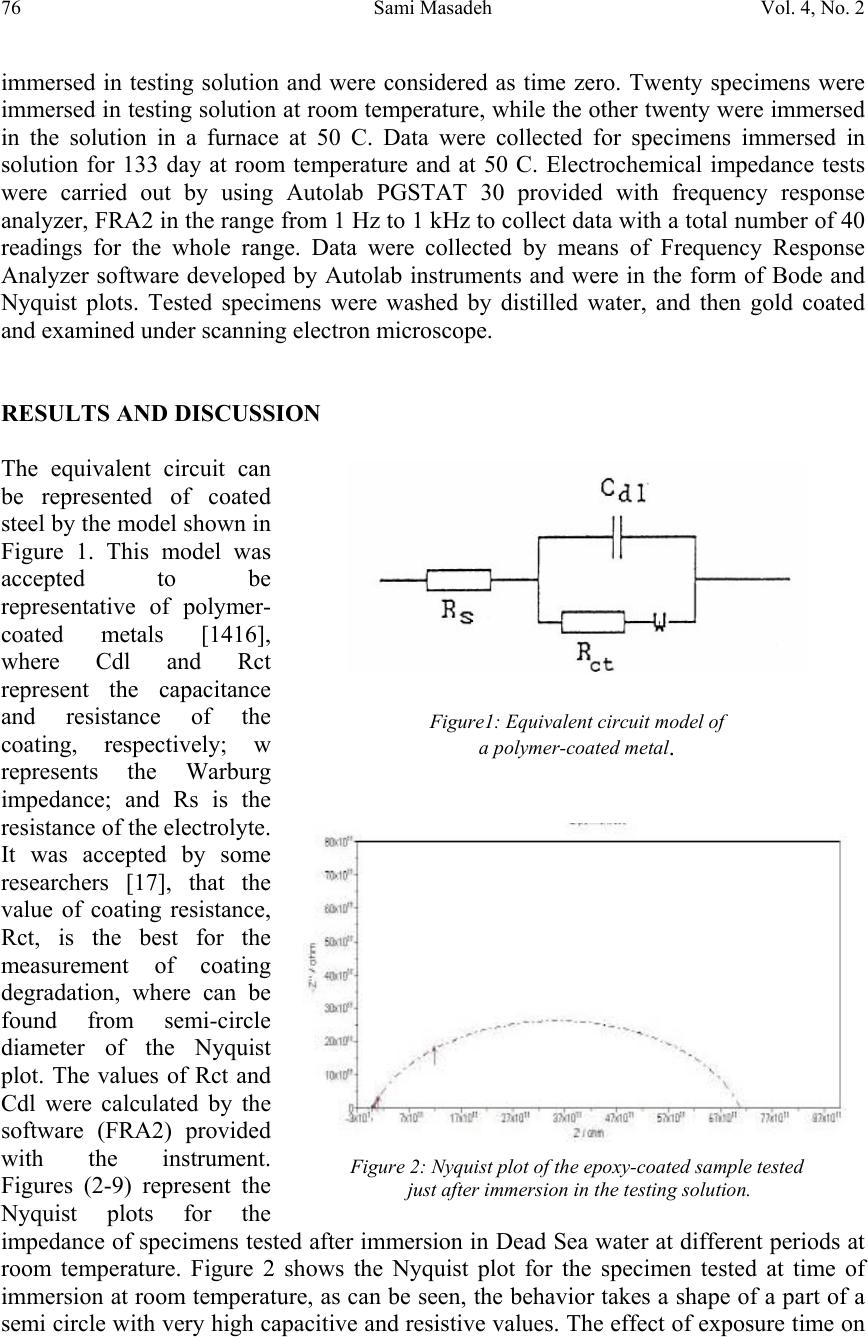 76Sami MasadehVol. 4, No. 2 immersed in testing solution and were considered as time zero. Twenty specimens were immersed in testing solution at room temperature, while the other twenty were immersed in the solution in a furnace at 50 C. Data were collected for specimens immersed in solution for 133 day at room temperature and at 50 C. Electrochemical impedance tests were carried out by using Autolab PGSTAT 30 provided with frequency response analyzer, FRA2 in the range from 1 Hz to 1 kHz to collect data with a total number of 40 readings for the whole range. Data were collected by means of Frequency Response Analyzer software developed by Autolab instruments and were in the form of Bode and Nyquist plots. Tested specimens were washed by distilled water, and then gold coated and examined under scanning electron microscope. RESULTS AND DISCUSSION The equivalent circuit can be represented of coated steel by the model shown in Figure 1. This model was accepted to be representative of polymer- coated metals [1416], where Cdl and Rct represent the capacitance and resistance of the coating, respectively; w represents the Warburg impedance; and Rs is the resistance of the electrolyte. It was accepted by some researchers [17], that the value of coating resistance, Rct, is the best for the measurement of coating degradation, where can be found from semi-circle diameter of the Nyquist plot. The values of Rct and Cdl were calculated by the software (FRA2) provided with the instrument. Figures (2-9) represent the Nyquist plots for the impedance of specimens tested after immersion in Dead Sea water at different periods at room temperature. Figure 2 shows the Nyquist plot for the specimen tested at time of immersion at room temperature, as can be seen, the behavior takes a shape of a part of a semi circle with very high capacitive and resistive values. The effect of exposure time on Figure1: Equivalent circuit model of a polymer-coated metal . Figure 2: Nyquist plot of the epoxy-coated sample tested just after immersion in the testing solution. 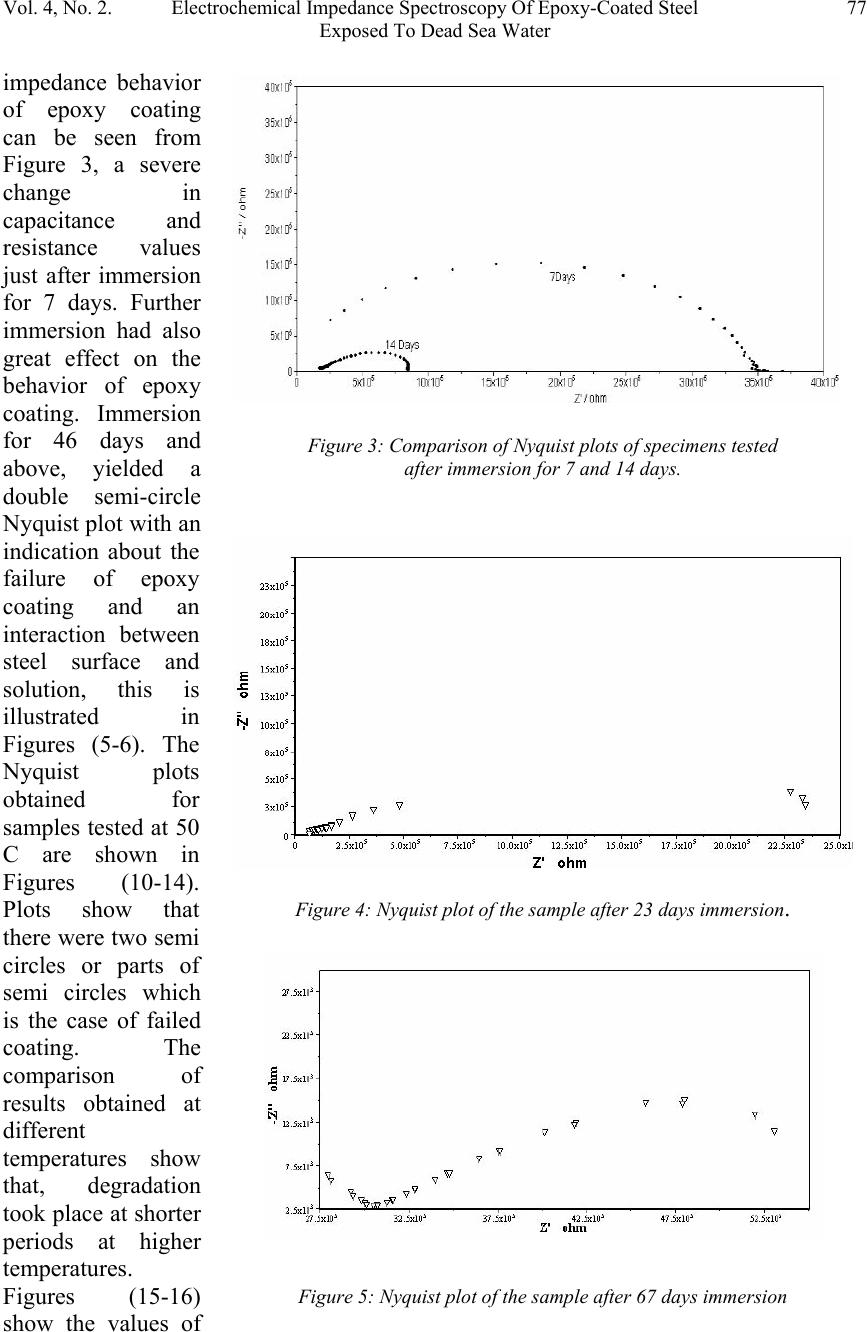 Vol. 4, No. 2. Electrochemical Impedance Spectroscopy Of Epoxy-Coated Steel77 Exposed To Dead Sea Water Figure 4: Nyquist plot of the sample after 23 days immersion. impedance behavior of epoxy coating can be seen from Figure 3, a severe change in capacitance and resistance values just after immersion for 7 days. Further immersion had also great effect on the behavior of epoxy coating. Immersion for 46 days and above, yielded a double semi-circle Nyquist plot with an indication about the failure of epoxy coating and an interaction between steel surface and solution, this is illustrated in Figures (5-6). The Nyquist plots obtained for samples tested at 50 C are shown in Figures (10-14). Plots show that there were two semi circles or parts of semi circles which is the case of failed coating. The comparison of results obtained at different temperatures show that, degradation took place at shorter periods at higher temperatures. Figures (15-16) show the values of Figure 3: Comparison of Nyquist plots of specimens tested after immersion for 7 and 14 days. Figure 5: Nyquist plot of the sample after 67 days immersion  78Sami MasadehVol. 4, No. 2 Figure 6: Nyquist plot of the sample after 90 days immersion Figure 7: Nyquist plot of the sample after 97 days immersion Figure 8: Nyquist plot of the sample after 119 days immersion Cdl and Rct as a function of immersion time respectively at room temperature and at 50 C. The capacitance values of the samples were very low, these values increased gradually as they were immersed in the solution at both temperatures. The dependence of water uptake by coatings on Cdl was studied by many authors (18-19). In case of epoxy coatings, the value of Cdl increases after immersion in the electrolyte, reaching a constant value after some hours (20). The plateau period of Cdl indicates the beginning of detachment of the coating from the substrate because of adhesion loss (20). In the case of our samples, a high value of Cdl were obtained of epoxy coating iust after immersion in Dead sea water, the gradual increase in the value of Cdl can be due to solution penetration between the coating and steel surface. This penetration can be through breakdown sites of the coating. The high viscosity of Dead Sea water 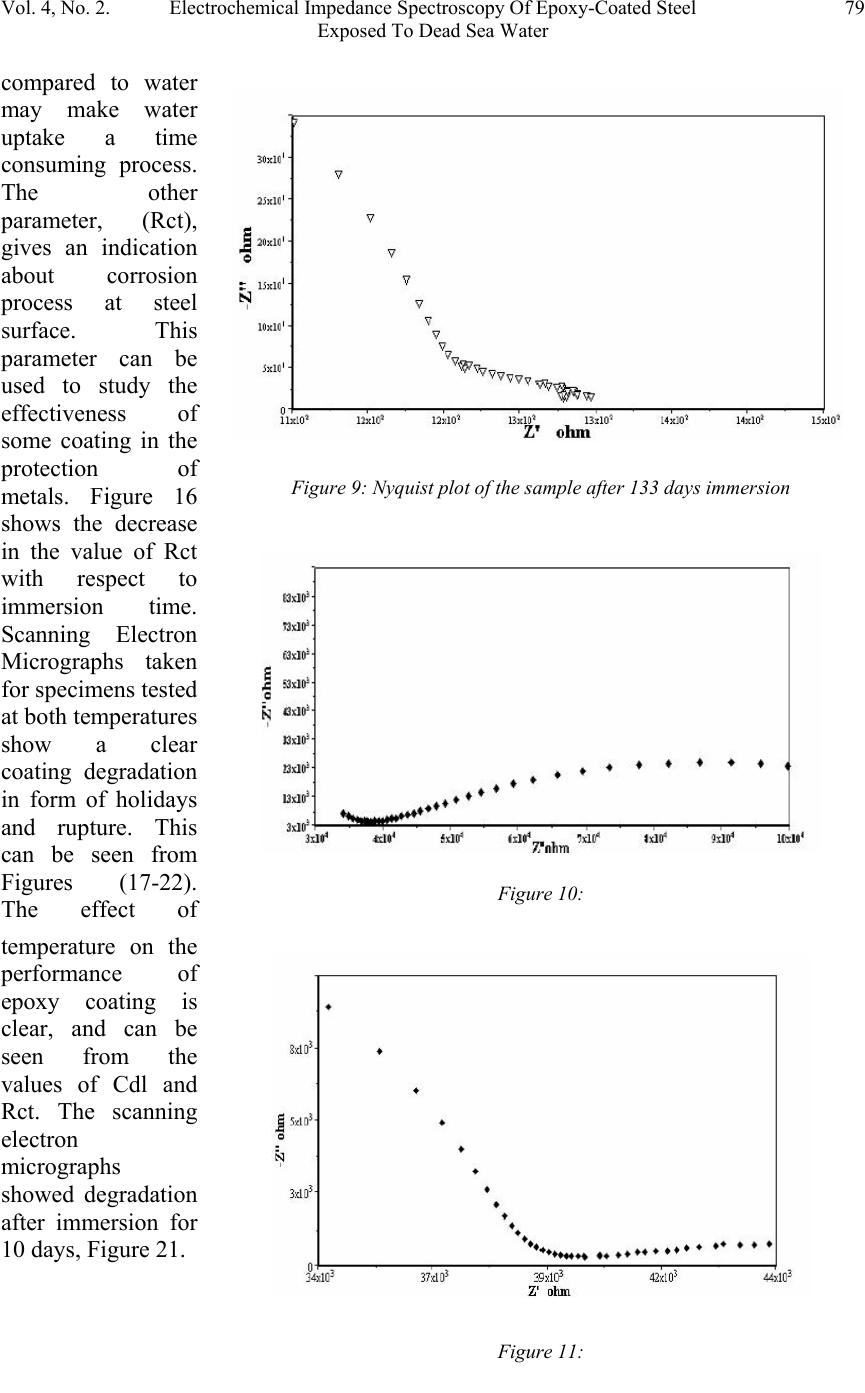 Vol. 4, No. 2. Electrochemical Impedance Spectroscopy Of Epoxy-Coated Steel79 Exposed To Dead Sea Water Figure 9: Nyquist plot of the sample after 133 days immersion Figure 10: Figure 11: compared to water may make water uptake a time consuming process. The other parameter, (Rct), gives an indication about corrosion process at steel surface. This parameter can be used to study the effectiveness of some coating in the protection of metals. Figure 16 shows the decrease in the value of Rct with respect to immersion time. Scanning Electron Micrographs taken for specimens tested at both temperatures show a clear coating degradation in form of holidays and rupture. This can be seen from Figures (17-22). The effect of temperature on the performance of epoxy coating is clear, and can be seen from the values of Cdl and Rct. The scanning electron micrographs showed degradation after immersion for 10 days, Figure 21.  80Sami MasadehVol. 4, No. 2 Figure 13: Figure 14: Figure 12:  Vol. 4, No. 2. Electrochemical Impedance Spectroscopy Of Epoxy-Coated Steel81 Exposed To Dead Sea Water Figure 15: The value of Cdl Versus Immersion time two different temperatures Figure 16: Rct as a function of time and at different temperatures Figure 17:  82Sami MasadehVol. 4, No. 2 Figure 18: Figures (19-20): Two Scanning electron micrographs of epoxy coating after immersion for 126 days in Dead Sea water at room temperature . Figure 21: Scanning electron micrograph of epoxy coating after immersion for 10 days in Dead Sea water at 50 C 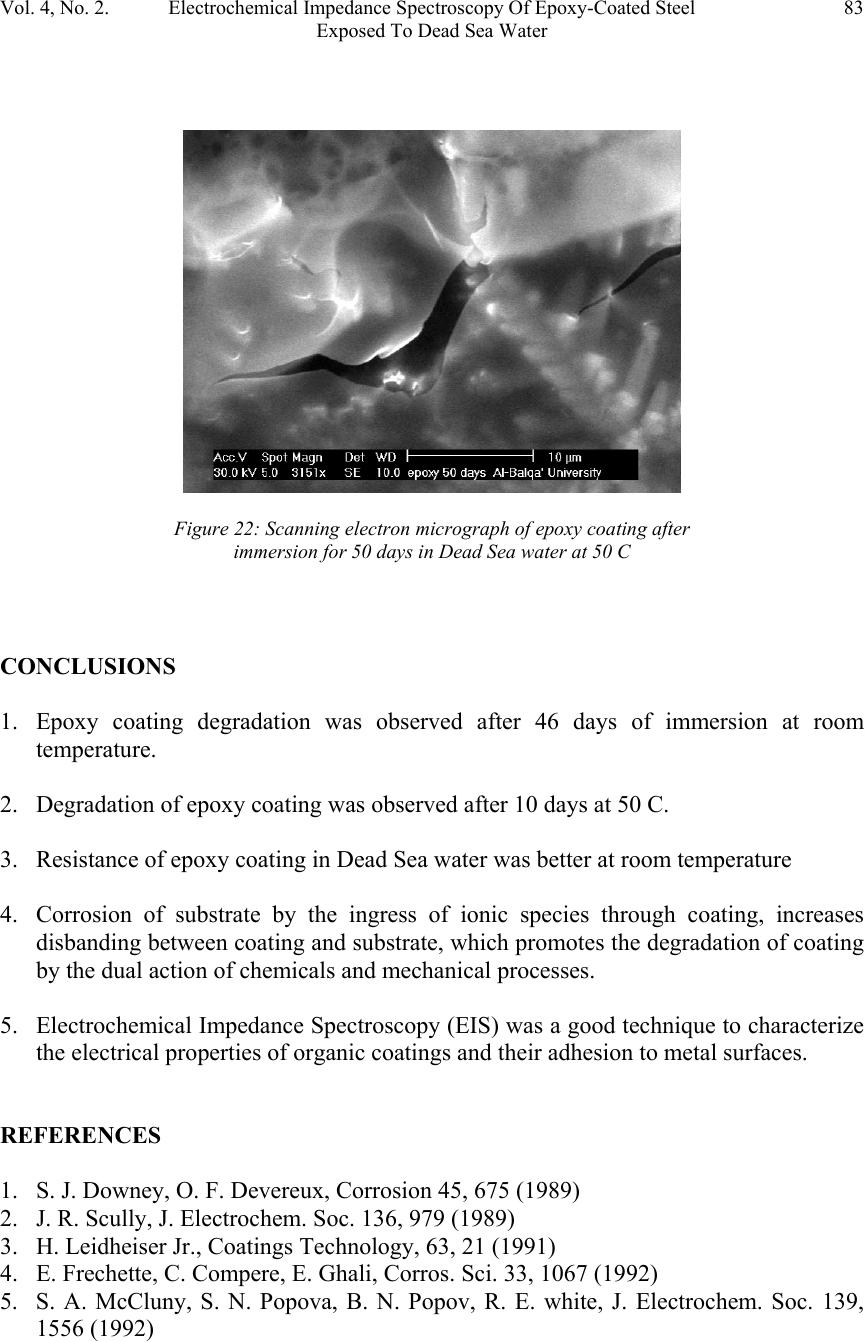 Vol. 4, No. 2. Electrochemical Impedance Spectroscopy Of Epoxy-Coated Steel83 Exposed To Dead Sea Water CONCLUSIONS 1. Epoxy coating degradation was observed after 46 days of immersion at room temperature. 2. Degradation of epoxy coating was observed after 10 days at 50 C. 3. Resistance of epoxy coating in Dead Sea water was better at room temperature 4. Corrosion of substrate by the ingress of ionic species through coating, increases disbanding between coating and substrate, which promotes the degradation of coating by the dual action of chemicals and mechanical processes. 5. Electrochemical Impedance Spectroscopy (EIS) was a good technique to characterize the electrical properties of organic coatings and their adhesion to metal surfaces. REFERENCES 1. S. J. Downey, O. F. Devereux, Corrosion 45, 675 (1989) 2. J. R. Scully, J. Electrochem. Soc. 136, 979 (1989) 3. H. Leidheiser Jr., Coatings Technology, 63, 21 (1991) 4. E. Frechette, C. Compere, E. Ghali, Corros. Sci. 33, 1067 (1992) 5. S. A. McCluny, S. N. Popova, B. N. Popov, R. E. white, J. Electrochem. Soc. 139, 1556 (1992) Figure 22: Scanning electron micrograph of epoxy coating after immersion f or 50 da y s in Dead Sea water at 50 C  84Sami MasadehVol. 4, No. 2 6. P. R. Roberge, E. Halliop, V. S. Sastri, Corrosion, 48, 447 (1992) 7. J.R. Scully and S.T. Hensley, Corrosion, 50, 705 (1994) 8. D. F. Wei, I. Chatterjee, and D. A. Jones, Corrosion, 51, 97 (1994) 9. F. Deflorian and L. Fedrizzi, J. Adhesion Sci. Technol , 13, 629 (1999) 10. C. H. Tsai and F. Mansfield, Corrosion Sci., 726 (1993) 11. F Mansfield, M. W. Kendig and S. Tsai, Corrosion, 38, 478 (1982) 12. J. E. G. Gonzalez and J. C. Mirza Rosca, J. Adhesion Sci. Technolo.,13, 379 (1999) 13. G. Walter, Corrosion Sci., 32, 1041 (1991) 14. L. Beaunier, I. Epelboin, J. C. Lestrade, H. Takenouti, Surf. Technol. 4, 237(1976) 15. F. MAnsfeld, M. W. Kendig, S. Tsai, Corrosion, 38, 478(1982) 16. G. W. Walter, Corros. Sci. 26, 681 91986) 17. D. F. Wei, I. Chatterjee, D. A. Jones, Corrosion, 51, 97(1995) 18. E. M. Geenen, E. P. M. van Westing, J. H. W. de Wit, Porg. Org. Coat. 18, 295(1990) 19. G. W. Walter, Corros. Sci. 32, 1041(1991) 20. E. P. M. van Westing, G. M. Ferrari, E. M. Geenen, J. H. W. de Wit, Prog. Org. Coat. 23, 83(1993) |