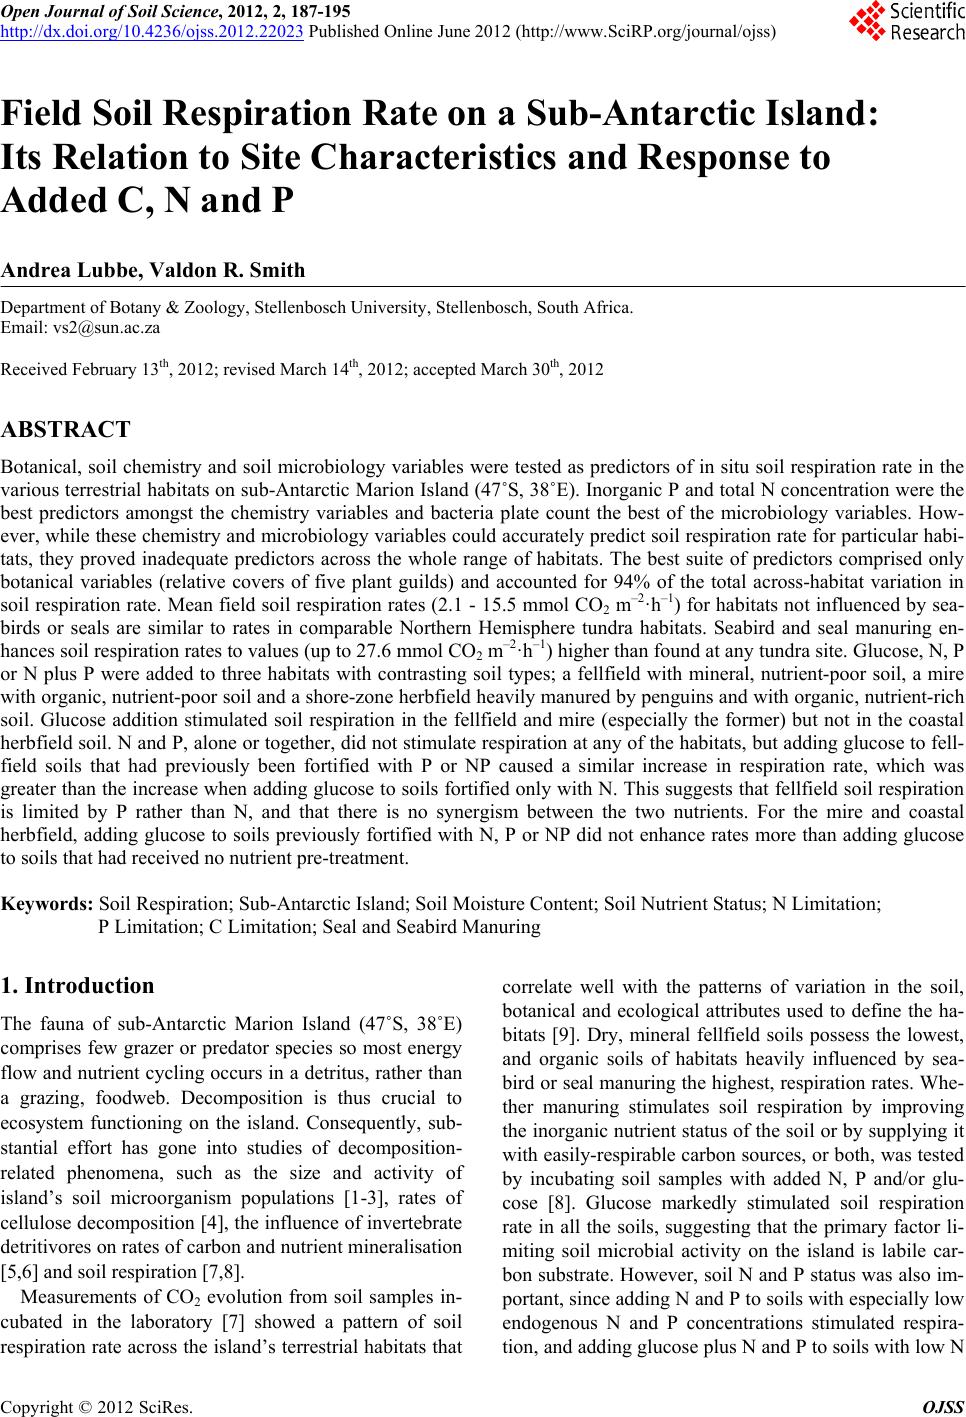
 Open Journal of Soil Science, 2012, 2, 187-195 http://dx.doi.org/10.4236/ojss.2012.22023 Published Online June 2012 (http://www.SciRP.org/journal/ojss) 187 Field Soil Respiration Rate on a Sub-Antarctic Island: Its Relation to Site Characteristics and Response to Added C, N and P Andrea Lubbe, Valdon R. Smith Department of Botany & Zoology, Stellenbosch University, Stellenbosch, South Africa. Email: vs2@sun.ac.za Received February 13th, 2012; revised March 14th, 2012; accepted March 30th, 2012 ABSTRACT Botanical, soil chemistry and soil microbiology variables were tested as predictors of in situ soil respiration rate in the various terrestrial habitats on sub-Antarctic Marion Island (47˚S, 38˚E). Inorganic P and total N concentration were the best predictors amongst the chemistry variables and bacteria plate count the best of the microbiology variables. How- ever, while these chemistry and microbiology variables could accurately predict soil respiration rate for particular habi- tats, they proved inadequate predictors across the whole range of habitats. The best suite of predictors comprised only botanical variables (relative covers of five plant guilds) and accounted for 94% of the total across-habitat variation in soil respiration rate. Mean field soil respiration rates (2.1 - 15.5 mmol CO2 m–2·h–1) for habitats not influenced by sea- birds or seals are similar to rates in comparable Northern Hemisphere tundra habitats. Seabird and seal manuring en- hances soil respiration rates to values (up to 27.6 mmol CO2 m–2·h–1) higher than found at any tundra site. Glucose, N, P or N plus P were added to three habitats with contrasting soil types; a fellfield with mineral, nutrient-poor soil, a mire with organic, nutrient-poor soil and a shore-zone herbfield heavily manured by penguins and with organic, nutrient-rich soil. Glucose addition stimulated soil respiration in the fellfield and mire (especially the former) but not in the coastal herbfield soil. N and P, alone or together, did not stimulate respiration at any of the habitats, but adding glucose to fell- field soils that had previously been fortified with P or NP caused a similar increase in respiration rate, which was greater than the increase when adding glucose to soils fortified only with N. This suggests that fellfield soil respiration is limited by P rather than N, and that there is no synergism between the two nutrients. For the mire and coastal herbfield, adding glucose to soils previously fortified with N, P or NP did not enhance rates more than adding glucose to soils that had received no nutrient pre-treatment. Keywords: Soil Respiration; Sub-Antarctic Island; Soil Moisture Content; Soil Nutrient Status; N Limitation; P Limitation; C Limitation; Seal and Seabird Manuring 1. Introduction The fauna of sub-Antarctic Marion Island (47˚S, 38˚E) comprises few grazer or predator species so most energy flow and nutrient cycling occurs in a detritus, rather than a grazing, foodweb. Decomposition is thus crucial to ecosystem functioning on the island. Consequently, sub- stantial effort has gone into studies of decomposition- related phenomena, such as the size and activity of island’s soil microorganism populations [1-3], rates of cellulose decomposition [4], the influence of invertebrate detritivores on rates of carbon and nutrient mineralisation [5,6] and soil respiration [7,8]. Measurements of CO2 evolution from soil samples in- cubated in the laboratory [7] showed a pattern of soil respiration rate across the island’s terrestrial habitats that correlate well with the patterns of variation in the soil, botanical and ecological attributes used to define the ha- bitats [9]. Dry, mineral fellfield soils possess the lowest, and organic soils of habitats heavily influenced by sea- bird or seal manuring the highest, respiration rates. Whe- ther manuring stimulates soil respiration by improving the inorganic nutrient status of the soil or by supplying it with easily-respirable carbon sources, or both, was tested by incubating soil samples with added N, P and/or glu- cose [8]. Glucose markedly stimulated soil respiration rate in all the soils, suggesting that the primary factor li- miting soil microbial activity on the island is labile car- bon substrate. However, soil N and P status was also im- portant, since adding N and P to soils with especially low endogenous N and P concentrations stimulated respira- tion, and adding glucose plus N and P to soils with low N Copyright © 2012 SciRes. OJSS  Field Soil Respiration Rate on a Sub-Antarctic Island: Its Relation to Site Characteristics and Response to Added C, N and P 188 and P status resulted in a significantly greater stimulation of respiration rate than adding glucose alone. For all soil types, respiration rate increased with moisture content up to full moisture holding capacity [8]. All the above findings were from laboratory incuba- tions and thus subject to the usual limitations concerning conclusions based on soil respiration measurements made on excised, stored and homogenised soil samples. Here, we report the across-habitat variation in field-mea- sured rates of soil respiration and, for three habitats with different nutrient statuses, how in situ soil respiration responds to N, P and glucose addition. A goal of the re- search program at Marion Island is to model carbon ex- change for the various terrestrial habitats and for the is- land as a whole. This requires an ability to predict in situ soil respiration rate from the abiotic and biotic factors that affect it. We thus relate the field-measured soil re- spiration rates to site factors such as botanical compo- sition, soil chemistry and soil microorganism counts, to see whether any of these factors, or combinations of them, can successfully predict soil respiration rate. 2. Sites, Materials and Methods 2.1. Field Measurements of Soil Respiration at the Different Habitats Sampling was carried out over about 100 km2 of the is- land’s western, northern and eastern lowland plains, at 5 to 11 representative examples (sites) of 19 of the island’s 23 habitats. A detailed description of the vegetation and soils of the habitats may be found in [9] and a synopsis of their main characteristics is given in Table 1. At each site, four areas large enough to accommodate a SRC-1 soil respiration chamber (PP Systems, U.K.) were cleared by hand-plucking the vegetation. The wet, peaty soils resulted in most roots coming out attached to the above- ground shoots. Conspicuous remaining roots (mostly these were ones attached to surrounding vegetation) were excised with a scalpel blade. Root respiration would have contributed to the measured CO2 evolution rates at all the sites (except possibly the fellfield ones which had a very sparse vegetation cover) but, with the exception dis- cussed later, it was likely a minor component. About 30 minutes after clearing the vegetation, the respiration chamber, connected to an EGM-2 CO2 analyzer (PP Sy- stems UK), was placed on each cleared space, pushed about 1 cm into the soil, and the increase in CO2 concen- tration in the chamber monitored for 2 minutes. Soil re- spiration rate was calculated from the increase in con- centration, the system volume and the area of soil en- closed by the chamber. The mean value for the four cleared areas was taken as the soil respiration rate for the particular site. Soil temperature of each cleared area was also measured (chromel-alumel thermocouple; values were from 3.4˚C to 12.7˚C, 90% were between 6˚C and 11˚C) and the respiration rate converted to a rate at 10˚C using the average Q10 of 2 found [7] for soil respiration at the island. 2.2. Prediction of Soil Respiration Rate from Edaphic and Botanical Variables Stepwise multiple regression of the habitat-mean field soil respiration rates in Table 1 against the habitat-means of a set of 23 soil chemistry variables, 17 botanical vari- ables (relative covers of plant guilds, total vegetation cover), two topographical variables (altitude and distance from the shore), and three soil microorganism variables (total and plate counts of bacteria and plate counts of fungi) was used to identify a set of predictors of soil res- piration rate. The habitat-means of these variables are given in [7]. The plant guilds (based mainly on plant growth form but also on taxonomic and ecological attri- butes) are described in [9]. 2.3. Assessment of the Effect of Added Nutrients and Glucose on Soil Respiration Rate Three sites representing contrasting habitats were se- lected; a Mesic fellfield (inland/dry/mineral, low nutrient status soil/low soil respiration rate), a Mesic mire (in- land/wet/organic, low nutrient status soil/medium respi- ration rate), and a Cotula herbfield (coastal/wet/organic, high nutrient status soil/high respiration rate). At each site on day 1, 40 areas just large enough to accommodate a SRC-1 chamber were cleared of vegetation. Soil respi- ration rate was measured every day on each cleared area. After the measurement on day 5, the cleared areas were randomly assigned into 5 groups. One group was watered with a solution of NH4NO 3 (200 μg N per cm2 cleared surface), one with a solution of KH2PO4 (200 μg·P·cm–2), one with NH4NO3 and KH2PO4 (200 μg·N & 200 μg·P·cm–2), one with glucose (5 mg·G·cm–2) and the re- maining group served as a control that received only wa- ter. A total of 25 ml solution was added to each cleared area. Respiration rates were monitored daily. After the measurement on day 8, all the groups were watered with glucose solution (5 mg·G·cm–2) and respiration rate mo- nitored for 3 more days (2 days only at the Cot ula her- bfield). All rates were corrected to a 10˚C value using a Q10 of 2. The significance of the differences in respire- tion rate before and after nutrient additions were assessed by Analysis of Variance and Tukey’s Honest Signifi- cance Difference Tests). 2.4. Soil Moisture and Chemical Analysis Four 5 cm deep soil cores were taken from each of the Copyright © 2012 SciRes. OJSS  Field Soil Respiration Rate on a Sub-Antarctic Island: Its Relation to Site Characteristics and Response to Added C, N and P Copyright © 2012 SciRes. OJSS 189 Table 1. Synopsis of the main features of the terrestrial habitats on Marion Island and their mean (±standard error) soil res- piration rate. In the first column, an asterisc* indicates that the habitat is heavily influenced by seabird and/or seal manuring and the number in brackets shows at how many examples of the particular habitat respiration measurements were taken. The habitats are assigned to a high (H), medium (M) or low (L) soil respiration group based on Anova and the Tukeys honest significant difference test. Tot. (cation) = total concentration of the particular cation in the soil; exch. (cation). = exchangeable concentration; sol. (cation) = soil solution concentration. Habitat General Dominant plant species Soil Chemical characteristic of top soil layer Soil respiration rate (mmol·CO2·m–2·h–1)Group 1.1 Coastal herbfield (9) Shore-zone Crassula moschata, sometimes Cotula plumosa Fibrous peat Very high tot. Na, exch. Na & Mg, sol. Na & Mg 5.0 ± 0.6 M 1.2 Coastal fellfield (6) Shore-zone, exposed C. moschata, Azorella selago Fibrous peat, volcanic ash As 1.1 7.1 ± 2.1 M 2.1 Xeric fellfield (8) Exposed; Sparse vegetation; Generally > 300 m altitude A. selago, cushion and ball-forming mosses, lichens Skeletal, Volcanic ash and rock Mineral, basic, high bulk density, high tot. Ca and Mg, low organic C & N, dry 2.1 ± 0.3 L 2.2 Mesic fellfield (11) Exposed; Sparse vegetation; Generally < 200 m altitude A. selago, often Blechnum enna-marina, Agrostis magellanica, cushion and ball-forming mosses, lichens Volcanic ash and rock As 2.1 but slightly more organic and moist 2.4 ± 0.4 L 3.1 Open fernbrake (7) Succession between 2.2 and 3.2 A. selago, B. penna-marina Ag. magellanica, Acaena magellanica Organic surface layer, below that similar to 2.2 Considerably more organic and moist than 2.2 6.3 ± 1.0 M 3.2 Closed fernbrake (7) Dominant habitat on slopes Continuous B. penna-marina carpet, occasional Ag. magellanica, Ac. magellanica Poa cookii Deep, well-developed horizons; Highly organic surface layer Moist, high organic C, high C.E.C., moderately high inorganic P 5.5 ± 0.5 M 3.3 Mesic fernbrake (5) Similar to 3.2 but on wetter, less-steep slopes Continuous B. penna-marina carpet; Ag. magellanica, Uncinia compacta, bryophyte species common Deep, poorer horizon differentiation than 3.2; Highly organic surface layer Wet, high organic C, high C.E.C., low inorganic P 8.0 ± 1.7 M 3.4 Dwarf shrub fernbrake (8) More sheltered and wet than 3.2 Ac. magellanica, B. penna-marina, mosses (especially Brachythecium sp.) Similar to 3.3 Similar to 3.3 7.1 ± 2.0 M 3.5 Slope drainage line and streambank (6) Drainage lines on slopes and on banks of streams Ac. magellanica, mosses (especially Brachythecium rutabulum and Sanionia uncinatus) Similar to 3.3 Higher pH, tot. & exch.Ca & Mg, lower organic C than other fernbrake habitats 15.5 ± 2.6 H 4.1 Coastal tussock grassland* (6) Coastal slopes heavily influenced by penguins, petrels, seals. P. cookii on low peat pedestals; frequent but low cover C. umosa, Callitriche antarctica, Montia fontana, Poa annua Compact fibrous peat, decomposing tussock bases Acid, organic, very high tot. N, inorganic N & P 7.7 ± 1.7 M 5.1 Cotula herbfield* (10) Most common coastal area habitat, heavily influenced by seabirds and seals C. plumosa, often with P. cookie co-dominant, other species infrequent Compact peat Very high tot. and inorganic N and P. High tot. Na, xch. Na & Mg, sol. Na & Mg 27.6 ± 2.9 H 5.2 Biotic mud* (8) In and around seal wallows, penguin rookeries, also sometimes around albatross nests C. antarctica, sometimes also M. fontana Eutrophic, very wet, generally anaerobic mud Highly organic; very high inorganic N & P 20.8 ± 2.2 H 5.3 Biotic lawn* (7) As 5.2 Poa annua dominant; P. cookii, C. plumosa common; sometimes C. antarctica and M. fontana Thin, well-drained fibrous peat underlayed by scoria; sometimes just scoria Less organic and lower inorganic N & P than 5.2; ut dryer and highe tot. Ca & Mg. 23.2 ± 3.6 H  Field Soil Respiration Rate on a Sub-Antarctic Island: Its Relation to Site Characteristics and Response to Added C, N and P 190 Continued 6.1 Dry mire (8) Transition between 6.2 and 3.3, or between 6.2 and 2.2 Ag. magellanica, U. compacta, B. penna-marina, bryophtes (mainly Racomitrium lanuginosum, Jamesoniella colorata, Ptychomnion ringianum) Dry oligotrophic peats Dryer, less organic, and higher tot. Ca & Mg and exch. Ca than other mire habitats 6.0 ± 0.8 M 6.2 Mesic mire (8) Boggy grassland vegetation Greater dominance of graminoids (Juncus scheuchzerioides, Ag. magellanica, U. compacta), lesser of bryophytes, compared with 6.3 Wet dystrophic peats, deeper than 6.1 Wetter, more organic than 6.1 5.3 ± 0.7 M 6.3 Wet mire (6) Bog Bryophytes overwhelmingly dominant Waterlogged peat, water table mostly at or above the surface Extremely wet, organic, inorganic N & P higher than 6.1 or 6.2 7.4 ± 1.7 M 6.4 Mire drainage line (11) Bog in water tracks Bryophytes overwhelmingly dominant More mineral than other mire habitats, large and rapid fluctuations moisture content Extremely low inorganic P; highest pH for mire habitats 5.6 ± 0.9 M 6.5 Biotic mire* (7) Bog influenced by manuring Clasmatocolea vermicularis dominant; Ag. magell an ic a and P. cookii common; M. Fontana frequent but low cover Eutrophic, very wet peat Highest inorganic N & P for mire habitats 17.0 ± 3.8 H 6.6 Saline mire (7) Bog influenced by salt-spray C. vermicularis dominant; C. moschata and Ag. magellanica common Very wet peat Highest tot., exch. And sol Na, exch. and sol. Mg of all habitats except 1.1 and 1.2, relatively high inorganic N & P 7.0 ± 1.2 M three sites where the nutrient addition experiments were carried out. Half of each core was weighed, dried at 105˚C for 48 hour and reweighed to assess moisture con- tent. The rest of the core was air dried and used to deter- mine total carbon and nitrogen (TruSpec CHN analyser, Leco Corporation, MI, USA) and total phosphorus (by dry-ashing a subsample, dissolving the ash in dilute HCl, and measuring the P concentration in the solution with a Vista ICP-Optical Emission Spectrometer (Varian Inc., CA, USA). 3. Results 3.1. Across-Habitat Variation in Soil Respiration Rate Mean field soil respiration rate varies by an order of magnitude across habitats (Table 1). Lowest values are for inland fellfields and highest are for habitats heavily manured by seabirds or seals. The various fernbrake and mire habitats (excluding biotic mire) all have quite simi- lar, moderately-low respiration rates. The Cotula herb- field showed the highest mean rate but root respiration might have contributed significantly since not all of the large, fleshy Cotula plumosa rhizomes could be removed without disturbing the soil to an unacceptable degree. However, laboratory measurements on soil samples from which all roots were removed showed Cotula herbfield soils to be very active, with the second highest mean in vitro respiration rate amongst the habitats [7]. Overall, the ranking of habitats on field respiration rate is similar to the ranking on laboratory measured rates. The only serious discrepancy is for the Slope drainage line habitat, which is in the upper part of the range of mean field res- piration rates but was found to be in the lower part of the range of laboratory respiration rates. The surface layer of slope drainage line soils is a deep loose mat of decom- posing litter, rather than soil proper. This layer would have contributed substantially to the field measurements whereas the laboratory measurements were made on the underlying soil. The Saline mire, Coastal herbfield and Coastal tussock grassland exhibit surprisingly low field soil respiration rates considering that all three habitats occur in the shore zone and are thus to some extent affected by seals and penguins (most stands of the last mentioned habitat are generally very heavily affected). Possibly, unfavourable soil moisture content is responsible. Mean rates for all the coastal habitats are plotted against soil moisture con- tent in Figure 1(a) and it is clear that the Coastal herb- field (1.1) and Tussock grassland (4.1) have suboptimal, Copyright © 2012 SciRes. OJSS 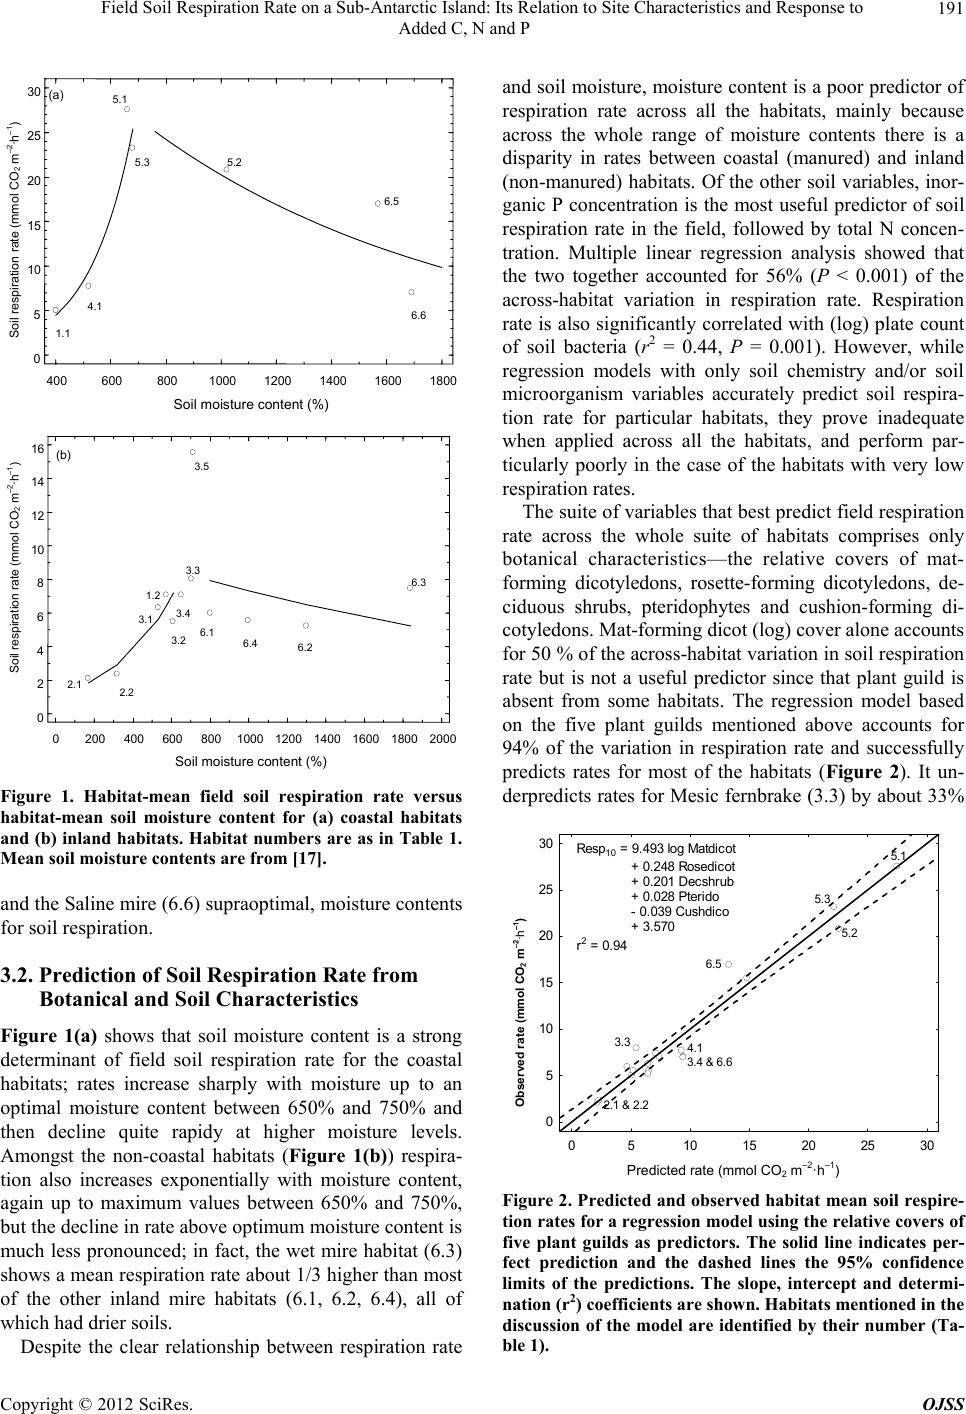 Field Soil Respiration Rate on a Sub-Antarctic Island: Its Relation to Site Characteristics and Response to Added C, N and P 191 400 600 8001000 1200 1400 1600 1800 Soil moisture content (%) 0 5 10 15 20 25 30 1.1 6.6 6.5 5.2 5.1 5.3 4.1 (a) Soil respiration rate (mmol CO 2 m –2 ·h –1 ) 0 200 400 600 800 1000 1200 1400 1600 1800 2000 Soil moisture content (%) 0 2 4 6 8 10 12 14 16 2.1 6.3 6.2 6.4 6.1 3.5 3.3 3.4 1.2 3.1 3.2 2.2 (b) Soil respiration rate (mmol CO 2 m –2 ·h –1 ) Figure 1. Habitat-mean field soil respiration rate versus habitat-mean soil moisture content for (a) coastal habitats and (b) inland habitats. Habitat numbers are as in Table 1. Mean soil moisture contents are from [17]. and the Saline mire (6.6) supraoptimal, moisture contents for soil respiration. 3.2. Prediction of Soil Respiration Rate from Botanical and Soil Characteristics Figure 1(a) shows that soil moisture content is a strong determinant of field soil respiration rate for the coastal habitats; rates increase sharply with moisture up to an optimal moisture content between 650% and 750% and then decline quite rapidy at higher moisture levels. Amongst the non-coastal habitats (Figure 1(b)) respira- tion also increases exponentially with moisture content, again up to maximum values between 650% and 750%, but the decline in rate above optimum moisture content is much less pronounced; in fact, the wet mire habitat (6.3) shows a mean respiration rate about 1/3 higher than most of the other inland mire habitats (6.1, 6.2, 6.4), all of which had drier soils. Despite the clear relationship between respiration rate and soil moisture, moisture content is a poor predictor of respiration rate across all the habitats, mainly because across the whole range of moisture contents there is a disparity in rates between coastal (manured) and inland (non-manured) habitats. Of the other soil variables, inor- ganic P concentration is the most useful predictor of soil respiration rate in the field, followed by total N concen- tration. Multiple linear regression analysis showed that the two together accounted for 56% (P < 0.001) of the across-habitat variation in respiration rate. Respiration rate is also significantly correlated with (log) plate count of soil bacteria (r2 = 0.44, P = 0.001). However, while regression models with only soil chemistry and/or soil microorganism variables accurately predict soil respira- tion rate for particular habitats, they prove inadequate when applied across all the habitats, and perform par- ticularly poorly in the case of the habitats with very low respiration rates. The suite of variables that best predict field respiration rate across the whole suite of habitats comprises only botanical characteristics—the relative covers of mat- forming dicotyledons, rosette-forming dicotyledons, de- ciduous shrubs, pteridophytes and cushion-forming di- cotyledons. Mat-forming dicot (log) cover alone accounts for 50 % of the across-habitat variation in soil respiration rate but is not a useful predictor since that plant guild is absent from some habitats. The regression model based on the five plant guilds mentioned above accounts for 94% of the variation in respiration rate and successfully predicts rates for most of the habitats (Figure 2). It un- derpredicts rates for Mesic fernbrake (3.3) by about 33% 051015 20 25 30 0 5 10 15 20 25 30 Observed mmol CO 2 m -2 h -1 ) 5.1 5.3 3.3 2.1 & 2.2 3.4 & 6.6 4.1 6.5 5.2 Re sp 10 = 9.4 93 log Matdi cot + 0.248 Rosedicot + 0.201 Decshrub + 0.028 Pterido - 0.039 Cushdico + 3.570 r 2 = 0.94 Observed rat e (mmol CO 2 m –2 ·h –1 ) Predicted rate (mmol CO2 m–2·h–1) Figure 2. Predicted and observed habitat mean soil respire- tion rates for a regression model using the relative covers of five plant guilds as predictors. The solid line indicates per- fect prediction and the dashed lines the 95% confidence limits of the predictions. The slope, intercept and determi- nation (r2) coefficients are shown. Habitats mentioned in the discussion of the model are identified by their number (Ta- ble 1). Copyright © 2012 SciRes. OJSS 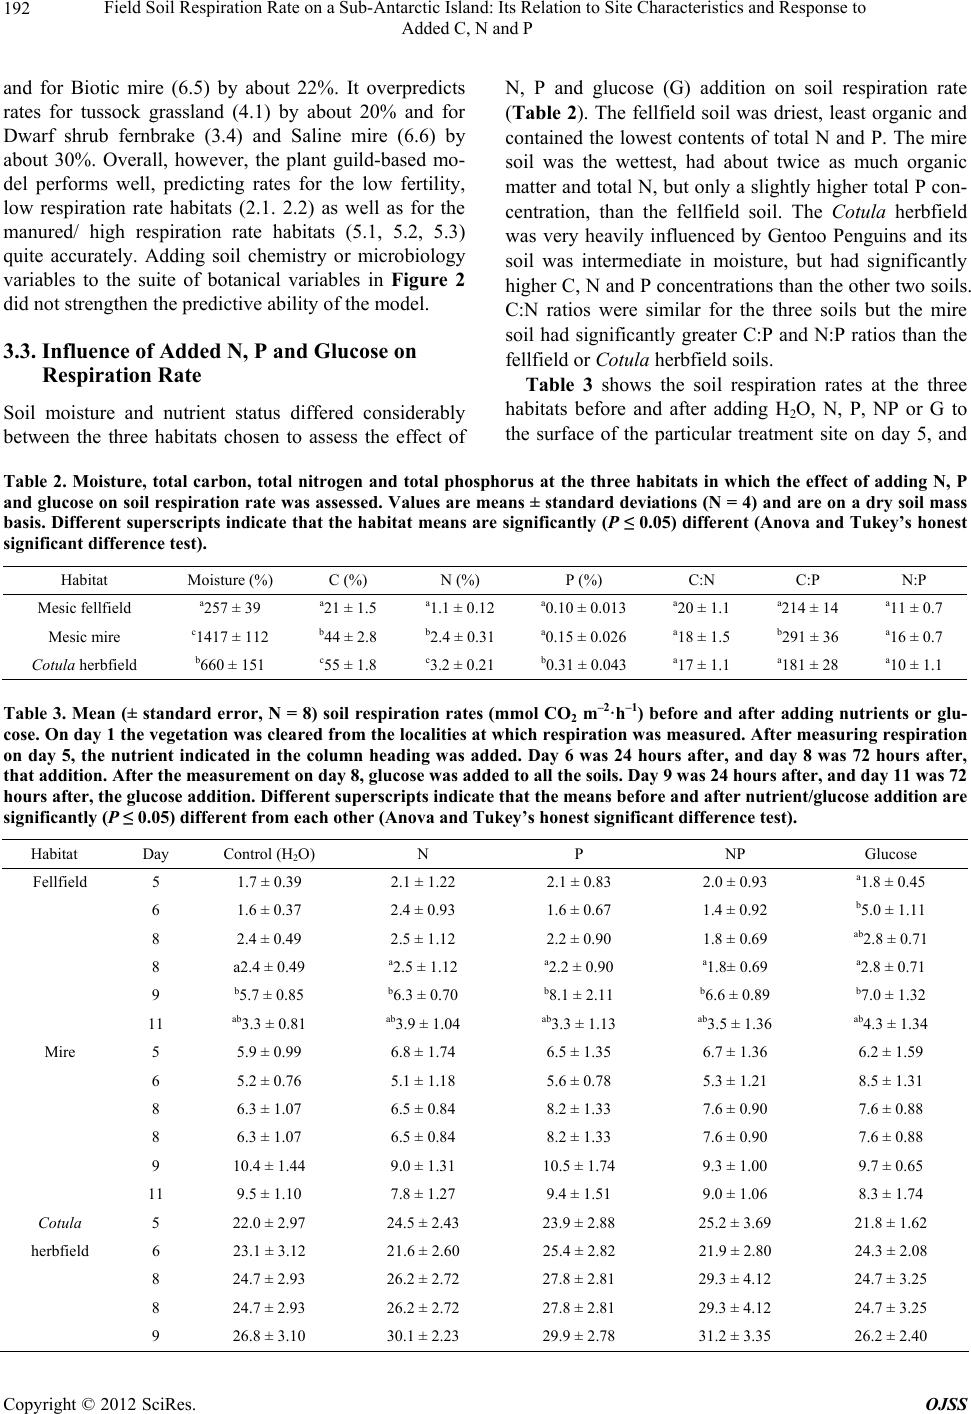 Field Soil Respiration Rate on a Sub-Antarctic Island: Its Relation to Site Characteristics and Response to Added C, N and P Copyright © 2012 SciRes. OJSS 192 and for Biotic mire (6.5) by about 22%. It overpredicts rates for tussock grassland (4.1) by about 20% and for Dwarf shrub fernbrake (3.4) and Saline mire (6.6) by about 30%. Overall, however, the plant guild-based mo- del performs well, predicting rates for the low fertility, low respiration rate habitats (2.1. 2.2) as well as for the manured/ high respiration rate habitats (5.1, 5.2, 5.3) quite accurately. Adding soil chemistry or microbiology variables to the suite of botanical variables in Figure 2 did not strengthen the predictive ability of the model. 3.3. Influence of Added N, P and Glucose on Respiration Rate Soil moisture and nutrient status differed considerably between the three habitats chosen to assess the effect of N, P and glucose (G) addition on soil respiration rate (Table 2). The fellfield soil was driest, least organic and contained the lowest contents of total N and P. The mire soil was the wettest, had about twice as much organic matter and total N, but only a slightly higher total P con- centration, than the fellfield soil. The Cotula herbfield was very heavily influenced by Gentoo Penguins and its soil was intermediate in moisture, but had significantly higher C, N and P concentrations than the other two soils. C:N ratios were similar for the three soils but the mire soil had significantly greater C:P and N:P ratios than the fellfield or Co tul a herbfield soils. Table 3 shows the soil respiration rates at the three habitats before and after adding H2O, N, P, NP or G to the surface of the particular treatment site on day 5, and Table 2. Moisture, total carbon, total nitrogen and total phosphorus at the three habitats in which the effect of adding N, P and glucose on soil respiration rate was assessed. Values are means ± standard deviations (N = 4) and are on a dry soil mass basis. Different superscripts indicate that the habitat means are significantly (P ≤ 0.05) different (Anova and Tukey’s honest significant difference test). Habitat Moisture (%) C (%) N (%) P (%) C:N C:P N:P Mesic fellfield a257 ± 39 a21 ± 1.5 a1.1 ± 0.12 a0.10 ± 0.013 a20 ± 1.1 a214 ± 14 a11 ± 0.7 Mesic mire c1417 ± 112 b44 ± 2.8 b2.4 ± 0.31 a0.15 ± 0.026 a18 ± 1.5 b291 ± 36 a16 ± 0.7 Cotula herbfield b660 ± 151 c55 ± 1.8 c3.2 ± 0.21 b0.31 ± 0.043 a17 ± 1.1 a181 ± 28 a10 ± 1.1 Table 3. Mean (± standard error, N = 8) soil respiration rates (mmol CO2 m–2·h–1) before and after adding nutrients or glu- cose. On day 1 the vegetation was cleared from the localities at which respiration was measured. After measuring respiration on day 5, the nutrient indicated in the column heading was added. Day 6 was 24 hours after, and day 8 was 72 hours after, that addition. After the measurement on day 8, glucose was added to all the soils. Day 9 was 24 hours after, and day 11 was 72 hours after, the glucose addition. Different superscripts indicate that the means before and after nutrient/glucose addition are significantly (P ≤ 0.05) different from each other (Anova and Tukey’s honest significant difference test). Habitat Day Control (H2O) N P NP Glucose Fellfield 5 1.7 ± 0.39 2.1 ± 1.22 2.1 ± 0.83 2.0 ± 0.93 a1.8 ± 0.45 6 1.6 ± 0.37 2.4 ± 0.93 1.6 ± 0.67 1.4 ± 0.92 b5.0 ± 1.11 8 2.4 ± 0.49 2.5 ± 1.12 2.2 ± 0.90 1.8 ± 0.69 ab2.8 ± 0.71 8 a2.4 ± 0.49 a2.5 ± 1.12 a2.2 ± 0.90 a1.8± 0.69 a2.8 ± 0.71 9 b5.7 ± 0.85 b6.3 ± 0.70 b8.1 ± 2.11 b6.6 ± 0.89 b7.0 ± 1.32 11 ab3.3 ± 0.81 ab3.9 ± 1.04 ab3.3 ± 1.13 ab3.5 ± 1.36 ab4.3 ± 1.34 Mire 5 5.9 ± 0.99 6.8 ± 1.74 6.5 ± 1.35 6.7 ± 1.36 6.2 ± 1.59 6 5.2 ± 0.76 5.1 ± 1.18 5.6 ± 0.78 5.3 ± 1.21 8.5 ± 1.31 8 6.3 ± 1.07 6.5 ± 0.84 8.2 ± 1.33 7.6 ± 0.90 7.6 ± 0.88 8 6.3 ± 1.07 6.5 ± 0.84 8.2 ± 1.33 7.6 ± 0.90 7.6 ± 0.88 9 10.4 ± 1.44 9.0 ± 1.31 10.5 ± 1.74 9.3 ± 1.00 9.7 ± 0.65 11 9.5 ± 1.10 7.8 ± 1.27 9.4 ± 1.51 9.0 ± 1.06 8.3 ± 1.74 Cotula 5 22.0 ± 2.97 24.5 ± 2.43 23.9 ± 2.88 25.2 ± 3.69 21.8 ± 1.62 herbfield 6 23.1 ± 3.12 21.6 ± 2.60 25.4 ± 2.82 21.9 ± 2.80 24.3 ± 2.08 8 24.7 ± 2.93 26.2 ± 2.72 27.8 ± 2.81 29.3 ± 4.12 24.7 ± 3.25 8 24.7 ± 2.93 26.2 ± 2.72 27.8 ± 2.81 29.3 ± 4.12 24.7 ± 3.25 9 26.8 ± 3.10 30.1 ± 2.23 29.9 ± 2.78 31.2 ± 3.35 26.2 ± 2.40  Field Soil Respiration Rate on a Sub-Antarctic Island: Its Relation to Site Characteristics and Response to Added C, N and P 193 before and after adding G to all the treatment sites on day 8. Adding N, P or NP on day 5 did not significantly change respiration rate after 24 or 72 hours at any of the habitats. Mean respiration rate 24 hours after adding adding G to the fellfield soil was nearly 3 times higher than prior to the addition, and 48 hours after that it had still not returned to the pre-addition value. Adding G on day 5 did not significantly enhance respiration rate of the mire or Cotula herbfield soils. However, for the mire, the fact that mean rate 24 h after G addition was nearly 40% greater than prior to the addition, whereas mean rates 24 h after adding H2O, N, P or NP were all lower than be- fore, suggests that glucose might have had a stimulatory effect on mire soil respiration. At the fellfield site, adding glucose on day 8 resulted in a strong stimulation of respiration by day 9, regardless of whether the soils had previously received H2O, N, P, NP or G, and the effect was still present after 72 hours. At the mire too, adding G on day 8 resulted in an in- creased respiration rate 24 hours later, although the dif- ferences for individual pre-treatment groups were not significant at P ≤ 0.05. For all pretreatments together the effect was highly significant; glucose addition on day 8 increased mean respiration rate by nearly 40% at the mire, from 7.2 ± 0.45 mmol CO2 m –2·h–1 to 9.8 ± 0.55 mmol CO2 m–2·h–1 (N = 40, P < 0.001). At the Cotula herbfield the overall mean rate on day 9 (28.8 ± 1.23 mmol CO2 m–2·h–1) was not significantly (P ≤ 0.05) different to that on day 8 (26.5 ± 1.39 mmol CO2 m–2·h–1). 4. Discussion This is the first report of in situ soil respiration rates for a sub-Antarctic island. Rates found for the non-manured habitats are similar to those reported for comparable Northern Hemisphere tundra vegetation types. For in- stance, the rates for inland fellfields (2.1 and 2.4 mmol CO2 m–2·h–1) are similar to those found for an Arctic li- chen heath (2.5 mmol CO2 m–2·h–1; [10]) and Arctic po- lar deserts (1.6 to 5.2 mmol CO2 m –2·h–1; [11]. Inland habi- tats with a closed vegetation cover comprised of grami- noids, forbs and bryophytes and that are not in- fluenced by animal manuring, such as the mires and fernbrakes, have respiration rates (5.3 to 15.5 mmol CO2 m–2·h–1) that are within the range (2 - 17 mmol CO2 m–2·h–1) re- ported for physiognomically-similar tundra vegetation types such as dwarf shrub tundra, wet and dry tundra mea- dows, tussock tundra, forest tundra and taiga ([10,12-14]. Habitats on the island that are influenced by seabird or seal manuring mostly have respiration rates considerably higher than what has been reported for Northern Hemi- sphere tundra. The field respiration rates presented here are on a soil surface area basis, whereas the laboratory rates given by [7] are per soil mass. Since there are big differences in soil bulk density between habitats, the across-habitat dif- ferences in rates measured by the two techniques cannot be simply equated to each other, but it is noteworthy that they showed a very similar total variation (2 to 28 mmol CO2 m –2·h–1 for the field rates and 1 to 26 μmol CO2 g–1·h–1 for the laboratory measurements; [7], and that the rankings of the habitats in the two data sets were, with a few exceptions, quite similar. However, the habitats are categorised into less precise groups by the field respira- tion rates than by the laboratory rates. On laboratory rates, they clearly fall into 5 groups [7]: 1) a very low soil respiration rate group (Xeric and Mesic fellfields); 2) a low rate group (Open fernbrake, Spring and flush, Coa- stal fellfield and Dry mire); 3), a medium rate group (Closed fernbrake, Mesic fernbrake, Dwarf-shrub fern- brake, Slope drainage line and streambank, Mire drain- age line, Mesic mire); 4) a high rate group (Wet mire, Coastal herbfield, and Inland tussock grassland); 5) a very high rate group (Biotic mire, Saline mire, Coastal tussock grassland, Biotic mud, Cotu la herbfield and Bi- otic lawn). On field rates, Anova and Tukey’s HSD test- ing recognises only 3 groups (Table 1); a fellfield group with very low rates (mean <3 mmol CO2 m –2·h–1), a group of habitats with high rates (mean >15 mmol CO2 m–2·h–1), all of which except the slope drainage line are manured, and a group with moderately low, quite similar, rates (mean, 5 to 8 mmol CO2 m–2·h–1; mostly these are non-manured slopes and mires). The only anomaly in this grouping on field rates is that Coastal tussock grassland, which is influenced by seabirds and has a large and ac- tive soil bacterial population and a high primary produc- tion [2,3,15], falls into the medium rate group rather than with the other manured habitats. As was suggested above, low in vivo soil moisture content might be the reason for this. The position of the Slope drainage line habitat in the high respiration group is also somewhat surprising, but drainage lines are minerotrophic [16], have a high pri- mary production [15] and their soil moisture contents that are around the optimum for soil respiration (3.5 in Figure 1(b)). Adding glucose to the fellfield and mire soils stimu- lated soil respiration but adding N, P and NP did not. However, adding glucose (on day 8) to fellfield soil that had previously been fortified with P or NP (on day 5) resulted in a 3.7-fold increase in respiration rate, com- pared with 2.4- to 2.5-fold increases for the soil and that received only water, glucose or N on day 5. This sug- gests that, regarding inorganic nutrients, soil respiration in the fellfield soil is limited primarily by P rather than N and that there is no synergism between the two. Labora- tory respiration measurements [8] also showed that add- ing glucose to fellfield soil previously fortified with P Copyright © 2012 SciRes. OJSS  Field Soil Respiration Rate on a Sub-Antarctic Island: Its Relation to Site Characteristics and Response to Added C, N and P 194 stimulated respiration rate 75% more than adding glucose to soil fortified with N, but there was a strong synergistic effect in the laboratory; glucose addition to soil fortified with N and P stimulated rates 3 to 4 times more than glucose addition to soil fortified with only N or only P. N, P and NP addition did not affect field respiration rate of the mire soil differently to adding water alone, and adding glucose to mire soil previously fortified with N, P or NP did not enhance rates more than adding glu- cose to soil that had received no N or P fortification. This is also different to the findings of the laboratory-incuba- tions, where the glucose-mediated respiration response for mire soil subsamples pretreated with N or P was about 70% greater, and for subsamples pretreated with both N and P nearly 300% greater, than the response to glucose of subsamples pretreated with water [8]. For the Cotula herbfield soil, addition of N, P, NP or glucose had no effect on respiration rate in the field. In the laboratory incubations, glucose did stimulate respire- tion of Cotula herbfield soil, but N and P did not [8]. In both the laboratory and the field, adding glucose to soils pretreated with N and/or P did not result in a greater stimulation than adding glucose to untreated soil. Overall, the results of adding inorganic nutrients and/ or glucose to soils in the field are less clear than what was found previously in the laboratory, but both suggest that the stimulatory influence of manuring by seabirds and seals on soil respiration is primarily due to the addi- tion of labile carbon substrate and secondarily through the addition of inorganic nutrients such as N and P. How- ever, manuring has a whole syndrome of consequences that might enhance soil respiration, such as improved pri- mary production (resulting in increased litter input and root exudation), a higher quality of litter and soil organic matter, larger, more active and more diverse soil micro- bial populations better able to utilize a wider range of organic substrates (including the more recalcitrant types), and larger populations of microbivores that stimulate microbial activity and turnover. Botanical characteristics (the relative cover of five plant guilds) proved the best predictors of soil respiration rate measured in the field. In contrast, laboratory respira- tion rates correlated best with soil chemistry and soil microorganism characteristics [7]. Inorganic P alone ac- counted for 81%, and together with (log) plate count of bacteria for 86%, of the across-habitat variation in labo- ratory-measured respiration rate. Adding (log) cover of mat dicots increased the proportion of explained variance to 93%, nearly the same as the best suite of predictors of field rates (Figure 2). However, the overall predictive capacity of the field-based model is considerably better than the laboratory-based one, which seriously mispre- dicts respiration rate for 10 of the habitats (figure 1(f) in [7]), and performs especially poorly for habitats with low to moderately low rates. The field respiration model se- riously mispredicts rates for only 5 habitats and performs well for the habitats with low to moderately low rates. This bodes well for being able to successfully estimate soil CO2 flux in a whole island model or carbon ex- change, since such habitats comprise about 90% of the island’s vegetated area. 5. Acknowledgements The South African Department of Environmental Affairs and Tourism provided logistical support for this study. The Department of Botany and Zoology at Stellenbosch University and the USAID Capacity Building Pro- gramme of the Centre for Invasion Biology at Stellen- bosch University financially supported A. Lubbe to carry out this project. Elizma Yelverton of the South African Weather Service assisted in measuring soil respiration rates. REFERENCES [1] V. R. Smith and M. G. Steyn, “Soil Microbial Counts in Relation to Site Characteristics at a Sub-Antarctic Island,” Microbial Ecology, Vol. 8, No. 3, 1982, pp. 253-266. doi:10.1007/BF02011429 [2] D. D. French and V. R. Smith, “Bacterial Populations in Soils of a Sub-Antarctic Island,” Polar Biology, Vol. 6, No. 2, 1986, pp. 75-82. doi:10.1007/BF00258256 [3] D. C. Grobler, D. F. Toerien and V. R. Smith, “Bacterial Activity in Soils of a Sub-Antarctic Island,” Soil Biology and Biochemistry, Vol. 19, No. 5, 1987, pp. 485-490. doi:10.1016/0038-0717(87)90089-7 [4] V. R. Smith, M. Steenkamp and D. D. French, “Soil De- composition Potential in Relation to Environmental Fac- tors on Marion Island (Sub-Antarctic),” Soil Biology and Biochemistry, Vol. 25, No. 11, 1993, pp. 1619-1633. doi:10.1016/0038-0717(93)90018-7 [5] V. R. Smith and M. Steenkamp, “Macroinvertebrates and Litter Nutrient Release on a Sub-Antarctic Island,” South African Journal of Botany, Vol. 58, 1992, pp. 105-116. [6] V. R. Smith, “Introduced Slugs and Indigenous Caterpil- lars as Facilitators of Carbon and Nutrient Mineralisation on a Sub-Antarctic Island,” Soil Biology and Biochemis- try, Vol. 39, No. 2, 2007, pp. 709-713. doi:10.1016/j.soilbio.2006.09.026 [7] V. R. Smith, “Soil Respiration and its Determinants on a Sub-Antarctic Island,” Soil Biology and Biochemistry, Vol. 35, No. 1, 2003, pp. 77-91. doi:10.1016/S0038-0717(02)00240-7 [8] V. R. Smith, “Moisture, Carbon and Inorganic Nutrient Controls of Soil Respiration at a Sub-Antarctic Island,” Soil Biology and Biochemistry, Vol. 37, No. 1, 2005, pp. 81-91. doi:10.1016/j.soilbio.2004.07.026 [9] V. R. Smith and M. Steenkamp, “Classification of the Copyright © 2012 SciRes. OJSS  Field Soil Respiration Rate on a Sub-Antarctic Island: Its Relation to Site Characteristics and Response to Added C, N and P Copyright © 2012 SciRes. OJSS 195 Terrestrial Habitats on Sub-Antarctic Marion Island Based on Vegetation and Soil Chemistry,” Journal of Vegetation Science, Vol. 12, No. 2, 2001, pp. 181-198. doi:10.2307/3236603 [10] B. H. Svensson, A. K. Veum and S. Kjelvik, “Carbon Losses from Tundra Soils,” In: F. E. Wielgolaski, Ed., Fennoscandian Tundra Ecosystems. Part 1. Plants and Microorganisms. Ecological Studies, Vol. 16, Springer, Berlin, Heidelberg, New York, 1975, pp. 279-286. [11] L. Illeris, A. Michelsen and S. Jonasson, “Soil plus Root Respiration and Microbial Biomass following Water, Ni- trogen and Phosphorus Application at a High Arctic Semi Desert,” Biogeochemistry, Vol. 65, No. 1, 2003, pp. 15- 29. doi:10.1023/A:1026034523499 [12] E. D. Vance and F. S. Chapin III, “Substrate Limitations to Microbial Activity in Taiga Forest Floors,” Soil Biol- ogy and Biochemistry, Vol. 33, No. 2, 2001, pp. 173-188. doi:10.1016/S0038-0717(00)00127-9 [13] S. Sjögersten and P. A. Wookey, “Climatic and Resource Quality Controls on Soil Respiration Across a Forest- Tundra Ecotone in Swedish Lapland,” Soil Biology and Biochemistry, Vol. 34, No. 11, 2002, pp. 1633-1646. doi:10.1016/S0038-0717(02)00147-5 [14] C. Corradi, O. Kolle, K. Walter, S. A. Simov and E.-D. Schulze, “Carbon Dioxide and Methane Exchange of a North-East Siberian Tussock Tundra,” Global Change Biology, Vol. 11, No. 11, 2005, pp. 1910-1925. [15] V. R. Smith, “Terrestrial and Freshwater Primary Produc- tion and Nutrient Cycling,” In: S. L. Chown and P. W. Froneman, Eds., The Prince Edward Islands: Land-Sea Interactions in a Changing Ecosystem, African SunMedia, Stellenbosch, 2008, pp. 181-214. [16] B. J. Huntley, “Vegetation,” In: E. M. Van Zinderen Bakker, et al., Eds., Marion and Prince Edward Islands, A.A. Balkema, Cape Town, 1971, pp. 98-160. [17] V. R. Smith, M. Steenkamp and N. J. M. Gremmen, “Terrestrial Habitats on Sub-Antarctic Marion Island: Their Vegetation, Edaphic Attributes, Distribution and Response to Climate Change,” South African Journal of Botany, Vol. 67, No. 4, 2001, pp. 641-654.
|