International Journal of Geosciences
Vol.4 No.2(2013), Article ID:29459,14 pages DOI:10.4236/ijg.2013.42045
Near Surface Fractures Evidence from Audio-Magnetotelluric (AMT) Investigation in Ayos-Nguelemendouka Area (Eastern Cameroon)
1School of Geology, Mining and Mineral Processing, University of Ngaoundéré, Ngaoundéré, Cameroun
2Department of Physics, Advanced Teacher’s Training College, University of Yaoundé, Yaoundé, Cameroun
3Department of Physics, Faculty of Science, University of Yaoundé, Yaoundé, Cameroun
Email: *theopndougsa@gmail.com, *arsenemeying@yahoo.fr
Received November 14, 2012; revised January 2, 2013; accepted February 1, 2013
Keywords: AMT Sounding; Tectonic Unevenness; Stratification; Uplift; Discontinuities
ABSTRACT
The current study deals with an interpretation of audio-magnetotelluric (AMT) data collected in the Ayos/Nguelemendouka area, using a Stratagem EH4 unit. The study’s objective is to provide a better understanding of the area’s subsurface structure. Thus, AMT soundings were realised through seven profiles NE30˚ oriented, each profile made up of four stations. Data modelling highlights a SW-NE tectonic unevenness which seems to correlate with the Centre Cameroon Shear Zone. Moreover, this interpretation put into evidence an uplift of the basement at Lamba 2, a tabular structure at depth and an absence of discontinuities beneath 300 m depth.
1. Introduction
The Congo Craton is overlapped by the Yaoundé granulitic series of the Pan-African Mobile Belt and the transition zone between the Congo Craton/Pan-African Mobile Belt seems to be characterized by a fault which is composed by recurrent faulting [1-3]. The previous studies using geophysical techniques [4-6] covering the east adjacent area Akonolinga/Abong-Mbang has brought forth evidence of a buried fault oriented E-W, a system of crushing structures and a tectonic node in Ayos [7]. In addition the area was affected by an earthquake in 1913 [8]. These assumptions have permitted the authors to initiate the present audio-magnetotelluric (AMT) study. The objective of this work is to observe the behavior of near surface of the Ayos/Nguelemendouka area through audio-magnetotelluric data collected with a Stratagem EH4 unit along 7 profiles.
2. Geological and Tectonical Setting
The area under study is located between the latitudes 4˚N and 4˚25'N and the longitudes12˚40'E and 13˚E (Figures 1 and 2), and covers approximately a surface area of 75 km (W-E) × 47 km (S-N). This zone has a relative relief with a mean altitude ranged between 600 and 700 m [8], and the structural trends in the area follow that of the Nyong River which flows along ENE-WSW.
A major part of Cameroon is constituted of a Precambrian basement containing magmatic and metamorphic rocks belonging to various Precambrian epochs. The outcropping rocks are mainly granites and migmatites rejuvenated during the Pan-African episode [9].
In the study area, the main structural unit that we meet is the Yaoundé garnetiferous series [10,11] (Figure 1). The garnetiferous series (620 ± 20 Myrs) is constituted of micaschists and garnetiferous gneisses (Figure 2) metamorphosed during the Pan-African orogeny [12]. This garnetiferous series have been settled under northwards increasing metamorphism conditions, reaching their paroxysm at the Yaoundé latitude, and decreasing more to the North [1]. The Ayos-Nguelemendouka area is characterized by three main groups of rocks [10,13]: gneiss, schist and quartzite, and the granite. The biotite amphiboles and the mica are found as interlayer respectively into granite and gneiss. Minerals quartzite and chloritic schist are found in the area. The rock groups of the whole nappe are thought to be derived from iron-rich carbonaceous shales and arenites that were intruded by diorite rocks in either a continental basin or a passive margin environment [10-13]. The groundwater evaluation of the area is not developed due to the lack of studies devoted to this particular issue.
From a tectonic point of view, Southern Cameroon is

Figure 1. Simplified geological map of southern Cameroon (Meying et al., 2009) modified.
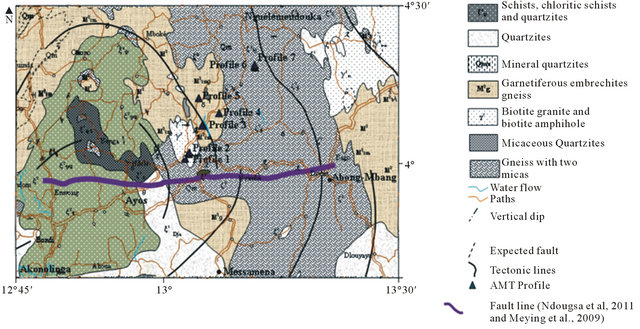
Figure 2. Geologic map of the study area (Gazel & Guiraudie, 1965) modified.
characterized by a sinistral transgressive evolution, controlled by the great N170˚E Cameroon Center strike-slip faults [13]. It includes E-W directed structures with a moderated dip toward the Congo Craton, and it is also associated to a South oriented slip tectonic nappe [1,7, 12-14].
The tectonic evolution of the area comprises four main phases [11,13] which are a D1 deformation phase of unknown kinematics, marked by a foliation greatly transposed by late deformations. The associated metamorphism corresponds to granulitic facies inside gneisses, and to amphibolite facies in the quartzitic schist series; A D2 phase including two progressive sequences: an initial sequence D2a and a late sequence D2b; The D2a corresponds to a granulitic nappe directed E-W with a west to southwest vergency. The Metamorphism associated to this deformation phase corresponds to granulite facies in gneiss and to amphibolite facies in the quartzitic schist series.
The D2b shows a tangential tectonic vergency directed N-S which is associated to a retrograde regional metamorphism that occurs in amphibolites facies for gneiss, and green schists for the schisto-quartzitic basement; The D3 deformation phase is characterized by a big regional N-S fold system, affecting all the previous structures. These folds are related to the E-W mega dextral shearing belt of Ayos. Some outcrops of deformations are observed in the kinematic scale, and are equivalent to the structural lineaments identified to be gneiss and micaschists [11]. This major tectonic feature is identified by a dextral strike-slip fold. The D3 deformation phase evolves respectively in amphibolites and green schists facies for gneiss and schists. An essentially brittle D4 phase identified by joints and normal faults marked with discontinuous plugged joints or by granitic veins. The geological and tectonic facts described above show the complexity of the Ayos-Nguelemendouka area.
3. Methodology and Data Acquisition
The Magnetotelluric (MT) method has been introduced [15] developed [16-18] and applied in geophysical and structural geology prospecting [4,6,19-25]. It consists of the simultaneous measurements of orthogonal electric and magnetic natural fields at any point on the surface of the Earth, in order to deduce the resistivity of rocks of the homogeneous subsurface. But in the real case the subsurface is inhomogeneous and the determination of the apparent resistivity is governed by the Bostick [19] law.
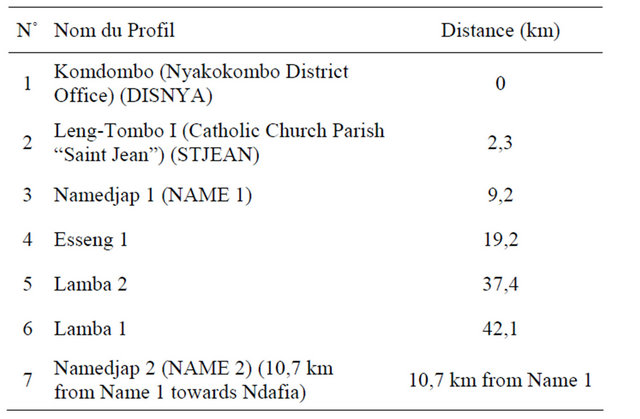
The AMT data were collected along seven profiles following Ayos-Nguelemendouka road (Figure 2) using the Geometrics STRATAGEM EH4 unit. This unit is capable of measuring electrical resistivity to depths ranging from a few meters to more than 1 km with orthogonal electrical and magnetic field changes in the frequency range of 92 kHz and 10 Hz. These data were processed to provide tensor impedance measurements for interpreting complex 2D structures. This system is unique in that, it uses both natural (in all measured frequency ranges) and controlled source electromagnetic signals. However, natural signals are generally weak in the higher frequency range. This problem was solved by using artificial signals generated by a transmitter located around 300 m away from the receiver to strengthen the weak background field signals at higher frequencies. To acquire soundings, the STRATAGEM EH4 was assembled at each station with a 25 m dipole length in the X (TE mode) and Y (TM mode) directions using 4 buffered electrodes with stainless steel stakes. One of the advantages of using the STRATAGEM EH4 system is that it enables to collect field data both on the TE and TM modes. The choice of the direction of profiles and the implantation of stations has been made on the basis of the available geological information on the study area. The orientation of the major tectonic line as well as faults assumed to be observed in the study zone gave an orientation to the choice of profiles so that the general direction of the set of profiles are secant to the known structural lines. The trend followed by that set of profiles is NE30˚. Each profile is 75 m in length and comprises 4 stations marked S1, S2, S3, and S4 with 25 m station spacing. The azimuth trend is NE30˚; the profile 1 is located at Komdombo in the Nyakokombo’s District; it is the base profile of the survey. Distances between profiles and the base profile (DYSNYA) are reported in Table 1.
The factors contributing to poor data quality in some stations include the presence of very dry conductive materials, which made obtaining a good contact between the ground and electrodes very difficult. To overcome this problem, we poured salt water around grounded electrodes stakes.
Table 1. Distance between profiles and the base profile (DYSNYA).
The soundings made are processed within the STRATAGEM, using the Bostick transform, in order to provide the best estimates of tensor data; thus enabling the 2-D interpretation of these soundings. In other words, the tensor approach suggests that ground structures are at least 2-D and one does not need to know necessarily any a priori strike before carrying out site measurements. We used the Golden Surfer 8.0 and Plot2D (program made to visualize and to edit 2-D modeling results produced by the Imagem software [26] softwares to achieve the 2-D modeling of AMT data from our area under study; these data became pseudo sections and geoelectrical sections.
4. Results
In the present survey, several data have been recorded at every station. The best sounding (coherency superior to 0.70) for each station has been considered. Tensor data are computed by Imagem software [26]. For each station three distinct panels are displayed (Figure 3) showing the scalar resistivity, the phase and the coherency, respectively in both TE and TM mode.
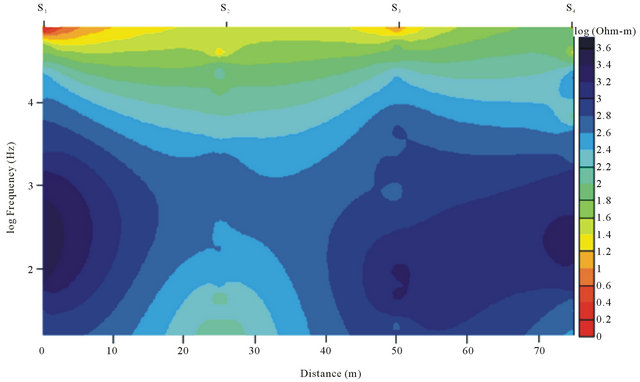
Pseudo sections (Figure 4) look different at all; isoresistivity lines have irregular shapes showing that the area underwent intense tectonics. In some cases, these pseudo sections show subsurface formations which are encountered at depth.
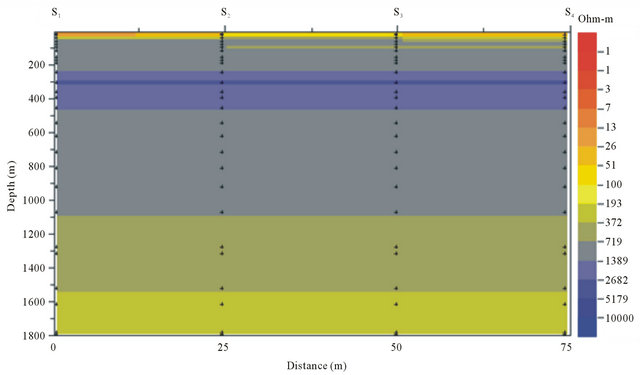
Analysis of profile 1 geoelectrical section (Figure 5) presents some near subsurface discontinuities which seems to be NW30˚ faults at stations S2 and S3, respecttively. Downward from 130 m depth, the stratification is nearly horizontal and the resistivity increases with depth. From the surface to depth, we encounter, successively, a very conductive terrain (7 Ohm-m) with an average thickness of 15 m; A very thin layer of 150 Ohm-m mean resistivity; A third terrain (372 Ohm-m) ; A nearly 190 m thick fourth layer with a mean resistivity of 1000 Ohm-m. Around 75 m depth between stations S2 and S4, we found formations with a same resistivity which is greater than that of the third terrain. The third layer has a mean thickness of 25 m; the fifth layer is very resistive (2000 Ohm-m) and has a thickness of 225 m. Within it, a high resistive and thin formation is embedded. From 1100 m depth, we encounter near surface formations.
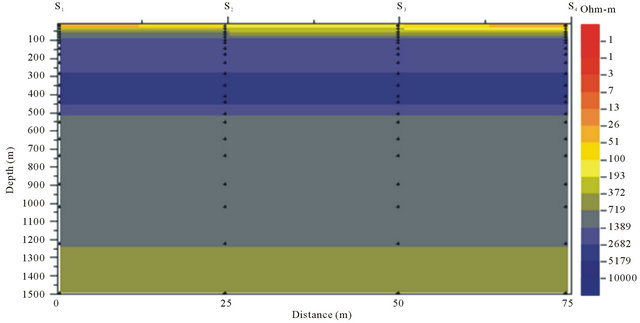
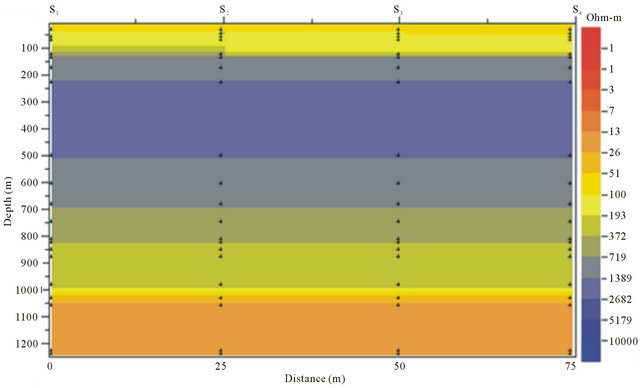
Many discontinuities are observed on profile 2 (Figure 6), the most noticeable is being that observed at 60 m beneath station S2 and the less perceptible at 50 m depth. These discontinuities can be interpreted as faults. From 140 m, the structures are nearly horizontal. From the surface to depth, the geoelectrical section of profile 2 exhibits: a first terrain of 30 m thick and 75 Ohm-m mean resistivity value; a second thin layer with a mean resistivity of 150 Ohm-m; a third terrain with an average thickness of 100 m (and 500 Ohm-m mean resistivity) within which an average resistive material (1000 Ohm-m) is embedded from stations S1 to S2. That formation also appears between stations S3 and S4 where it is thinly; a fourth terrain, with the same resistivity than the first, is surrounded above and below by formations having the
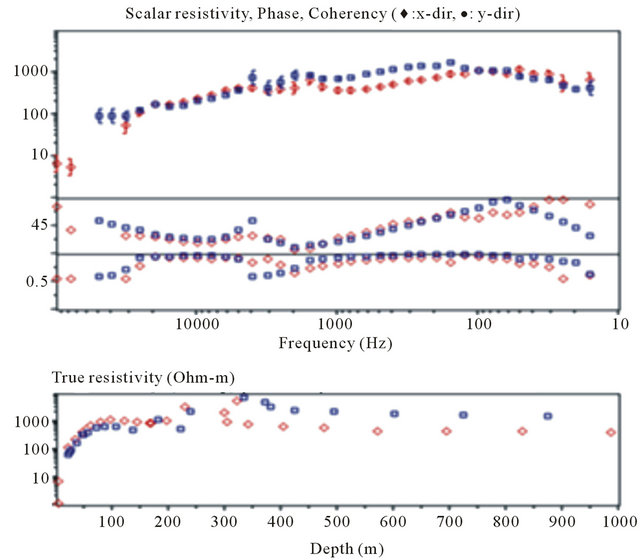
Figure 3. Resistivity’s, phase’s, coherency’s and true resistivity’s curves for a troubleshooting sounding.
 (a)
(a) (b)
(b)
Figure 4. (a) Resistivity pseudo section; (b) Phase pseudo section.
 (a)
(a)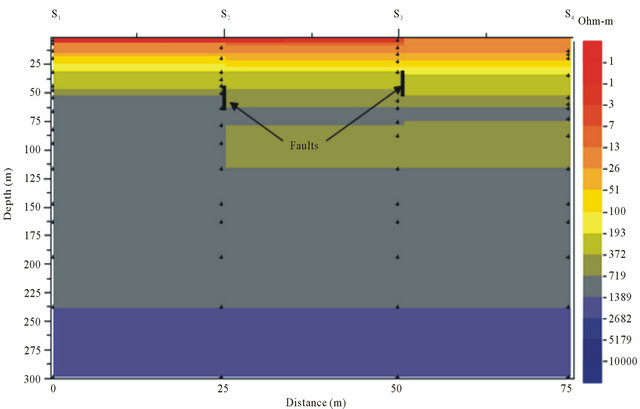 (b)
(b)
Figure 5. Geoelectrical section of profile 1. (a) Depth of 1800 m; (b) Depth of 200 m.
 (a)
(a)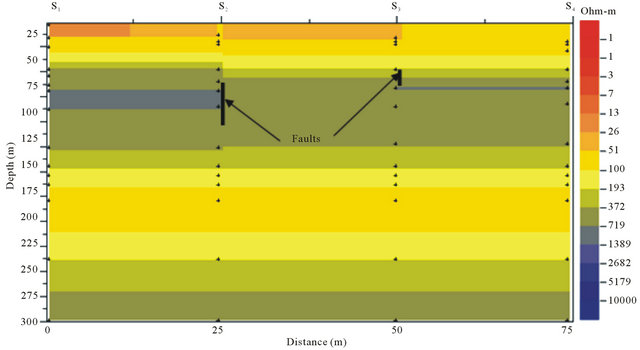 (b)
(b)
Figure 6. Geoelectrical section of profile 2. (a) Depth of 3400 m; (b) Depth of 200 m.
same resistivity than the second terrain; a 120 m thick average resistive layer (1000 Ohm-m); a 2000 m thick resistive layer (4000 Ohm-m) within which a more resistive structure (7000 Ohm-m) structure is found; surface formations are encountered beyond 2400 m depth.
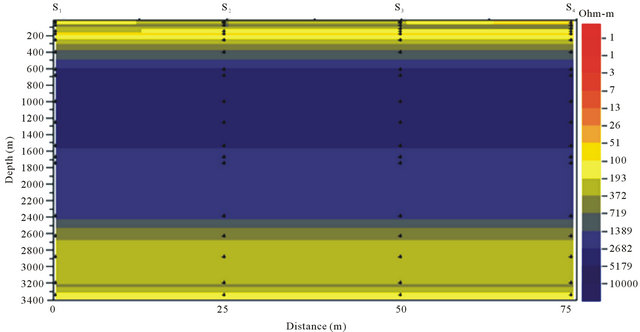
Profile 3 geoelectrical section (Figure 7) presents a quasi tabular subsurface. Formations are characterised by high resistivity values situated between 200 and 480 m depth.
Many discontinuities have been detected on profile 4 (Figure 8); one around 7 m and another at 18 m beneath station S2. Two fractures, respectively at 40 and 75 m
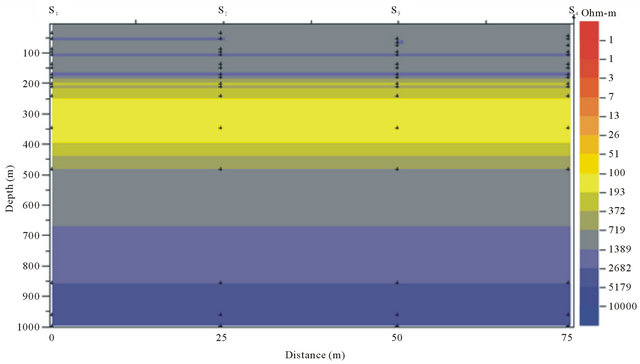
Figure 7. Geoelectrical section of profile 3, depth of 1000 m.
depth, are also observed under the same station; they could be faults. At S3, two discontinuities are observed, one on surface another around 95 m depth. Discontinuities also appear at 18 and 60 m depth between stations S3 and S4.
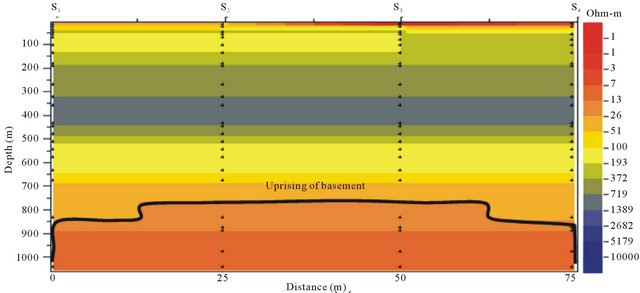
Geoelectrical section of profile 5 (Figure 9) shows that near surface structures appear at depth. A fault-like discontinuity is observed around 45 m below station S3. In addition, an uprising of the basement is observed at depth. This uprising is 200 m about.
Geoelectrical section of profile 6 (Figure 10) highlights a fault-like discontinuity at 95 m below station S2. Downward from 130 m, structures are nearly horizontal and surface formations are encountered at depth, proving that the area underwent intense tectonics.
Profile 7 geoelectrical (Figure 11) shows a heterogeneous basement which upper part is discordant with a very thick low resistive layer, enclosing an average conductive material (100 Ohm-m) with around 40 m thick (h1 = 225 m ; h2 = 265 m) and around 50 m length. This one level stair-like layer may correlate with a sill or a nappe that can be characterized only by drilling. This formation can be reported to that identified in Lamba 2. The discontinuity detected at 75 m beneath station S2 may be a fault.
5. Discussion
Profiles 1 and 2 are located on granodiorites. Profiles 3, 4 and 7 are on garnetiferous embrechite gneisses and profiles 5 and 6 are on garnetiferous gneisses with 2 micas (Figure 2).
From a tectonic point of view, the profile 3 is close to a SE-NW tectonic line and profiles 1 and 2 are near a SSE-NNW oriented tectonic line (Figure 2).
Geoelectrical sections of profiles 1 and 2 show that they are settled on an average conductive zone but, a resistive layer is observed between 250 and 450 m on profile 1. That layer is thicker on profile 2 and it is located beyond 600 m depth. Nevertheless, sections have the same physiognomy and they are characterized by low resistivity values. In accordance with [4-6], profiles 1 and 2 are clearly located above parallel 4˚N. However, the fault line proposed by these authors divides a resistant unit to the south (Congo Craton), to a conductive set to the north (the Panafrican belt). Hence these profiles may be located on the Panafrican. The same clue comes out concerning profile 4 (Esseng 1), although it has higher resistivity values which suppose its settlement on a different formation as the both precedents; this suggest its location on a transition zone.
Profiles 5 and 6 are made up of conductive layers. This may be due to the fact that one begins to move away from the Panafrican/Congo Craton limit.
Profiles 3 and 7 have specific characteristics. Indeed, they are characterized by moderately high resistivity values enclosing a conductive layer. The resistivity range difference observed between Lamba 2 structure (uplift of
 (a)
(a)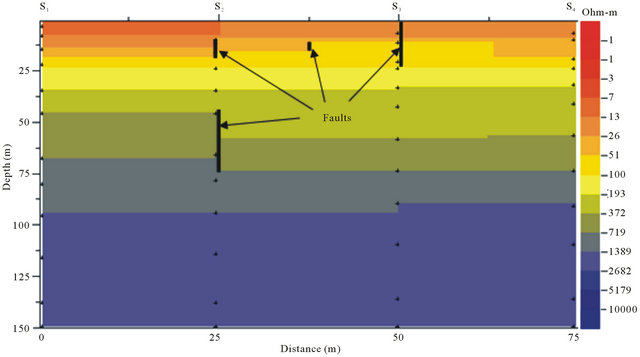 (b)
(b)
Figure 8. Geoelectrical section of profile 4. (a) Depth of 1500 m; (b) Depth of 150 m.
the basement) and that of Name 2 (stairs) may be due to their different weathering scales.
Assuming that each of these profiles is a measurement station because of their small length (75 m), these stations form a 42 km profile which can be divided into three sections: the first regrouping profiles 1 and 2, the second including profiles 3, 4 and 7, and the third including profiles 5 and 6.
First and third sections are characterised by moderately low resistivity values with few more elevated resistivity values at middle near surface. In opposition, the second segment has bigger resistivity values. Thus it
 (a)
(a)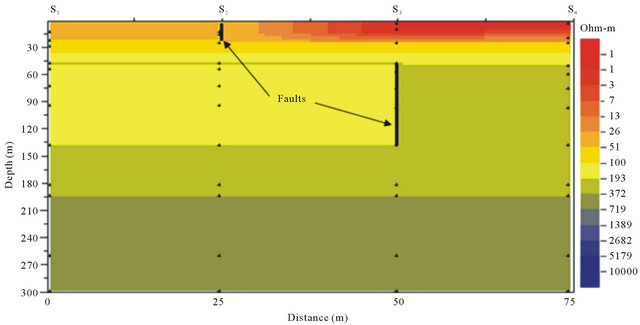 (b)
(b)
Figure 9. Geoelectrical section of profile 5. (a) Depth of 1000 m; (b) Depth of 300 m.
seems important to note that though the study area may be located on Pan-African terrains, we find there a mixture of structures both from the Pan-African and the Congo Craton. This is then the proof that the area underwent an intense tectonic activity, so that the near surface and middle depths have been affected.
Discontinuities observed on geoelectrical sections can be fitted together to form a fault type superficial SW-NE structural line. These discontinuities highlighted are related at the local scale, to the great W-E fault Akonolinga/Ayos/Abong-Mbang [4-6,27], which may continue up to south Bertoua, and, to secondary faults SW-NE oriented secant to the great E-W fault above (Figure 12).
At the regional scale, the near surface SW-NE structural line may correlate with the development of the Centre Cameroon Shear Zone witnessed by the Foumban Shear zone.
The origin of these major folding sets and brittle tectonic lines corresponds to the Pan-African orogeny which resulted from the collision between the Congo Craton
 (a)
(a)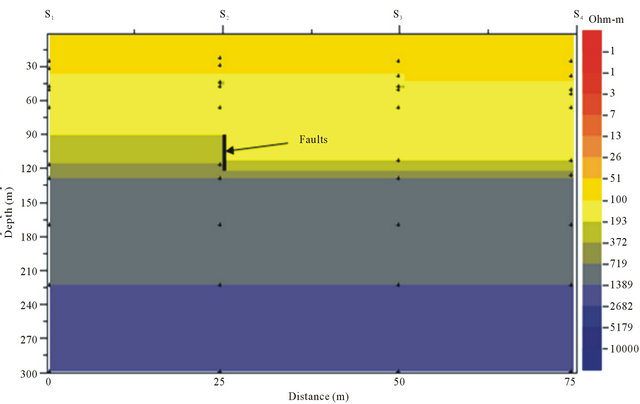 (b)
(b)
Figure 10. Geoelectrical section of profile 6. (a) Depth of 1200 m; (b) Depth of 300 m.
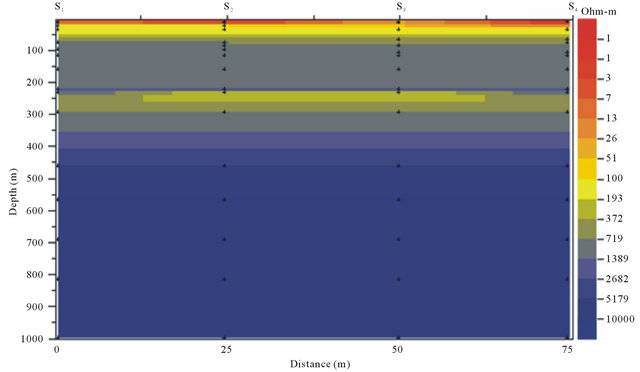
Figure 11. Geoelectrical section of profile 7.
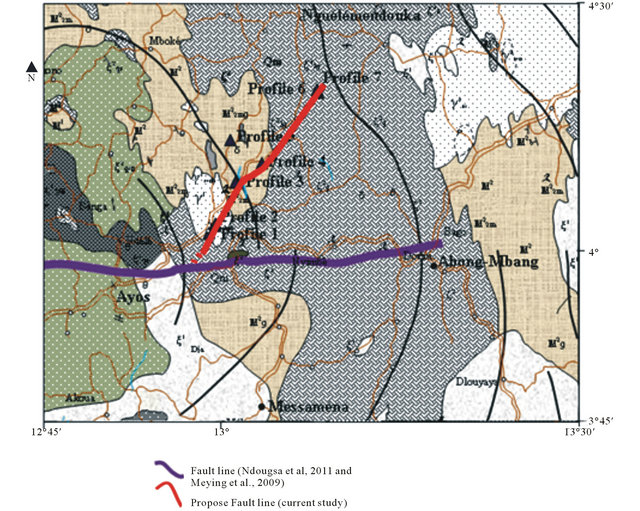
Figure 12. Shallow fault line approximately SW-NE.
and the Mobile Zone. The intersection of the above W-E and SW-NE structural lines may form a tectonic node. The release of energy by this W-E and SW-NE complex (which may replay) may have caused the 5.1 Richter’s scaled magnitude earthquake that stroke the area in 1913 [8]. It is then important to sensitise people living in this geographical area nowadays upon respecting building rules to avoid damages in the case of a new earthquake due to possible movements of above tectonic lines highlighted by the current study.
6. Conclusion
A geophysical investigation of superficial structures has been made by interpreting audio-magnetotelluric (AMT) data collected with a STRATAGEM EH4 in the Ayos/ Ngelemendouka area. This study contributes into the better understanding of the near subsurface structure of the area. It puts in evidence fault-type SW-NE tectonic line which may cross cut the E-W structural line [4-6,27] at Ayos; an uplift of the basement at Lamba 2. Besides we observe that near subsurface formation are encountered at depth.
7. Acknowledgements
The authors are highly indebted to M. Ava Thomas President, Director General of HARVEST MINING Co. who permitted to use the Geometrics’ STRATAGEM EH4 unit for the data collection.
REFERENCES
- J. P. Nzenti, P. Barbey, J. Macaudiere and D. Soba, “Origin and Evolution of the Precambrian High Grade Yaounde Gneiss (Cameroon),” Precambrian Research, Vol. 38, No. 2, 1988, pp. 91-109. doi:10.1016/0301-9268(88)90086-1
- P. Rolin, “La Zone de Décrochement Panafricain des Oubanguides en République Centrafricaine,” Comptes rendus de l'Académie des Sciences, Paris, Vol. 320, No. 2A, 1995, pp. 63-69.
- S. F. Toteu, J. Penaye and D. Y. Poudjom, “Geodynamic Evolution of the Panafrican Belt in Central Africa with Reference to Cameroon,” Canadian Journal of Earth Sciences, Vol. 41, No. 1, 2004, pp. 73-85. doi:10.1139/e03-079
- A. Meying, T. Ndougsa-Mbarga and E. Manguelle-Dicoum, “Evidence of Fractures from the Image of the Subsurface in the Akonolinga-Ayos Area (Cameroon) by Combining the Classical and the Bostick Approaches in the Interpretation of Audio-Magnetotelluric Data,” Journal of Geology and Mining Research, Vol. 1, No. 8, 2009, pp. 159-171.
- J. M. Tadjou, R. Nouayou, J. Kamguia, H. L. Kande and E. Manguelle-Dicoum, “Gravity Analysis of the Boundary between the Congo Craton and the Pan-African Belt of Cameroon,” Austrian Journal of Earth Science, Vol. 102, 2009, pp. 71-79.
- T. Ndougsa-Mbarga, A. Meying, D. Bisso, D. Y. Layou, K. K. Sharma and E. Manguelle-Dicoum, “Audiomagnetotellurics (AMT) Soundings Based on the Bostick Approach and Evidence of Tectonic Features along the Northern Edge of the Congo Craton, in the Messamena/ Abong-Mbang Area (Cameroon),” Journal of Indian Geophysical Union, Vol. 15, No. 3, 2011, pp. 145-159.
- S. Mbom-Abane, “Investigation Géophysique en Bordure du Craton du Congo (Région D’Abong-Mbang/Akonolinga, Cameroun) et Implications Structurales,” Thèse Doctorat d’Etat ès Sciences, Faculté des Sciences, Université de Yaoundé I, 1997, 187 p.
- T. Ndougsa-Mbarga, I. K. Njilah, J. Nni and J. Nana, “Note on the Review of Earthquakes on Cameroon Territory,” Journal of Civil Protection, Ministry of Territorial Administration, Vol. 3, 2010, pp. 65-67.
- J. M. Regnoult, “Synthèse Géologique du Cameroun,” Ministère des Mines et de l'Énergie, 1986, p. 119.
- H. Mvondo, S. W. J. Den-Brok and J. Mvondo-Ondoa, “Evidence for Symmetric Extension and Exhumation of the Yaoundé Nappe (Pan-African Fold Belt, Cameroon),” Journal of African Earth Sciences, Vol. 36, No. 3, 2003, pp. 215-231. doi:10.1016/S0899-5362(03)00017-4
- H. Mvondo, S. Owona, J. Mvondo-Ondoa and J. Essono, “Tectonic Evolution of the Yaoundé Segment of the Neoproterozoic Central African Orogenic Belt in Southern Cameroon,” Canadian Journal of Earth Sciences, Vol. 44, No. 4, 2007, pp. 433-444. doi:10.1139/e06-107
- J. Penaye, S. F. Toteu, W. R. Van Schmus and J. P. Nzenti, “U-Pb and Sm-Nd Preliminary Geochronologic Data on the Yaounde Series, Cameroun: Re-Interpretation of the Granulitic Roks as the Suture of a Collision in the Central Africa Belt,” Comptes rendus de l'Académie des Sciences, Paris, Vol. 317, No. 2, 1993, pp. 789-794.
- J. B. Olinga, J. E. Mpesse, D. Minyem, V. Ngako, T. Ndougsa-Mbarga and G. E. Ekodeck, “The Awaé—Ayos Strike-Slip Shear Zones (Southern-Cameroon): Geometry, Kinematics and Significance in the Late Panafrican Tectonics,” Neues Jahrbuch für Geologie und Paläontologie—Abhandlungen, Vol. 257, No. 1, 2010, pp. 1-11.
- M. Vignès-Adler, A. Le Page and P. M. Alder, “Fractal Analysis of Fracturing in Two African Regions from Sattelite Imagery to Ground Scale,” Tectonophysics, Vol. 196, No. 1-2, 1991, pp. 69-86. doi:10.1016/0040-1951(91)90290-9
- L. Cagniard, “Basic Theory of the Magneto Telluric Method of Geophysical Prospecting,” Geophysics, Vol. 18, No. 3, 1953, pp. 605-635. doi:10.1190/1.1437915
- K. Vozoff, “Magnetotelluric Principles and Practice,” Proceedings of the Indian Academy of Sciences—Earth and Planetary Sciences, Vol. 99, No. 4, 1990, pp. 441- 471.
- K. Vozoff, “The Magnetotellurics Method in the Exploration of Sedimentary Basins,” Geophysics, Vol. 37, No. 1, 1972, pp. 98-141.
- M. S. Zhdanov, “Magnetotelluric and Magnetovariational Methods,” Geophysical Electromagnetic Theory and Methods, Vol. 45, 2009, pp. 545-645.
- F. X. Bostick, “A Simple Almost Exact Method of MT Analysis,” Workshop on Electrical Methods in Geothermal Exploration US Geological Survey, Contract No. 14080001-8, Vol. 359, pp. 174-183.
- M. Ritz, “Etude Régionale M.T. des Structures de la Conductivité Electrique sur la Bordure Occidentale du Craton Ouest Africain en République du Sénégal,” Canadian Journal of Earth Sciences, Vol. 19, 1982, pp. 1408- 1416.
- A. G. Jones, “On the Equivalence of the Niblett and Bostick Transformation in the Magnetotelluric Method,” Geophysic, Vol. 53, 1983, pp. 72-73.
- E. Manguelle-Dicoum, A. S. Bokossah and T. E. Kwende-Mbanwi, “Geophysical Evidence for a Major Precambrian Schist-Granite Boundary in Southern Cameroon,” Tectonophysics, Vol. 205, No. 4, 1992, pp. 437-446. doi:10.1016/0040-1951(92)90447-E
- E. Manguelle-Dicoum, R. Nouayou, A. S. Bokossah and T. E. Kwende-Mbanwi, “Audiomagnetotelluric Soundings on the Basement-Sedimentary Transition Zone around the Eastern Margin of the Douala Basin in Cameroun,” Journal of African Earth Sciences, Vol. 17, No. 4, 1993, pp. 487-496. doi:10.1016/0899-5362(93)90006-C
- J. O. Campos-Enriquez, J. A. Arzate, J. Urrutia-Fuccugauchi and O. Delgado-Rodriguez, “The Subsurface Structure of the Chicxulub Crater (Yucatan, Mexico): Preliminary Results of a Magnetotelluric Study,” The Leading Edge, Vol. 16, No. 12, 1997, pp. 1774-1777.
- O. Delgado-Rodrigez, J. O. Campos-Enriquez, J. UrrutiaFuccugauchi and J. A. Arzate, “Occam and Bostick 1D Inversion of Magnetotelluric Soundings in the Chixulub Impact Crater, Yucatan, Mexico,” Geofisica Internacional, Vol. 40, 2001, pp. 271-283.
- Geometrics, “Operation Manual for Stratagem Systems Running IMAGEM Ver. 2.16,” Geometrics San Jose Californi, 2000.
- T. Ndougsa-Mbarga, E. Manguelle-Dicoum, S. MbomAbane and C. T. Tabod, “Deep Crustal Structures along the North Eastern Margin of the Congo Craton in the Abong-Mbang/Bertoua Region Cameroon Based on Gravity Data,” Electronics Memories of the 2nd Cuban Geophysical Congress and the 4th Latin American Geophysical Conference, 2002, 15 p.
NOTES
*Corresponding author.