Food and Nutrition Sciences
Vol. 3 No. 8 (2012) , Article ID: 21582 , 13 pages DOI:10.4236/fns.2012.38155
Mineral and Trace Element Concentrations in Morinda citrifolia L. (Noni) Leaf, Fruit and Fruit Juice
![]()
Institute of Experimental and Clinical Pharmacology and Toxicology, University Clinic Hamburg-Eppendorf, Hamburg, Germany.
Email: *westendorf@uke.de
Received July 2nd, 2012; revised August 2nd, 2012; accepted August 9th, 2012
Keywords: AAS; Morinda citrifolia; Noni; Minerals; Trace Elements; Toxic Metals
ABSTRACT
Fruit and leaf of noni (Morinda citrifolia L.) have been used traditionally as food and for medicinal purposes by South Pacific populations since over two thousand years. Recently noni fruit juice became very popular as health beverage worldwide. Manufacturers and distributors of noni juice often praise the high content of minerals and trace elements in conjunction with the geological situation of the origin of the raw noni material. We therefore performed an investigation about the metal concentration of noni fruit, leaf and soil samples from 42 different locations in French Polynesia, and of 16 commercial noni juices. Median concentrations of metals in noni fruit, leaf and fruit juice appeared in a normal range compared to other fruits, however, the variance between different locations was considerable. Noni fruits from lime soil were poorer compared to volcanic soil in most metals. Self-prepared noni juices did generally not serve for more then 10% of the daily requirement of trace elements and minerals per 100 ml. The metal concentration in noni fruit puree was higher compared to clear juice and reached 10% and 34% of the daily requirement in 100 ml for manganese and chromium respectively. The concentrations of toxic metals (As, Cd, Pb) were below 2% of the maximum permitted levels (MPL) in all of these juices. For one of the commercial noni juices the MPL for lead was exceeded (170%) and some others were close to it. Most metals showed a good correlation regarding the concentration in noni fruit versus leaf, but not for soil versus fruit or juice. The concentration of magnesium, manganese, zinc and germanium in the commercial juices was highly correlated to the potassium concentration, indicating that these elements are useful to detect a dilution of noni juices.
1. Introduction
The noni tree (Morinda citrifolia L.) grows in almost all tropical areas of the world, however, preferably on South Pacific islands [1,2]. After invading a habitat, the plant is distributed by animals eating the fruits, which contain over hundred non digestible seeds per single fruit. Pacific islands have often many different soil conditions, such as solid lava, soil resulted from decomposition of lava flows, volcanic ash [3,4] as well as lime soil at beach areas and coral islets [5]. Noni plants grow on all of these types of soil between coastal sides and up to heights of 500 - 600 m (Table 1).
The noni plant plays an important role in the Polynesian culture since several thousand years. All parts of the plant were used to maintain health and cure many kinds of diseases [1]. These traditions survived until present time [6]. Since 1996, noni products, mainly the fruit juice, are available as health food worldwide. Noni fruit juice and noni leaf tea were recently approved by EU law as novel food [7,8].
Metals are important components of all organisms. They can be divided into minerals (Na, K, Ca, Mg) with multiple functions in every cell and essential elements (Zn, Fe, Cu, Co, Ni, Cr, V, Mo, Se), with limited function mostly as cofactors for enzymes. Minerals may occur in concentrations of grams per Kg biological mass, whereas essential elements make up only mg or µg amounts per KG [9]. Humans get their daily required amounts of metals mainly by food and to a minor degree by drinking water. Overload with or lack of minerals is rare because they are abundant in most kinds of food and our body has very effective regulating mechanisms which guarantee mineral homeostasis. Essential elements, on the other hand, have often a narrow range between daily requirement and toxicity [10]. A healthy, well balanced diet normally guarantees a sufficient supply with all essential elements. Imbalanced diets and consumption of a high degree of processed food can cause deficiencies of essential elements with subsequent development of diseases. An overload with essential elements causing symptoms of toxicity can occur, if food plants grow on soil containing high concentrations of such elements, either naturally or by contamination [11,12].
Food of plant origin is most important for supply with minerals and essential elements; however, it can also be a source of toxic metals, such as As, Cd, Pb, Hg. Tl, Po, Th or U. These elements have no known biological functions, but can adversely interfere with biological reactions. Organisms usually have defense mechanisms against the toxicity of such elements, and tolerate certain amounts in the diet [13]. Most countries introduced maximum permitted levels (MPL) of toxic elements in food in order to minimize the exposure of people.
Food companies often advertise their products as valuable suppliers of minerals and essential elements. This is also the case for some companies selling products prepared from noni (Morinda citrifolia) as can be seen in the internet. They argue that noni plants grow on volcanic soil, which is especially rich in minerals and essential elements. However, the availability of the metals for the plant depends on a number of conditions, such as the pH of the soil, the particle size and the chemistry of the soil components. Moreover, different plants may have individual accumulation capacities for metals [14,15]. The fact that a plant grows on volcanic soil does therefore not guarantee high concentrations of minerals and essential elements. Tobacco plants are known to accumulate Cd and other toxic metals in the leaves [16]. Similar results were demonstrated for a number of food plants, such as rice and soy [17,18]. It is unknown, whether noni plants have an increased potential to accumulate minerals and trace elements.
The aim of the present investigation was to analyze noni fruits and leaves as well as noni juices for their content of minerals, essential and toxic elements and compare it to soil conditions of the origin of the plants.
2. Materials and Methods
2.1. Chemicals and Reference Compounds
Standard solutions for Atomic Absorption Spectroscopy (AAS) of Na, Mg, K, Ca, V, Cr, Mn, Fe, Cu, Zn, Ge, As, Mo, Cd and Pb, were purchased from Merck (Darmstadt, Germany). Concentrated nitric acid (ultra pure) and Ammonium nitrate (ultra pure) were purchased from the same company. Commercial noni juices were purchased via the internet or in European food stores.
2.2. Plant and Soil Materials
Fresh noni fruit and leaf were harvested on the French Polynesian islands Tahiti, Moorea, Huahine, Raiatea and Tahaa (Society Islands,) and Nuku Hiva, Ua Pou, Ua Huka, Hiva Oa, Tahuata, Fatu Hiva (Marquesas). The samples were frozen on site and carried to Hamburg. Juices of noni fruits were prepared after thawing by squeezing the fruits in a potato press. The juices were centrifuged to remove solid particles. Soil samples from 7 locations of French Polynesia were collected close to noni trees. These samples were irradiated prior to shipment to Hamburg, in order to kill any microbes.
2.3. Sample Preparation for AAS and ICP AES Analysis
Noni fruit juice: About 100 µl of samples were filled into Teflon containers and dried at 100˚C. The residues were supplemented with 2 ml of 65% nitric acid. The mixture was autoclaved at 180˚C in closed Teflon vials for eight hours. After cooling down to room temperature, the clear solution was diluted to 20 ml with distilled water. This solution was directly used for the determination of the metal concentrations in the AAS. For some metals (K, Na, Ca) the solutions were further diluted up to 1:1000, before the determination of the metal concentration in the AAS.
Noni fruit and leaf: Frozen samples of noni fruit and leaf were freeze dried and pulverized. Amounts of approximately 100 mg were placed in Teflon containers, supplemented with 2 ml of 65% nitric acid and autoclaved at 180˚C for eight hours. The following steps were identical with the preparation of fruit juices.
Total element analysis of soil samples: About 100 mg of soil samples were supplemented with 2 ml 65% HNO3 in Teflon containers, closed and heated at 190˚C for about 6 hours. After cooling and opening, the solutions were diluted with dist. water, filtered, transferred into a glass vial and adjusted to 20 ml. The insoluble particles (SiO2) were heated together with the filter at 850˚C in a stream of pure oxygen and the residue was weighed and calculated as SiO2. The carbon and nitrogen content of soil samples were investigated by combustion at 1000˚C in an oxygen atmosphere using an elemental analyzer (Perkin Elmer, Rodgau, Germany).
Soil extraction with ammonium nitrate: 2 g dry soil was mixed with 15 ml of 1 M NH4NO3-solution and stirred for 2 hours at room temperature. The mixture was filtered, washed with small amounts of dist. water, transferred to a glass tube and adjusted to 20 ml.
2.4. Determination of the Metal Concentrations
The concentration of the different metals in noni fruit, leaf, fruit juice and ammonium nitrate soil extracts were determined with a Thermo Elemental AAS Spectrometer (Solaar M), equipped with a flame detector and a GF-95 graphite furnace. Specific hollow cathode lamps were used for the determination of the different elements. The flame detection technique was used for the investigation of K, Na, Mg, Ca and Zn. All other elements were investigated using the graphite furnace technique. The AAS is equipped with quantitating software, which calculates the metal concentrations in mg (µg)/L. Total element analysis of soil samples was performed with an ICP AES (Induced Coupled Plasma Atomic Emission Spectrometer), SPECTRO, Model SPECTRA FLAME (Kleve, Germany). The elements Al, Co and Ni could only be investigated by ICP AES, whereas the elements Mo and Ge were investigated only by AAS. The other elements were detected by both techniques.
3. Results and Discussion
Noni fruit, leaf and soil samples were collected at two campaigns in April and September 2005 at eleven islands in French Polynesia belonging to the archipelagos of the Society Islands and Marqesas. The geographical positions of the sampling sites are given in Table 1. Twelve positions belong to plantations. At the other positions no regular harvest takes place. Within our sampling sites were lava soils, rich in minerals and trace elements, lime soils at beaches and small coral islets and mixed types of soil. The islands of French Polynesia were formed between 0.4 - 5 million years ago by movements of the lithosphere over stationary hot spots in the mantel, resulting in the formation of chains of volcanic islands [19]. Most of the landmass of the islands was formed by basaltic lava and volcanic ash. Soils rich in minerals and trace elements were formed by erosion of this material. Another type of soil is located at beaches and small coral islets (Motus), originating from marine sediments. This soil is dominated by calcium carbonate.
Analyses of seven representative soil samples are shown in Table 2, which contains total analyses of minerals and trace elements as well as metals extractable with 1 M NH4NO3. This fraction is believed to mimic the metals available to the plants. An overview of the elemental composition of the soil samples is also given in Figure 1, which combines five samples of volcanic soil (positions 1, 2, 6, 8, 20) and two of lime soil (position 7, 12) in two separate plots.
The volcanic soils are dominated by SiO2 (31.1% - 54.2%), Fe (9.4% - 21.7%) and Al (6.0% - 12.0%), followed by C (2.1% - 4.7%) and Ca (0.38% - 0.98%). The lowest Ca-concentration (0.038%) was observed in the soil of Position 6. This position shows also the highest Fe-concentration (21.7%). N, P, Mg and Mn-concentrations ranged between 0.1% - 1% and the transition metals varied between 100 - 1000 ppm. The concentrations of the toxic metals Cd and Pb were considerably lower compared to the other trace elements. The Cd concentrations in volcanic soil ranged between 7.1 (position 20) and 15.1 ppm (position 6). Pb-concentrations were below 1.5 ppm, except for position 6 (9.9 ppm). This position is close to a street loop at the island of Moorea with an altitude of 230 m. The street ends at an overlook, called Belvedere, a very popular touristic place with lot of car traffic. The high content of lead and Cd is therefore more likely due to traffic contamination rather than geology.
The lime soil samples were dominated by Ca (31% - 32%) and C (12% - 13%). This is close to the composition of pure CaCO3 (42% Ca, 12% C). The Na-concentration was considerably higher compared to volcanic soil, as expected. The concentrations of the other elements were about 1 - 2 orders of magnitude less compared to volcanic soil. Extremely low concentrations were observed for Cd (0.05 ppm).
Extracts prepared by treatment of soil with NH4NO3 solution reflect the availability of metals from the soil to plants much better then absolute concentrations. The solubility of Na and K in NH4NO3 solution varied between 0.3% - 30% and 1% - 50% of the total concentrations in the soil. The corresponding values for Mg and Al, which are mainly part of the silicate fractions, were 0.1% - 0.4% and 0.0003% - 0.01%. Very low concentrations were also observed for Al in the total element composition of lime soil compared to volcanic soil. The concentrations of Fe in the soluble fractions of volcanic and lime soil were similar, although the total content in volcanic soil was about 100 - 1000 times higher compared to lime soil. The lowest Ca-concentrations in the soluble fractions were observed in the lime soil samples, although the absolute concentrations were much higher compared to volcanic soil. Sample 7 contained much higher concentrations of almost all elements in the ammonium nitrate fraction compared to other locations except for Na, Mg and Ca. This location is a flat area close to the beach at the island of Moorea not far from the harbor.
Linear regression analyses for total contents of metals in the soil samples versus fractions soluble in NH4NO3 did not show significant comparisons for any metal (data not shown). It should however be noted that the pH of the soils has considerable impact on the solubility of metals present as oxides, hydroxides or carbonates. The NH4NO3 soluble fraction does therefore not exactly represent the metal fraction available to plants.
Table 3 shows the metal content of noni fruit puree samples from the above seven locations and its correlation to the soluble metal fractions of soil. Significant correlations could be observed for Al and Pb. The highly significant correlation between the Pb-concentration in noni fruit and soil is caused by the fact that the exceptional high concentration in soil of position 6 is also reflected in the fruits harvested at this position. This demonstrates
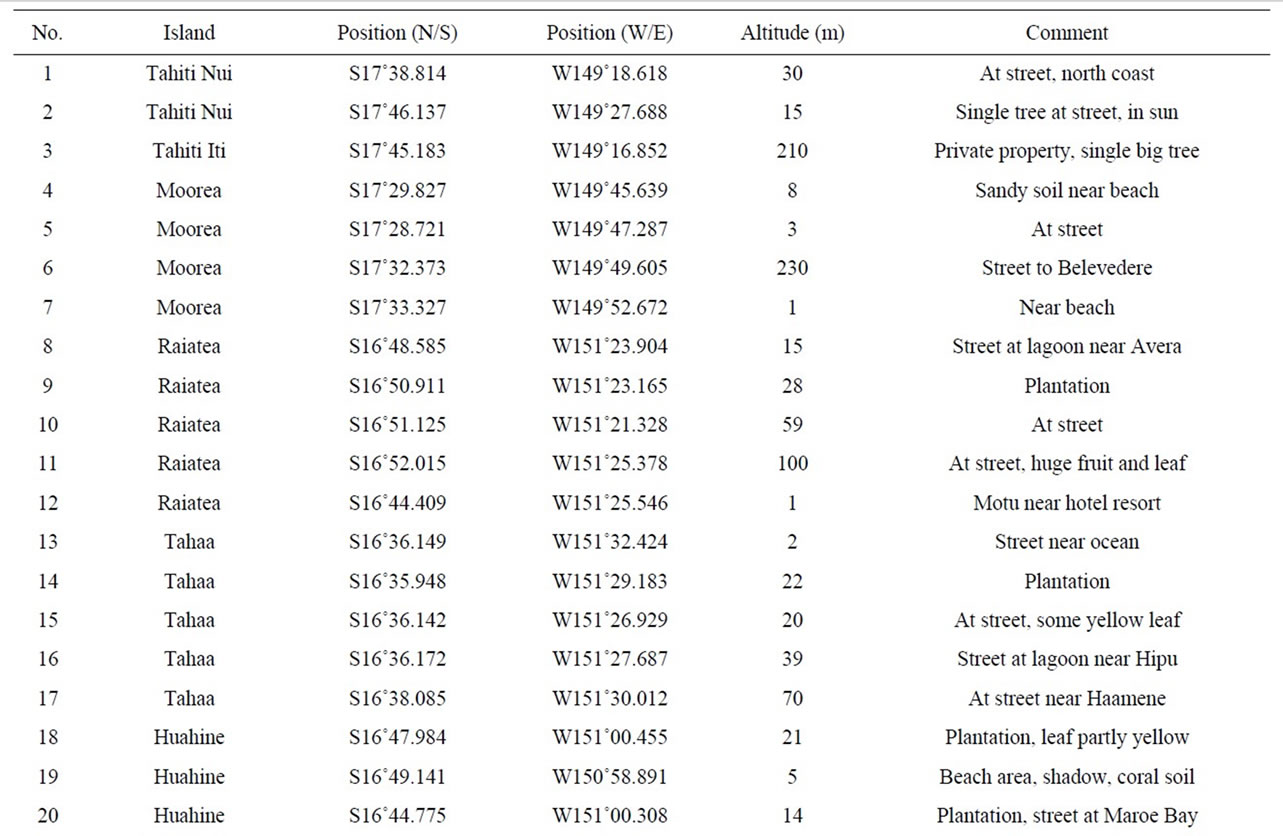
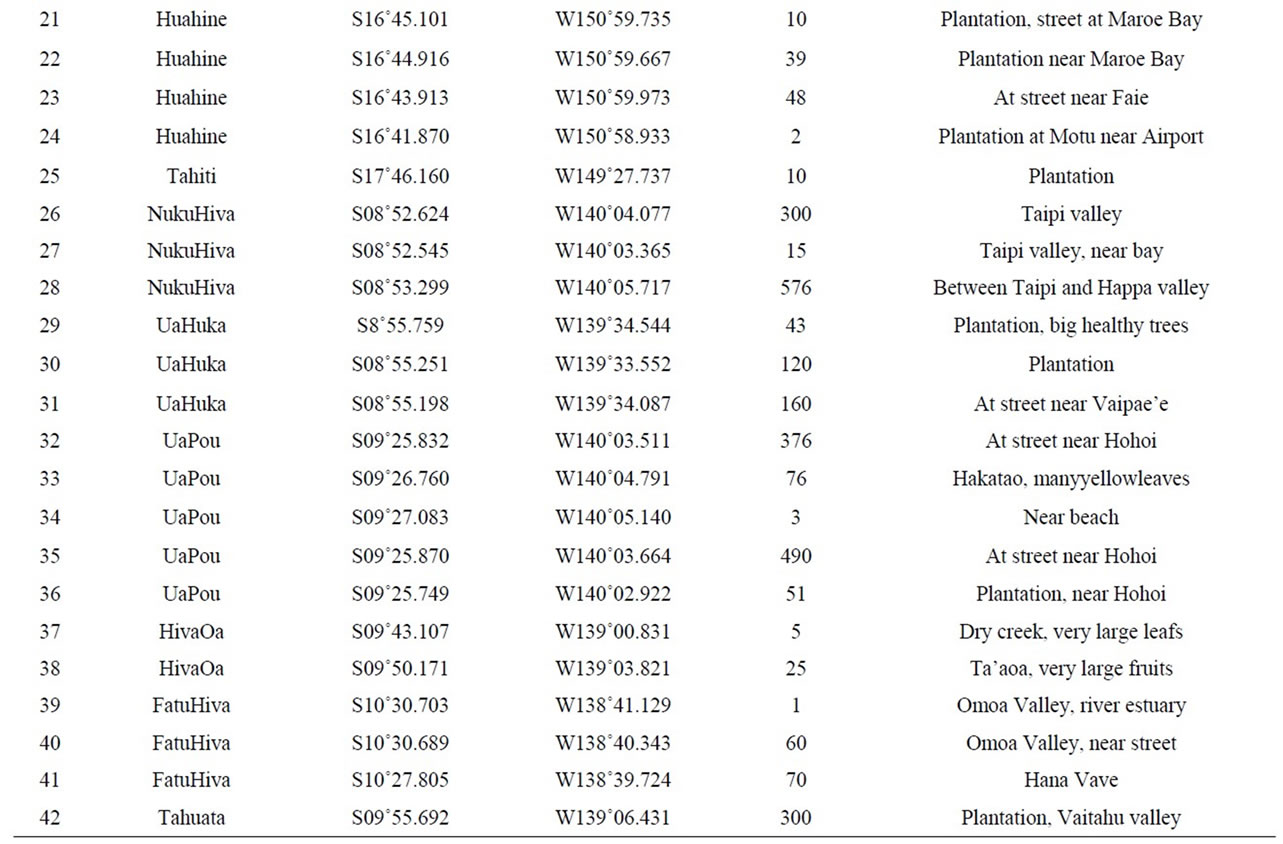
Table 1. List and geographical position of samples.
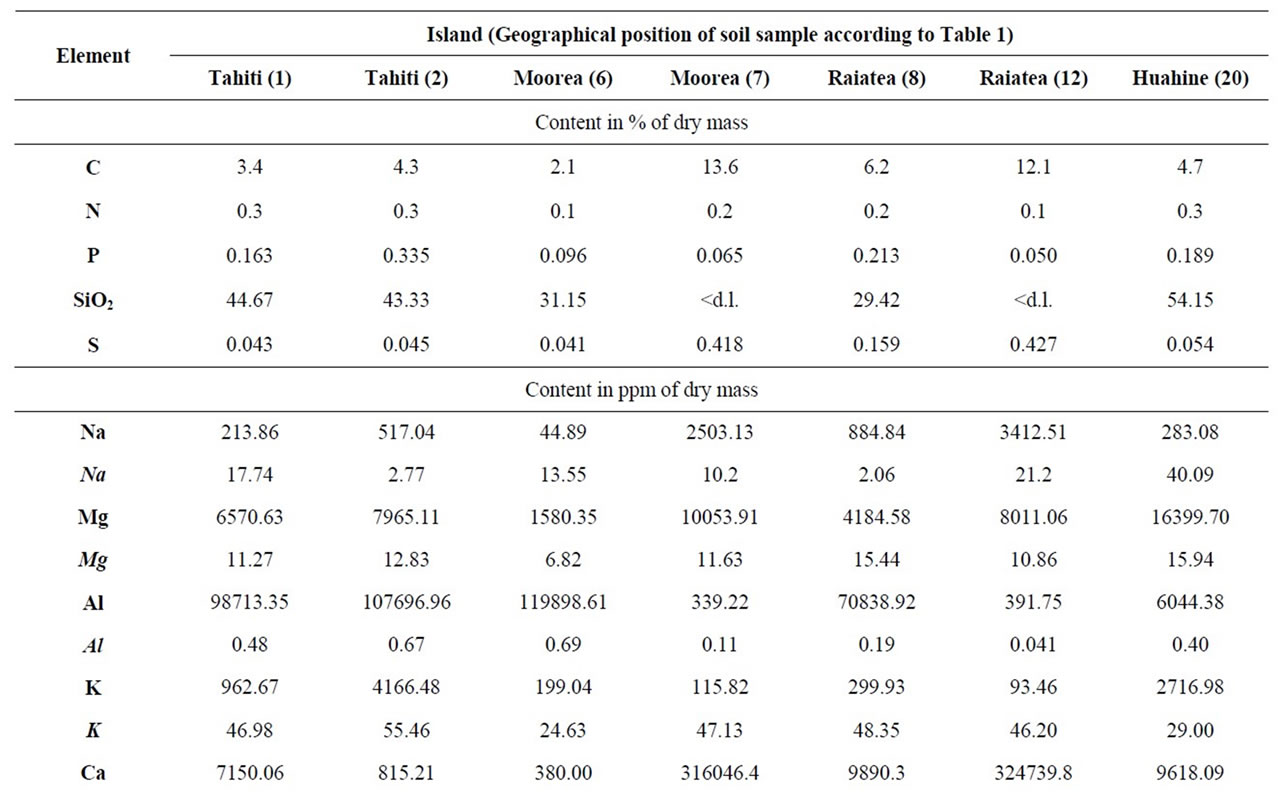
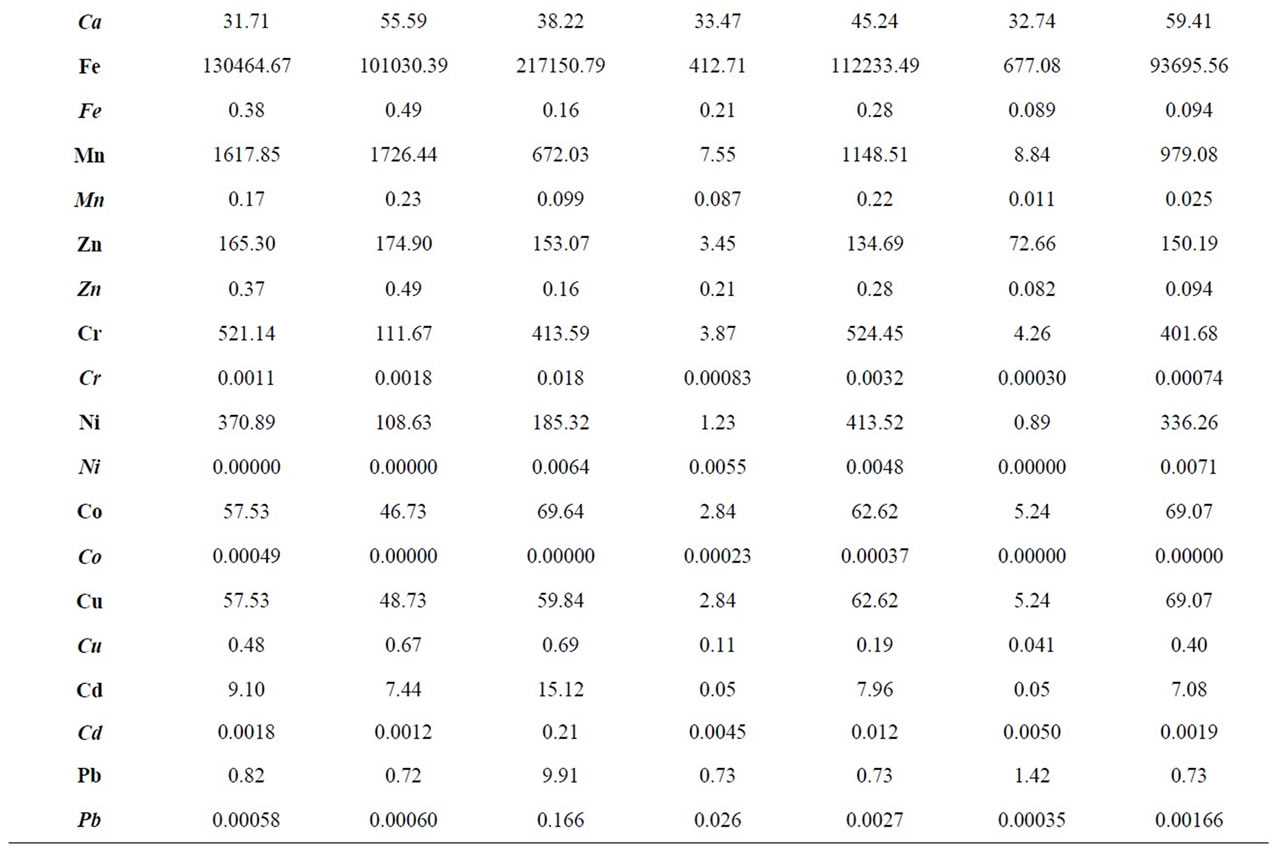
Table 2. Composition of soil samples collected at seven different islands in French Polynesia, analyzed by treatment with nitric acid (65%) at 190˚C for 6 hours or extracted with 1 M NH4NO3 according to DIN Norm 19730 (values in Italic).
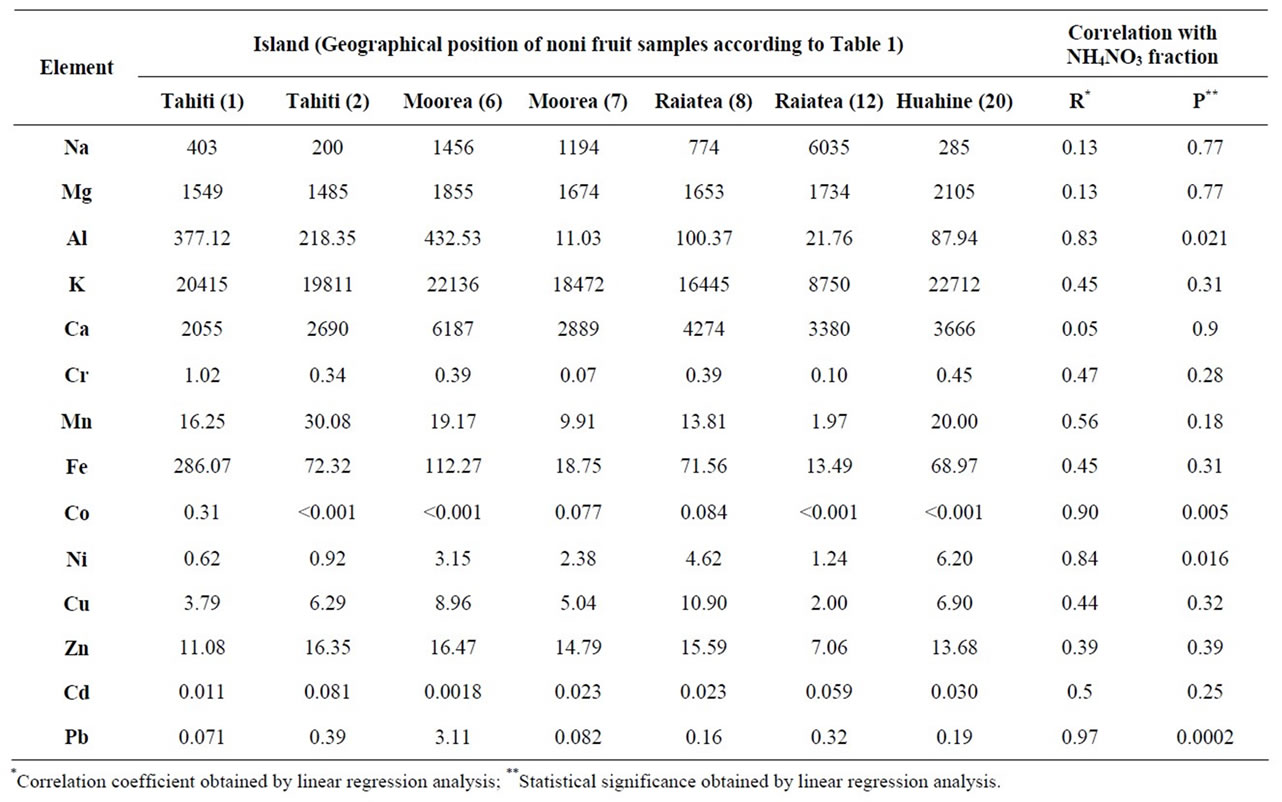
Table 3. Metal content (in ppm of dry mass) of noni fruit puree samples prepared from fruits collected at seven different islands in French Polynesia and statistical correlation with NH4NO3-soluble fraction of soil samples from the same positions.
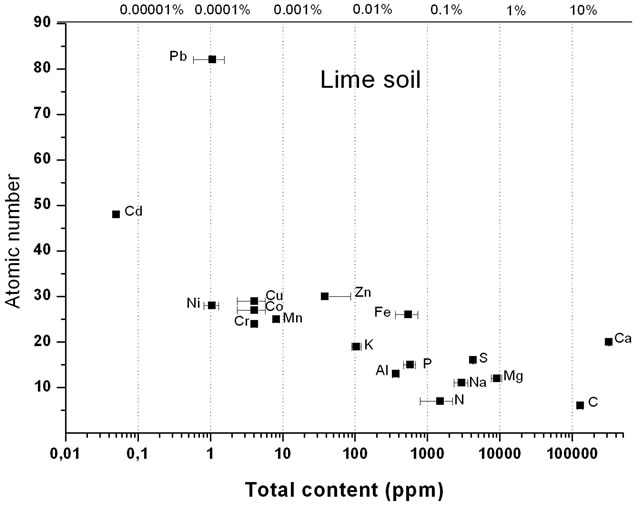
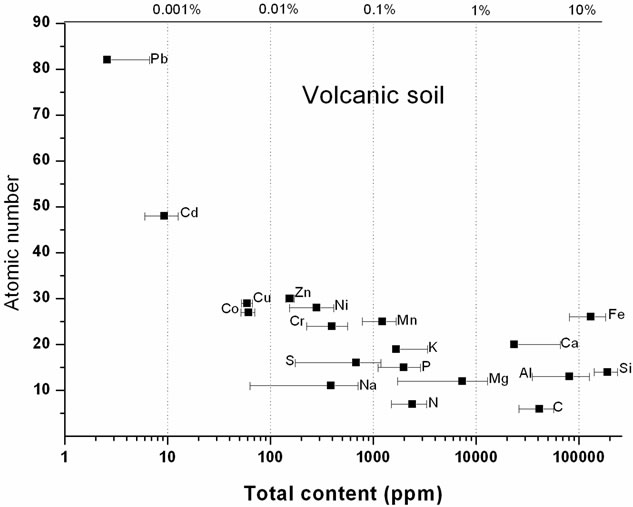
Figure 1. Soil composition of sampling positions 1, 2, 6, 8, 20 (Volcanic soil) and 7, 12 (lime soil). Soil was treated with 64% HNO3 at 190˚C in closed Teflon containers and the elements were analyzed according to materials and methods.
that local contamination with lead due to environmental situations may raise the concentration of this toxic metal in noni fruits and thus in products made thereof. The high correlation coefficients obtained for Co and Ni are artifacts because of the extremely low values which were below the detection limit in a number of the samples.
We also investigated the metal concentrations in noni fruit and leaf samples harvested at 42 positions listed in Table 1. Median concentrations of metals together with minimum and maximum levels are listed in Table 4. This table contains also the means ± SD of the ratios of the metal concentrations of noni leaf versus fruit for all 42 positions. The results of linear regression analyses of metal concentrations in leaf versus fruit samples for all
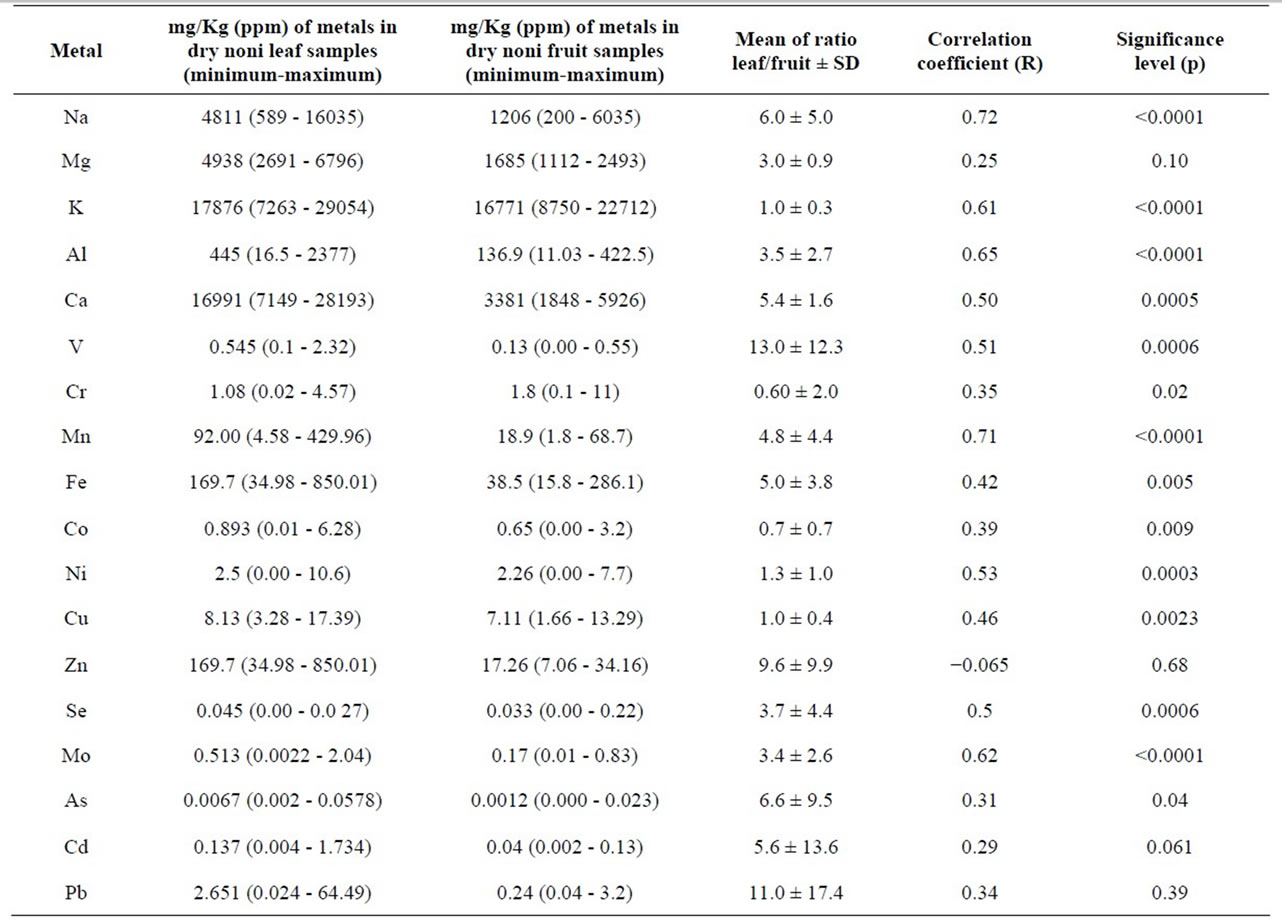
Table 4. Median and range of metal concentrations of noni leaf and fruit samples collected at 42 locations in French Polynesia, mean of the ratio of leaf/fruit concentrations from individual positions and correlation coefficients (R) and statistical significances (p) obtained by linear regression of metal concentrations in noni leaf versus noni fruit.
positions were also performed and the correlation coefficients and p-values listed in the table. Considerable variations between minimum and maximum levels of metals in noni fruit and leaf harvested at different positions were observed. In some cases these differences exceeded two orders of magnitude. The mean concentrations of metals for all positions calculated on the basis of dry matter were higher in leaf compared to fruit samples, except for chromium, although higher concentrations of metals in fruit versus leaf were observed at some individual positions. The K-concentrations in fruit and leaf were almost the same. The most abundant metals were the minerals K, Ca, Mg and Na with concentrations over 1000 ppm. The metals Al, Mn, Fe and Zn were in the range between 10 - 500 ppm and Cr, Ni, Cu and Pb (in leaf) between 1 - 10 ppm. The concentrations of all other metals were below 1 ppm. Linear regression analysis of metal concentrations in leaf versus fruit resulted in R-values > 0.6 and p-values < 0.0001 for Na, K, Al, Mn and Mo. Very poor correlations were obtained for Mg and Zn. Comparisons of the mean metal values in fruit and leaf harvested from wild noni trees versus trees growing on plantations did not result in significant differences for any metal. This shows that no metal deficiency occurred in the soil of noni plantations in French Polynesia after almost ten years of cultivation.
Table 5 shows noni fruit and leaf samples, exceeding the mean concentrations of metals by a factor of 2 - 4, 4 - 10 or more then 10 in relation to the position of harvest. For the metals Mg, K and Ca all values in fruit and leaf were below 2. This was also the case for Fe, Cu and Zn in noni fruits but not leaves. A 2-4-fold excess of the mean concentration in noni fruit was observed for Na at position 1, 5, 6, 19 and 34 and for noni leaf at positions 3 and 34. With the exception of position 6, all of these locations were close to beaches and therefore under the influence of surf and saltwater. A 4-fold excess was observed in fruits from a single tree at a private property at Tahiti Iti with an elevation of 210 m. Elevated concentrations for Al were observed at a couple of positions in the mountains, all at elevations between 160 - 576 m. Iron and zinc both exceeded the mean concentration in leaf by
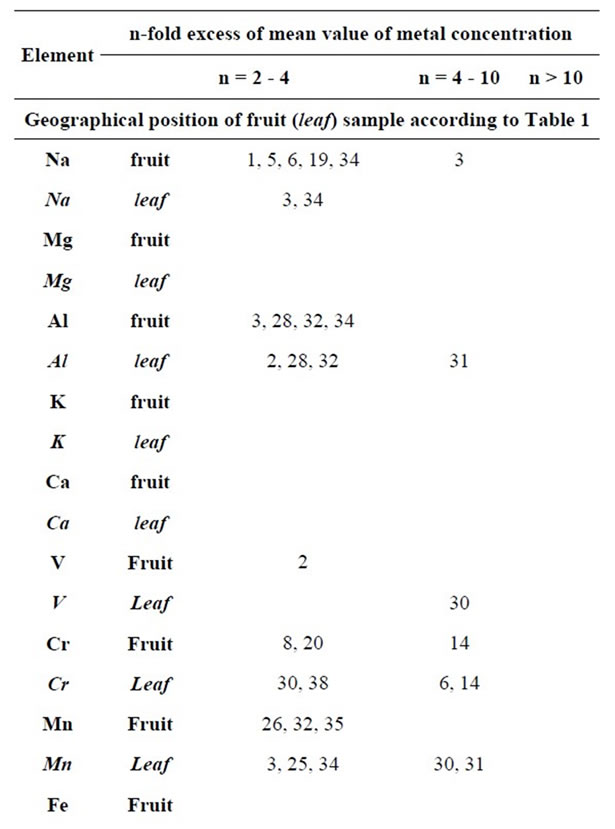
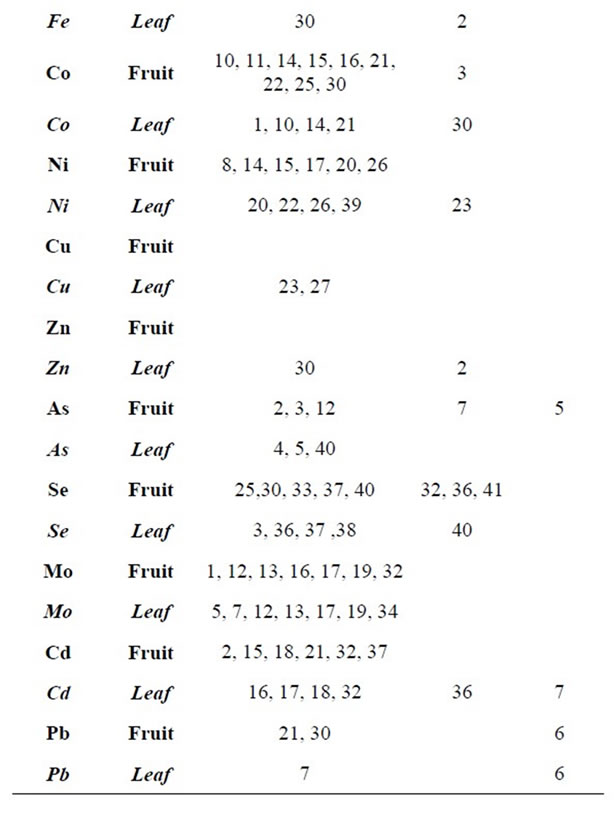
Table 5. Hot spots of metal concentrations in noni fruit and leaf samples harvested on 42 positions in French Polynesia.
a factor > 2 at position 30 and > 4 at position 2. Both positions belong to noni plantations. These elevated values could be due to the use of fertilizers by the farmers, because both elements are essential for plants [20]. Fruits did not show these hot spots. Concentrations of the elements Mn, Co, Ni, Se and As exceeded the mean values by a factor of 2 and 4 in noni fruit and leaf at several positions. Hot spots with concentrations of more than 10-fold of the mean values were only observed for the toxic elements As, Cd and Pb at positions 5, 6 and 7 at the island of Moorea. It should however be noted that these concentrations are still at a normal range compared to fruits in cereals and herbs from other parts of the world [21-23].
Zahir et al. [23] reported about the concentration of the essential elements Fe, Mn, Co, Ni, Cu and Cr and the toxic metals Cd and Pb in various fruits from the Pakistan market. We compared their findings with the corresponding values in noni fruits from French Polynesia. The results are shown in Table 6. Among the fruits from Pakistan were such as apple, apricot, banana, mango, lemon, date and tomatoes, well known worldwide and some with regional distribution, such as chikoo, jaman and neem. The concentration of Zn, Ni and Co were very similar in noni compared to the mixed fruits from Pakistan, whereas the essential elements Fe and Mn were 2-3-fold higher and Cu was about 4-fold higher in noni fruits. In contrast, the concentrations of Cd and Pb in the fruit basket from Pakistan exceeded that of noni fruits by a factor of 6 and 59. This comparison shows that fruits harvested at pristine areas, such as the islands of French Polynesia may contain significant fewer concentrations of toxic metals compared to urbanized areas, while
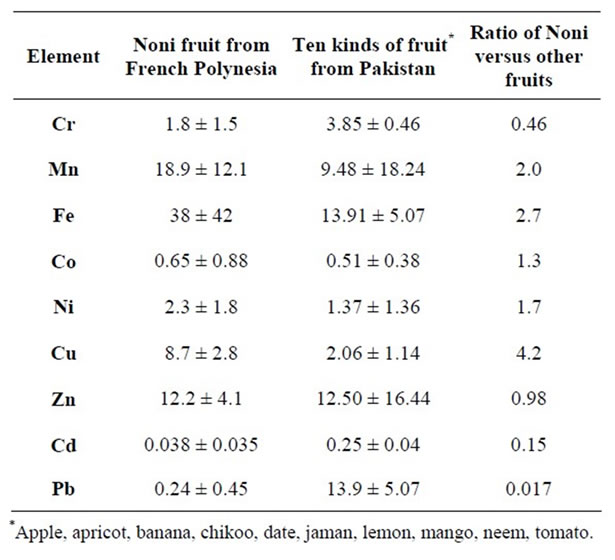
Table 6. Mean of metal concentrations (mg/kg dry weight) ± SD in noni fruits from 42 positions in French Polynesia and from 10 kinds of fruits from Pakistan (data from [22]).
essential elements are present in equal or even higher concentrations.
Although the ancient Polynesian population used all parts of the noni plant, the fruit juice is the most important product used today worldwide. The distribution started in 1996 with a single company, which still supplies more than 90% of the market worldwide. Presently noni juice is also sold by a variety of smaller companies. We have recently published a paper about analytical methods to control the quality of such juices [24]. This method includes the determination of potassium as a marker for a possible dilution of such juices.
We were able to prepare authentically noni fruit juices from 35 out of the 42 positions listed in Table 1. The metal concentrations of these samples (median and range) are listed in Table 7. We also listed the daily requirement of minerals and essential elements for humans, and the amount contributed by consumption of 100 ml of the pure noni juice. The concentrations of the toxic elements As, Cd and Pb in the variety of self prepared noni juices are also listed in this table, together with the maximum permitted levels (MPL) of these elements in fruit juices in the European Community.
If we assume that the water content of fresh noni fruits is approximately 90%, we should expect that the metal content of the noni juices listed in Table 7 is around 10% of that in dry fruit matter listed in Table 4. However, this is not the case. The juices contain only 15% - 70% of the metal concentrations calculated from the corresponding values in fruit puree. This indicates that parts of the metals are tightly bond to fruit pulp. The consumption of fruit puree does therefore provide higher amounts of minerals and essential elements compared to clear fruit juice.
Table 7 also shows the percentage of the daily requirement of metals for an adult human provided by consumption of 100 ml noni fruit juice. The average values are below 10% or even smaller than 1%. Although
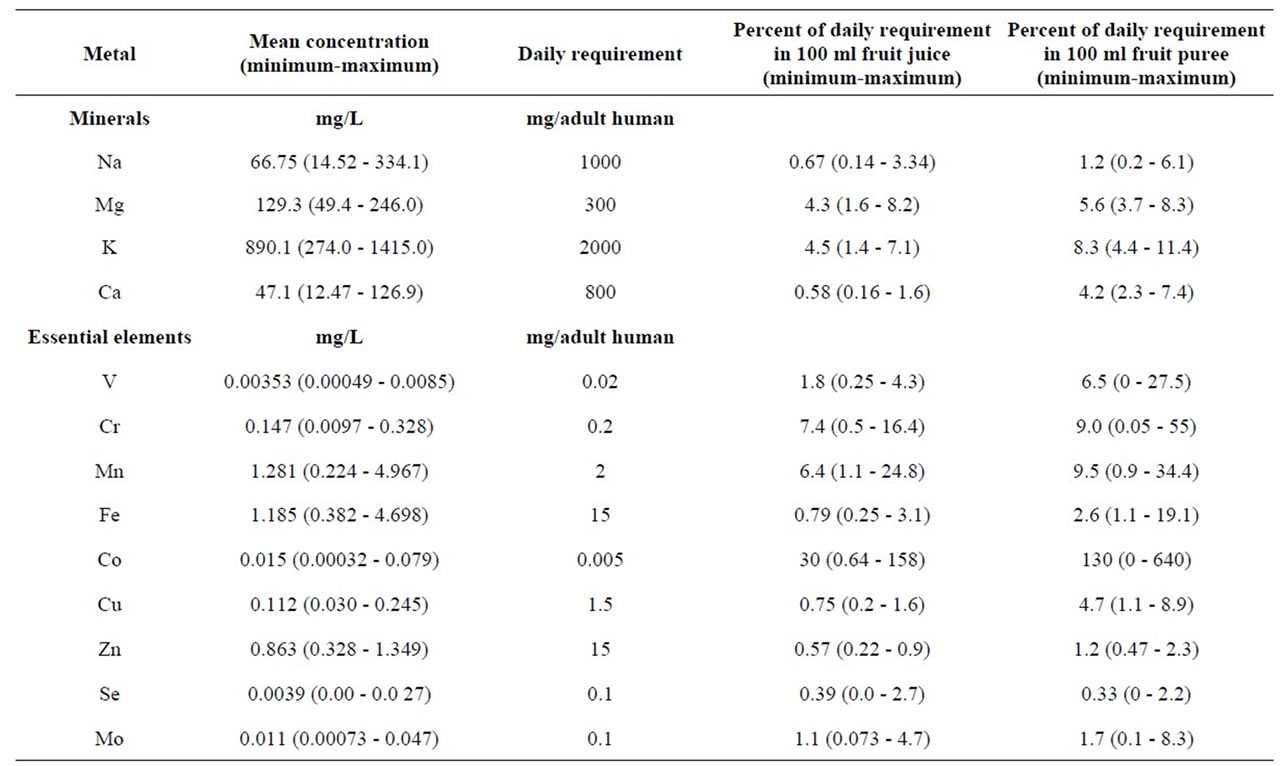
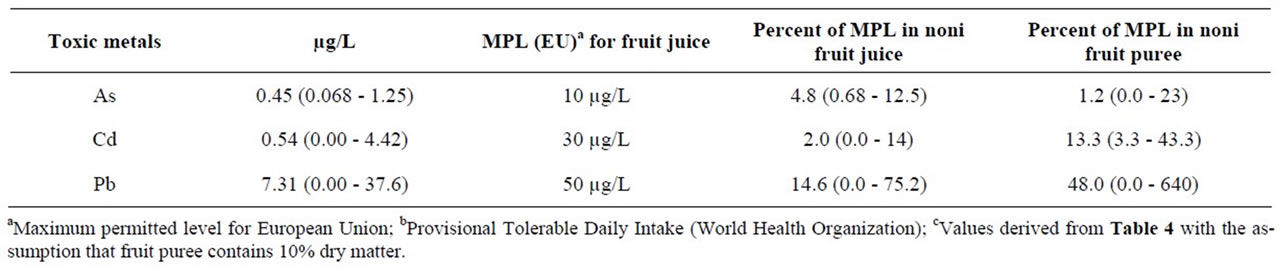
Table 7. Median and range of metal concentration of juice prepared from noni fruits collected at 35 locations in French Polynesia.
the cobalt content of 100 ml noni juice is equal to 30% of the daily requirement, this is not beneficial to humans, who can only utilize this element in the form of cobalamin (vitamin B12), which is almost completely served from food derived from animals. The maximum values for noni fruit juice from certain positions can be much higher than the average values and exceed 10% (Cr, Mn) of the daily requirement. The corresponding values for fruit puree are also listed in Table 7. These values are derived from the metal concentrations in dry fruit puree, shown in Table 4 by the assumption that natural fruit puree contains 10% of dry matter. All median values, except for Se, are greater than 1%. The median support with manganese from 100 ml of noni puree is 9.5% with a maximum of 34% and for chromium the corresponding values are 9% and 55%. Manganese has multiple functions in radical scavenging, bone and cartilage formation and function of the immune system [25]. Trivalent chromium has important functions for glucose metabolism and chromium deficiency can contribute to diabetes [26]. The normal human diet often contains less than the daily requirement of this element [27]. Therefore, additional supplementation of Cr is welcome. From the findings of our analysis we can conclude that the daily consumption of 100 ml of noni fruit puree can significantly contribute to the daily requirement of some minerals and essential elements.
The median concentrations of the toxic elements As, Cd and Pb in noni fruit juices are well below the maximum permitted levels (MPL) for fruit juices in the EU. One hot spot at position 6 (Belvedere at Moorea) reaches 75% of the MPL for lead. The corresponding median values for fruit puree are still in line with European law. Because of a variety of hot spots, the median value for lead is 48% of the MPL, whereas the maximum value exceeds the MPL about more than 6-fold. This example shows that quality control of noni fruit juices and fruit puree is important in order to guarantee the compliance with food law.
We also investigated the metal contents of 16 different commercially available noni juices and compared it to the mean of the metal contents of 35 noni juices, which we prepared from fruits collected at different islands in French Polynesia. The results are shown in Table 8. The potassium concentration of a fruit juice is in most cases indicative of its dilution with water. Most of the commercial noni juices contain some pulp material, which increases the potassium concentration compared to a
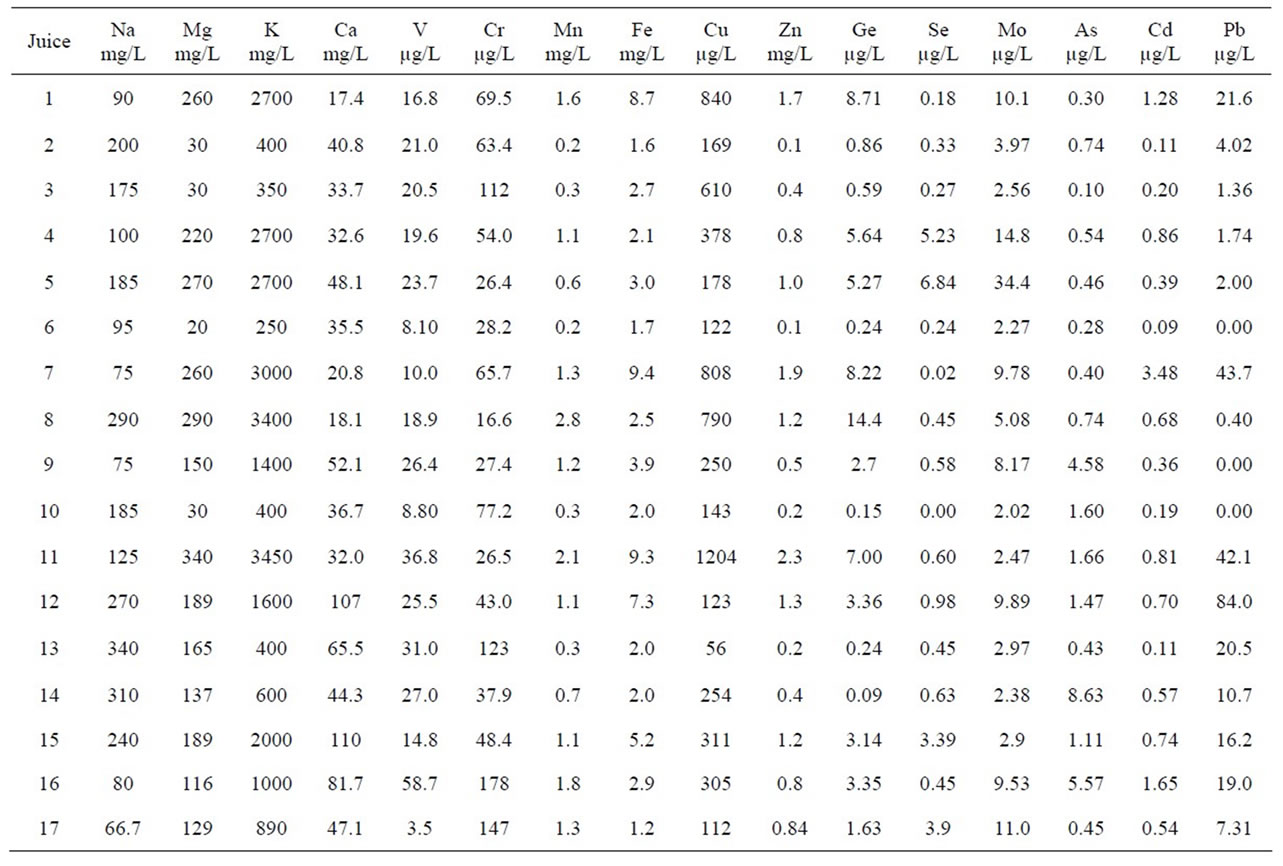
Table 8. Metal content of commercial noni juices (No. 1-16) and mean values of metal content from 35 self-prepared noni juices, harvested in French Polynesia (No. 17).
clear juice. However, juices with potassium concentrations > 2000 mg/L (juice No. 1, 4, 5, 7, 8, 11, 15) clearly represent concentrates. On the other hand, juices with K-concentrations < 500 mg/L (juice No. 2, 3, 6, 10, 13) are certainly diluted. The sodium concentrations of some of the latter juices are higher compared to the control, although the potassium concentrations are lower. This is most probably due to the addition of sodium benzoate, which we could identify in these juices in relatively high concentrations (data not shown). Natural undiluted noni juice is resistant to the growth of microbes. We have noni juice bottles in our lab, which do not show any microbial growth even several years after opening. Dilution of noni juices reduces the shelf live; therefore such juices require the addition of preservatives. European law requires the labeling of preservatives such as benzoic acid; however, none of these juices complied with this law.
Table 9 contains the correlation coefficients and statistical significance values obtained by linear regression of the K-concentrations and the other metals in the variety of the 16 commercial noni juices. Highly significances could be observed for Mg, Mn, Zn and Ge. Therefore the dilution of a certain juice can also be recognized by the comparison of the concentration of these elements with that of the control. Germanium, which is not essential to humans, is nevertheless an excellent indicator of the dilution of fruit juices, because it is almost uniformly distributed in the soil and local hot spots are rare. The metal concentration in juices are normally also not altered by contamination due to processing. However, some companies may add germanium compounds such as Ge-sesquioxide which is suspected to have beneficial biological properties. Because high germanium doses may cause damage of the kidneys and liver [28], this practice is forbidden in the EU, USA and many other countries worldwide. Within our selection of commercial noni juices no extraordinarily high Ge-concentrations could be observed. All values were highly correlated to the corresponding potassium concentration, showing that none of the companies added germanium to their noni juice. However, the concentration of vanadium and iron in the commercial noni juices was considerably higher compared to the control. This could be due to the fact that these metals are components of stainless steel, which is routinely used in factories preparing fruit juices.
Another interesting observation is the fact that some juices with high potassium concentrations (No. 1, 7, 8) have low Ca-concentrations. A possible explanation is that calcium is precipitated as Ca-phosphate, -oxalate or another sparely soluble salt, during the concentration of the juice. Most divergent concentrations in commercial noni juices were observed for copper. The values varied from half to ten-fold of the copper concentration of the control. Copper is often used in agriculture to reduce
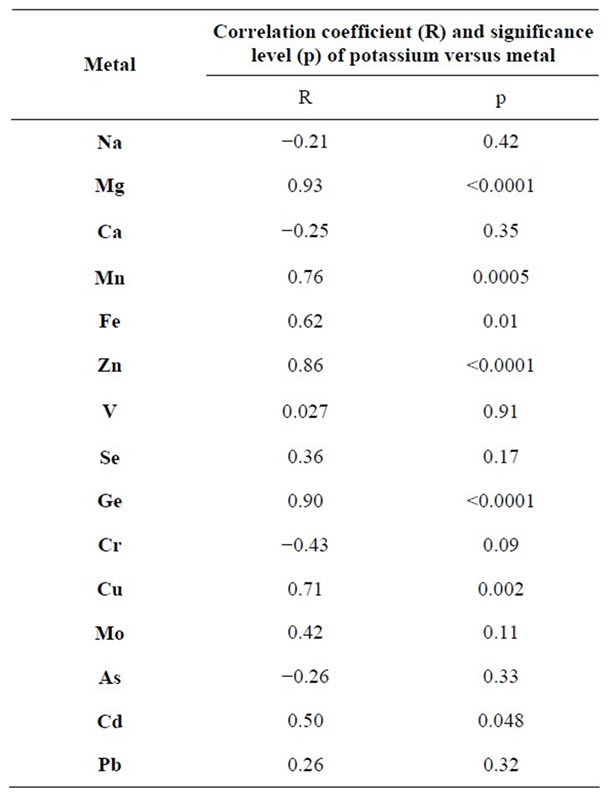
Table 9. Correlation coefficients (R) and statistical significances (p) estimated by linear regression of potassium versus metal concentrations in 16 commercial noni juices available on the European market.
microbial growth. This practice may influence the copper concentration in products derived from such farms. An excess of copper in the soil can reduce the uptake of zinc by plants [20]. However, zinc is essential to plant growth. In order to prevent zinc deficiency, the soil has to be enriched with zinc together with copper. In agreement with this hypothesis is the fact that the juice with the highest Cu-concentration (No. 11) contains also the highest concentration of Zn. The fruits used for the production of this juice were harvested at plantations at Fiji islands.
Great differences were also observed with regard to the concentration of the toxic metals As, Cd and Pb in the different commercial fruit juices. This is also presented in Figure 2, which shows the data as percent of the maximum permitted levels (MPL) for the EU. None of the juices shows Cd-concentrations > 10% of the MPL. Although still compliant with European law, the concentration of As exceeded 50% of the MPL in juices No. 9 and 16% and 80% of the MPL in juice No. 14. The situation of lead was even worse. Juices No. 7 and 11 exceeded 80% of the MPL and juice No. 12 showed a Pb level equivalent to 170% of the MPL. This juice does not comply with European law and should not be present on the market. Whether the high concentrations of Cd and
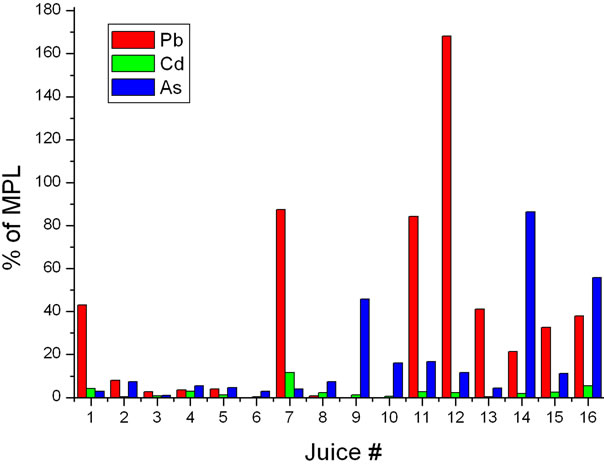
Figure 2. Concentration of toxic metals in commercial noni juices as % of EU Maximum Permitted Levels (MPL) for fruit juices.
Pb are due to agricultural contamination or processing of the juice cannot be decided from our data.
4. Conclusion
The concentration of minerals and trace elements in noni fruits are comparable with other fruits and poorly correlated to the metal content of the soil. Metal concentrations were generally higher in fruit puree compared to clear juices. Relatively high concentrations could be observed in noni fruit puree for manganese and chromium, which are both important essential elements. 100 ml of noni fruit puree can serve for 9% - 34% of the daily requirement of manganese or 9% - 55% of the corresponding amount of chromium. The concentration of K, Mg, Mn, Zn and Ge in commercial noni juices was highly significantly correlated and can be used to demonstrate a possible dilution of the juices. One of the commercial noni juices exceeded the MPL for lead and some others came close to this value.
5. Acknowledgements
This work was supported by a grant from Tahitian Noni International, Provo, Utah, USA.
The excellent technical assistance of Klaus Soehren is gratefully acknowledged. We also like to thank Dr. Norman Loftfield from the Buesgen Institute of Ökopedologie of moderate Climate Zones, Georg-August University, Göttingen, Germany for the performance of the elemental analyses of the soil samples.
REFERENCES
- T. F. Cheeseman, “The Flora of Raratonga, the Chief Island of the Cook Group,” Transcripts of Linnean Society of London, 2nd Series-Botany, Vol. 6, 1903, pp. 261-313.
- A. R. Dixon, H. McMillan and N. L. Atkin, “Ferment This: The Transformation of Noni, a Traditional Polynesian Medicine (Morindacitrifolia, Rubiaceae),” Economic Botany, Vol. 53, No. 1, 1999, pp. 51-68. doi:10.1007/BF02860792
- T. Takahashi and S. Shoji, “Distribution and Classification of Volcanic Ash Soils,” Global Environmental Research, Vol. 6, 2002, pp. 83-97.
- M. Nanzyo, “Unique Properties of Volcanic Ash Soils,” Global Environmental Research, Vol. 6, 2002, pp. 99- 112.
- L. Deenik and R. S. Yost, “Chemical Properties of Atoll Soils in the Marshall Islands and Constraints to Crop Production,” Geoderma, Vol. 136, 2006, pp. 666-681. doi:10.1016/j.geoderma.2006.05.005
- M. Pande, N. Naiker, G. Mills, N. Singh and T. Voro, “The Kura Files: A Qualitatively Social Survey,” Pacific Health Surveillance and Response, Vol. 12, No. 2, 2005, pp. 85-93.
- European Commission, 2003/426/EC, “Commission Decision of 5 June 2003 Authorising the Placing on the Market of Noni Juice (Juice of the Fruit of Morindacitrifolia L.) as a Novel Food Ingredient under Regulation (EC) No 258/97 of the European Parliament and of the Council,” Official Journal of the European Union L 144, 2003, p. 001.
- European Commission, 2008/8108/EC, “Commission Decision of 15 Dec 2008 Authorizing the Placing on the Market of Leaves of Morinda Citrifolia as a Novel Food Ingredient under Regulation (EC) No 258/97 of the European Parliament and of the Council,” Official Journal of the European Union L 352/46, 2008, p. 001.
- D. R. Williams, “Historical Outline of the Biological Importance of Trace Metals,” Journal of Inherited Metabolic Disease, Vol. 6, Suppl. 1, 1982, pp. 1-4. doi:10.1007/BF01811315
- M. J. Tamás and E. Martinoia, Eds., “Molecular Biology of Metal Homeostasis and Detoxification. From Microbes to Man,” Springer, Berlin, 2005.
- V. Mudgal, N. Madaan, A. Mudgal, R. B. Singhand and S. Mishra, “Effect of Toxic Metals on Human Health,” The Open Nutraceuticals Journal, Vol. 3, 2010, pp. 94-99. doi:10.2174/1876396001003010094
- K. Ljung, B. Palm, M. Grandér and M Vahter, “High Concentrations of Essential and Toxic Elements in Infant Formula and Infant Foods—A Matter of Concern,” Food Chemistry, Vol. 127, No. 3, 2011, pp. 943-951. doi:10.1016/j.foodchem.2011.01.062
- C. G. Fraga, “Relevance, Essentiality and Toxicity of Trace Elements in Human Health,” Molecular Aspects of Medicine, Vol. 26, 2005, pp. 235-244. doi:10.1016/j.mam.2005.07.013
- S. M. Reichmann, “The Responses of Plants to Metal Toxicity: A Review Focusing on Copper, Manganese and Zinc,” Occasional Paper No. 14, Australian Minerals and Energy Environment Foundation, 2010.
- C. A. Grant and L. D. Bailey, “Nitrogen, Phosphorus and Zinc Management Effects on Grain Yield and Cadmium Concentration in Two Cultivars of Durum Wheat,” Canadian Journal of Plant Science, Vol. 78, 1998, pp. 63- 70. doi:10.4141/P96-189
- B. B. Clarke and E. Brennan, “Differential Cadmium Accumulation and Phytotoxicity in 16 Tobacco Cultivars,” Journal of the Air & Waste Management Association, Vol. 39, 1989, pp. 1319-1322.
- J. Liu, Q. Zhu, Z. Zhang, J. Xu, J. Yang and M. H. Wong, “Variations in Cadmium Accumulation among Rice Cultivars and Types and the Selection of Cultivars for Reducing Cadmium in the Diet,” Journal of the Science of Food and Agriculture, Vol. 85, 2005, pp.147-153. doi:10.1002/jsfa.1973
- T. Arao, N. Ae, M. Sugiyama and M. Takahashi, “Genotypic Differences in Cadmium Uptake and Distribution in Soybeans,” Plant and Soil, Vol. 251, 2003, pp. 247-253. doi:10.1023/A:1023079819086
- V. E. Neall and S. A. Trewick, “The Age and Origin of the Pacific Islands: A Geological Overview,” Philosophical Transactions of the Royal Society, Vol. 363, No. 1508, 2008, pp. 3293-3308. doi:10.1098/rstb.2008.0119
- L. R. Hawl and W. E. Schmid, “Uptake and Translocation of Zinc by Intact Plants,” Plant and Soil, Vol. 27, 1967, pp. 249-260. doi:10.1007/BF01373393
- I. Alonso and C. García-Olalla, “Mineral Composition of Soils and Vegetation from Six Mountain Grassland Communities in Northern Spain,” Journal of the Science of Food and Agriculture, Vol. 73, No. 2, 1997, pp. 200-206. doi:10.1002/(SICI)1097-0010(199702)73:2<200::AID-JSFA701>3.0.CO;2-L
- J. Jorhem, C. Astrand, B. Sundström, M. Baxter, P. Stokes, J. Lewis and K. Grawé, “Elements in Rice from the Swedish Market: Cadmium, Lead, and Arsenic (Total and Inorganic),” Food Additives and Contaminants, Vol. 25, No. 3, 2008, pp. 284-292. doi:10.1080/02652030701474219
- E. Zahir, I. Naqvi and S. Uddin, “Market Basket Survey of Selected Metals in Fruits from Karachi City (Pakistan),” Journal of Basic and Applied Sciences, Vol. 5, No. 2, 2009, pp. 47-52.
- S. Basar and J. Westendorf, “Identification of (2E, 4Z, 7Z)-Decatrienoic Acid in Noni Fruit and Its Use in Quality Screening of Commercial Noni Products,” Food Analytical Methods, Vol. 4, No. 1, 2011, pp. 57-65. doi:10.1007/s12161-010-9125-9
- A. B. Santamaria, “Manganese Exposure, Essentiality and Toxicity,” Indian Journal of Medical Research, Vol. 128, No. 4, 2008, pp. 484-500.
- Z. Krejpcio, “Essentiality of Chromium for Human Nutrition and Health,” Polish Journal of Environmental Studies, Vol. 10, No. 6, 2001, pp. 399-404.
- R. A. Anderson, “Chromium as an Essential Nutrient for Humans,” Regulatory Toxicology and Pharmacology, Vol. 26, No. 1, 1997, pp. 35-41. doi:10.1006/rtph.1997.1136
- S. H. Tao and P. M. Bolger, “Hazard Assessment of Germanium Supplements,” Regulatory Toxicology and Pharmacology, Vol. 25, No. 3, 1997, pp. 211-219. doi:10.1006/rtph.1997.1098
NOTES
*Corresponding author.