Technology and Investment
Vol.2 No.1(2011), Article ID:3982,12 pages DOI:10.4236/ti.2011.21002
A Study on the Factors That Influence Innovation Activities of Spanish Big Firms
Department of Economic Analysis I, Universidad Nacional de Educación a Distancia, Madrid, Spain
E-mail: agomezvieites@gmail.com, jcalvo@cee.uned.es
Received June 5, 2010; revised November 2, 2010; accepted December 3, 2010
Keywords: Innovation Activities, Information Management, Technology Management, R&D Investment, R&D Personnel, PLS, Structural Equation Model (SEM)
Abstract
The main goal of this research is to study the role of several factors and firms’ resources that could have had an impact on the development of innovative activities of Spanish big firms, exploring how these factors can help to achieve success through innovation and improving business performance. We propose a new model to analyze the relationships between a set of organizational, technological, financial and information-based resources, as well as other aspects such as company’s cooperation. We employ a Structural Equation Model and the PLS technique in order to validate the theoretical model proposed in this research. The data come from the Spanish National Statistics Institute’s Survey on Firms Technological Innovation. The sample is composed by 2224 observations referred to firms with 200 or more workers. The main results show that human and financial resources and cooperation affect positively R&D activities. At the same time R&D, information management and technological resources have a positive effect on innovation. Finally, R&D activities, innovation results (product and process innovation) and information management influence business results.
1. Introduction
The relationships between firm’s characteristics, innovation behavior and business performance have been studied by many authors. In fact, the first reference in economic literature related to econometric analysis of R&D activities is Griliches’ technical knowledge production function [1]. Griliches’ function includes the typical productive factors and, additionally, it incorporates another one named “technological capital”, depending on R&D firms’ expenditure, Universities R&D, and Technological Centers’ activities. This production function has been used in several studies [2-5].
Nevertheless, Griliches’ function does not consider all the activities included in innovation process, which is multidimensional and interactive [6]. R&D is only a part of innovation expenses; from the birth of the idea to complete development, and approaching innovation activity by exclusively R&D expenditures involve underestimation, especially in small firms and traditional Industries [7,8]. In fact, Calvo in a study employing Spanish manufacturing firms [8], obtained that three quarters of process innovation firms did not have R&D personnel and more than a half of product innovative firms did not expend in R&D.
At the same time, numerous models have been proposed to study the relationships between innovation behavior and firms’ performance. Hurley and Halt analyze innovation activities considering that some structural and process characteristics (size, resources, age, planning, development and control of activities, information management, etc.) influence innovation capacity [9]. Moreover, cultural characteristics (market orientation, participative decision process, and so on) affect innovation receptiveness. The innovation capacity, its receptiveness and structural process, and cultural characteristics determine firm’s competitive advantage.
Other authors [10,11] emphasize the relevance of organizational resources. These authors suggest that firms’ innovative projects are the result of an accumulation of resources, generating new ones especially knowledge.
In Spain, Camisón [12] maintains that firms’ competetive advantage is based on resources and capacities that are difficult to imitate by other firms. He proposes a model (Figure 1) where organizational characteristics influence innovation behavior, and this affects firms’ performance:
Following Camisón’s proposal, Hernández & de la Calle establish a more detailed design of the relationships (Figure 2) [13]:
Therefore, it is clear that approaching innovation by R&D underestimates firms’ innovative capacity, obliging to introduce a new set of variables. At the same time, innovation attitude and results affect firm’s economic performance. Those are the hypothesis we support and model in this article.
2. Structural Model Proposed by the Authors
In this article we propose a structural model where different elements (contingent factors, human, organizational and financial resources, cooperation and information management) affect innovation activities. Those activities determine innovation results, affecting firm’s performance.
The most distinguishing feature of the model is versatility, breaking the linear structure estimation of the relationship between R&D, innovation and business performance. In our model there is a more flexible design: first, it uses latent variables, also named constructs, obtained from observed variables; secondly, it is very versatile and bendable since it defines different types of causality relationships between those constructs.
The model is represented in Figure 3.

Figure 1. Camisón’s model (1999).
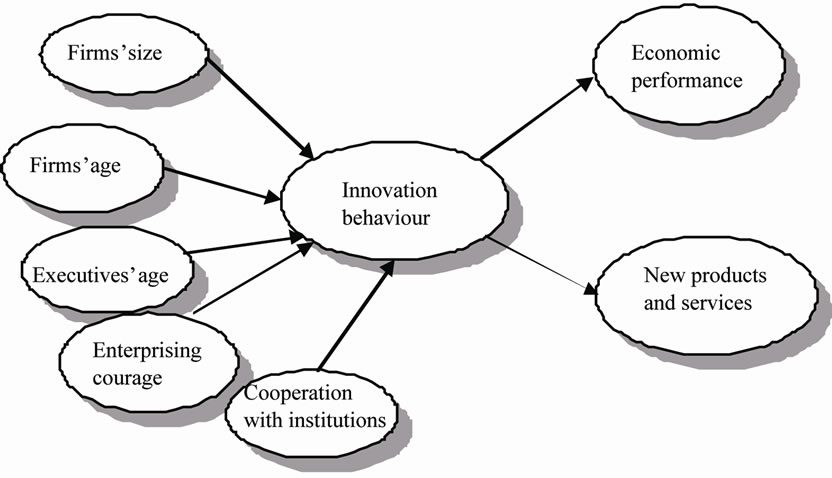
Figure 2. Hernández & de la calle (2006).
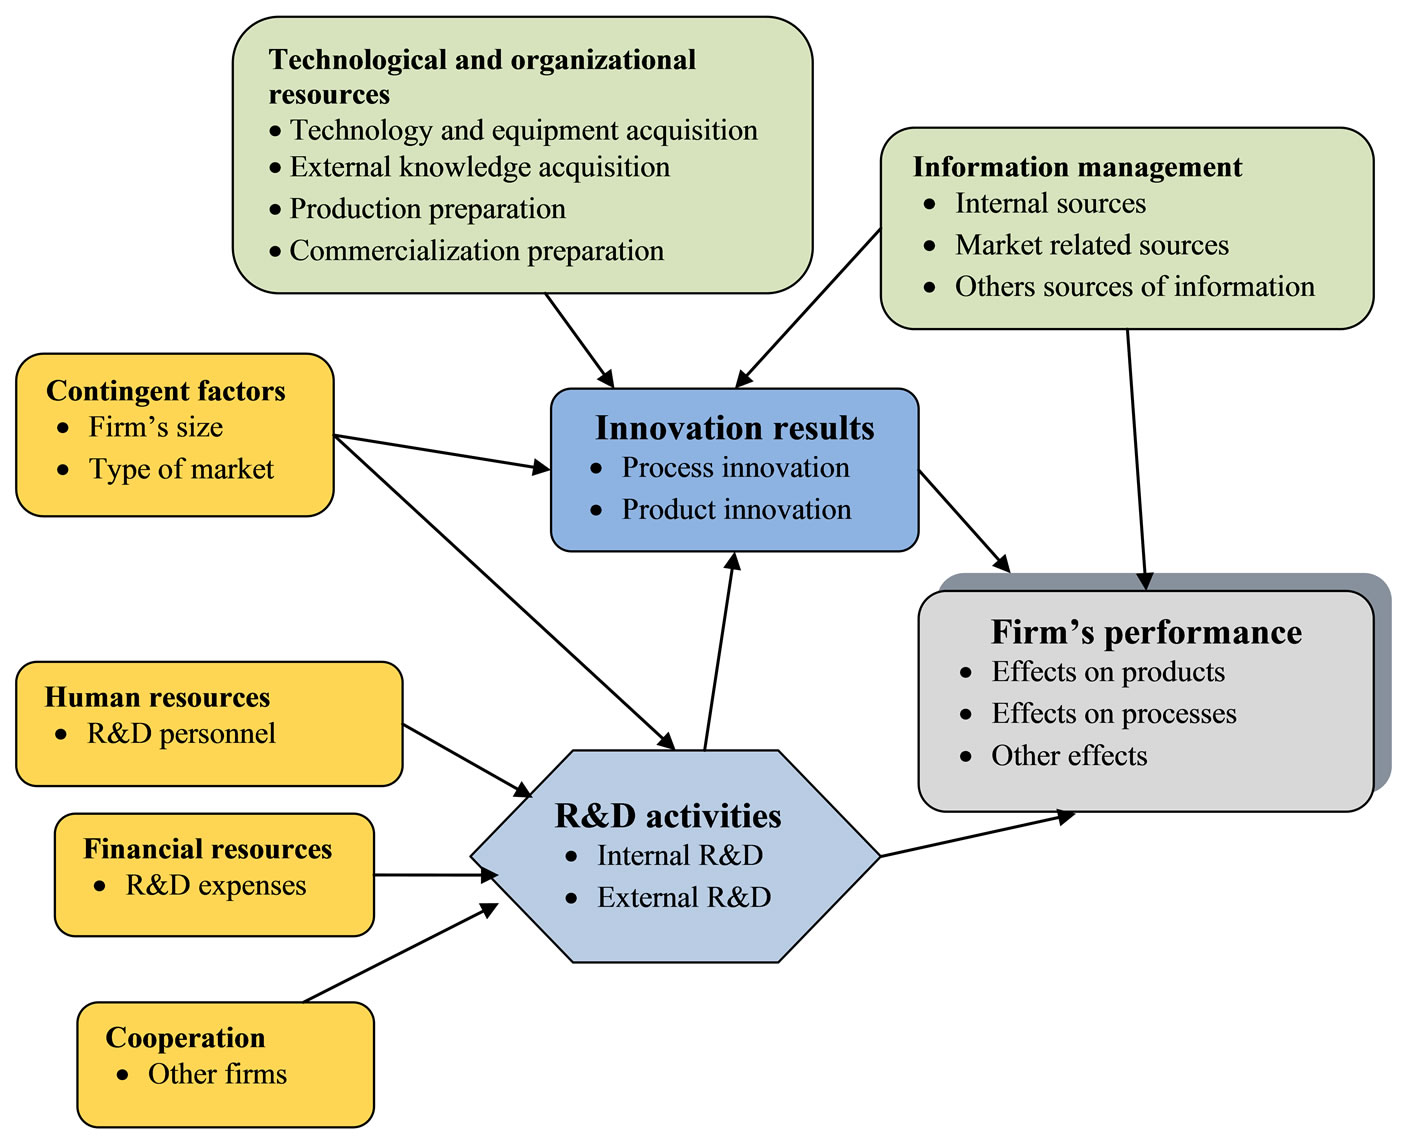
Figure 3. Model proposed by the authors.
The model we propose defines three constructs (latent variables build up from observed variables) affecting R&D activities: “Human resources”, defined by one variable: R&D personnel (PIDT3); “Financial resources”, approached by R&D expenses (GTID2); and “Cooperation”, observed by one variable, cooperation with other firms (COOPERA).
“R&D activities” construct is attained using two variables: internal R&D activities (IDINTERN2) and external R&D activities (IDEXTERN2). They affect innovation results as good as firm’s performance.
The model also considers “Contingent factors”, obtained from the observed variables size (TAMANO2) and type of market (MDO2), and that have a significant impact both on “R&D activities” and “Innovation results”.
“Innovation results” is another latent variable obtained from two experiential variables: product innovation (INNPROD) and process innovation (INNPROC2). It depends on four constructs: “R&D activities”, “Contingent factors”, “Technological and organizational resources” and “Information management”.
“Technological and organizational resources” is a latent variable built up using four observed variables: technology and equipment acquisition (GMAQUI3), external technological knowledge acquisition (GTECNO3), production preparation (GPREP3) and commercializetion preparation (GMARKET3).
“Information management” is another latent variable achieved from three information variables: use of internal information sources (FUENTE1_2), market related sources (FUENTES_MERCADO), and other sources of information (FUENTES_OTRAS).
Finally, firms’ performance is the last construct, defined as a latent variable obtained from observed variables effects on products (EFECTO_PRODUCTOS), effects on processes (EFECTO_PROCESOS) and other effects (EFECTO_OTROS). We assume that firm’s success can be explained by R&D activities, Innovation results and Information management constructs.
The justification for different variables included in the model and their relationships are explained in the following paragraphs.
2.1. Contingent Factors: Company’s Size and Market Structure
The relationship between size and innovation has been studied by many researchers [7,14-18], without having achieved a consensus. Thus, on one side a large group of authors note that the firm size positively affects its innovative behavior [17,19]. In contrast, other authors such as [16,20] support the existence of a negative relationship between size and innovation. In particular, Audretsch suggests that small firms are not necessarily in a disadvantage situation compared to larger, since the ability to innovate allows small businesses to offset the advantages of large scale [21,22].
In this work we adopt an eclectic position, because although we believe there is a positive relationship between size and R&D activities, we make no assumption, however, on its direct effect on innovation. We are suggesting that size influences R&D activities, as these activities require substantial investment, but at the same time, we assume that small firms are able to compete on an equal footing in terms of innovation. In fact, small businesses may obtain innovations despite not having carried out systematic R&D activities, as it is acknowledged by the Oslo Manual (2005) and has been contrasted through empirical evidence.
Regarding market structure and competitive intensity, several authors studied the influence of different variables, such as the industrial concentration, barriers to entry, environment attractiveness, etc. [23,24]. Following this previous studies, in this work we include a variable that tries to analyze how market’s structure (defined as the extent of the market the firm sales its products: local, national, international…) has a direct influence on innovation activities.
In this work we can not consider company’s age as a contingent factor, since there is no variables available in the data obtained from the database PITEC 2006 (i.e., company’s age is not included among the available variables of this study, due to the anonymization process).
For the same reason, we can not include in our model a variable related to the type of firm’s ownership.
2.2. Human and Organizational Resources
As Hurley and Hult defend in their work [9], human and organizational resources of a company directly affect its ability to innovate. In numerous works the authors include variables related to personnel dedicated to R&D and other organizational issues: centralization, specialization, formalization [19,25] or related to the development of human resources.
In our study we also try to specifically analyze the role of human and organizational resources related to R&D within the company. To do this we only consider one factor: personnel engaged in R&D activities (the share it represents in total employment).
2.3. Financial Resources
One of the most common indicators used to evaluate the commitment of an organization with the R&D is the level of expenditure dedicated to this activity [1,8,26].
Given this background, the proposed model also includes the role of financial resources to support R&D in the company, as a percentage of business turnover.
2.4. Collaboration with Other Agents
Since innovation is effectively conceived as an interacttive learning process, many authors like Narula and Dunning argue that collaborative activities between different agents of a National Innovation System have a great importance to achieve economies of scale, avoiding duplication of efforts and promoting the dissemination of the results of innovation [27]. Other studies have shown that cooperation in R&D usually bring significant benefits to businesses [27-30].
Therefore, taking into account the theoretical framework and previous we also consider the importance of collaboration between the company and other actors in explaining its ability to develop R&D.
2.5. Technology Resources
Following the initial approach of references such as [9,31], and taking into account the methodology proposed by the Oslo Manual (2005), we also included in our model variables related to the technology available at the company as a key factor in explaining its innovative capacity.
As we have said, we include the role of technology resources by means of four variables: acquisition of new technological equipment to support innovation, acquisition of external technological knowledge, production preparation and commercialization preparation.
2.6. Information and Knowledge Management
In a global, complex and very dynamic economy, companies must pay much more attention to a growing number of information sources in other to be prepared for changing conditions in markets, launch of new products and technologies and an increasing competence all over the world.
Freeman suggests that innovation should be seen as an interactive process in which a company acquires knowledge through its own experience in the design, development, production and marketing of new products, constantly learning from its relationships with various external sources: customers, suppliers and other organizations such as universities, technological institutes, consultants, etc. [32].
Other authors such as [15] include in their analysis the role played by information management to carry out innovations, distinguishing between internal and external sources (customers, suppliers, scientific and technological studies, market surveys, etc.).
Considering all this previous references and theoreticcal background, we introduce in our model the role of information and knowledge management as an element that could be of particular importance in the innovative behavior of the company. This is done using three factors related to information management: the use of internal information, the use of market related sources of information (clients, providers and competitors) and other sources of information (scientific reviews, industrial associations, conferences, etc.).
2.7. R&D Activities
Given the framework of the Frascati Manual and the Oslo Manual [33,34], R&D activities are included within the list of activities considered necessary for technological innovation1.
Moreover, the interactive model [6] considers R&D activities as a tool that can be used to solve problems occurring during the processes of innovation, being able to enter the process at any phase.
Therefore, our model considers the role played by R& D activities as a key factor that can contribute positively to the success in obtaining innovation, but R&D is not a requirement or prerequisite for success in innovation process, as it was suggested in the linear model of innovation.
In our work we also analyze the direct impact R&D activities can have in innovation results and even in firm’s performance, as these activities could contribute to the achievement of radical innovations that provide greater competitive advantage [18,35-39].
The construct that is included in our model in order to take into account the role of R&D is defined by two variables: internal R&D activities and external R&D activities.
2.8. Innovations Results
Our proposed model includes a construct devoted to innovations results, distinguishing between product innovations and process innovations. This element depends not only on the R&D activities carried out by the company, but also other factors related to the technology incorporated by the company or the management of information and knowledge.
Furthermore, in accordance with the contributions of major authors who have analyzed the processes of innovation, it is considered that these innovations have a positive impact on organizational performance [15,18, 34,40-45].
2.9. Business Performance
Following the Oslo Manual, in our model business performance is determined using three indicators: the effects of R&D activities and innovation on products, the effects of R&D activities and innovation on processes and other effects on firms’ performance.
“Effects on products” is measured taking into account the following variables:
• Increase of products portfolio.
• Increase of market share.
• Products quality improvement.
• Production flexibility improvement.
“Effects on processes” is analyzed through the following variables:
• Production flexibility improvement.
• Increase of production capacity.
• Labour costs reduction.
• Raw materials and energy saving.
Finally, “other effects” is included to take into account these other variables:
• Environmental impact reduction.
• Regulations compliance.
3. Methodology for Studying and Validating the Proposed Model
In order to analyze and evaluate the model we have applied PLS technique to the Structural Equations Model (SEM) defined in Figure 3.
As we have said before, the model establishes multiple relationships between endogenous and exogenous variables taking into account, at the same time, that there are several interactions between dependent and independent variables. Therefore, the analysis technique is Structural Equations Model [46].
In SEM we combine a predictive approach, typical of classic econometric techniques, with a psychometric methodology, applying factorial analysis to obtain latent variables (non observed variables named constructs) from observed ones. Therefore, in a SEM we consider two types of models:
1) A model of measure applying factorial analysis. With this model we can observe the consistency and strength of theoretical constructs. Those constructs can be composed by reflective or formative indicators [47]. In our model all of them, with the exception of firm’s performance, are generated from formative variables.
2) A structural model to analyze the causality interactions between independent constructs (exogenous) and dependent ones (endogenous).
Moreover, since the theoretical model proposed is exploratory and we use Boolean and categorical variables without any previous assumption about data distribution, we apply Partial Least Squares (PLS) technique.
In PLS reflective indicators are determined by the construct and they covariate. That is why we should employ factorial loads to evaluate those constructs. On the contrary, constructs based on formative indicators are a function of those items, and they do not need to be correlated. Latent variables with formative indicators have to be analyzed using their weights.
Therefore, if we want to evaluate a PLS model we should follow two stages [48]:
1) Study of validity and reliability of the model of measure: in this phase it is necessary to analyze if theoretical concepts (approached by constructs) are correctly measured by observed variables.
2) Evaluation of structural model. In this second stage we study the relationships between constructs. So, we should focus on the following questions:
a) Estimate the share of endogenous variables’ variance explained by exogenous constructs.
b) Evaluate the influence of independent variables in dependent variables’ variance.
The last factor we should consider in this kind of studies is sample’s size, which depends on the complexity of the model (number of constructs and indicators, and structural relations). A convenient rule establishes that to determine the minimum sample we should multiply by 10 either the number of indicators included in the most complex formative construct (3 in our case) or the highest number of constructs that affect an endogenous construct (4 in our case).
4. Empirical Data Used to Validate the Model
In order to validate the proposed model we use data coming from PITEC 2006. This is a database obtained from the Spanish National Statistics Institute’s Survey on Firms Technological Innovation2.
The Technological Innovation Panel (PITEC) is a statistical instrument for studying the innovation activities of Spanish firms over time. The data base is being carried out by the INE (The National Statistics Institute), which counts on advice from a group of university researchers and the sponsorship of FECYT and COTEC. Begun in 2004, the final aim of this project is to improve the statistical information available on firms’ innovation activities, and the conditions for scientific research on said topic.
Except for the anonymization of a set of variables, the files available on the web site correspond with the files in the hands of the INE. This anonymization is necessary in order to avoid the disclosure problem (i.e., the possibility of identifying firms through the data).
We employ 2224 observations referred to firms with 200 or more employees (Spanish big firms), with or without innovation activities. This sample is representative, since it covers 73% of all Spanish firms with 200 or more employees (according to data referred to 2003), and the sample design allow for inferences at the country leve l.
The main characteristics of the sample are shown in Table 1.
5. Discussion of Results and Model Validation
As we said, we employ PLS technique to estimate Structural Equations Model3. The main results of the study are included in next graph (Figure 4):
First we present regression weights and factorial loads for different constructs, since in order to evaluate the model we need to employ loads for reflective indicators and weights for formative variables (Table 2).
Regression coefficients (path values) between exogenous constructs (independents) and endogenous ones (dependent) are included in the following (Table 3).
In order to evaluate the consistency of the model of measure we employ the following tests:
1)Reflective indicators
a) Liability of each item evaluating its factorial load. Carmines and Zeller (1979) establish the criterion that loads should be bigger than 0.707. In our case firm’s performance variables satisfy this constrain since effect on products = 0.915, effect on processes = 0.924 and other effects = 0.882.
b) Composite reliability. It is use to test internal consistency. The criterion implies that:
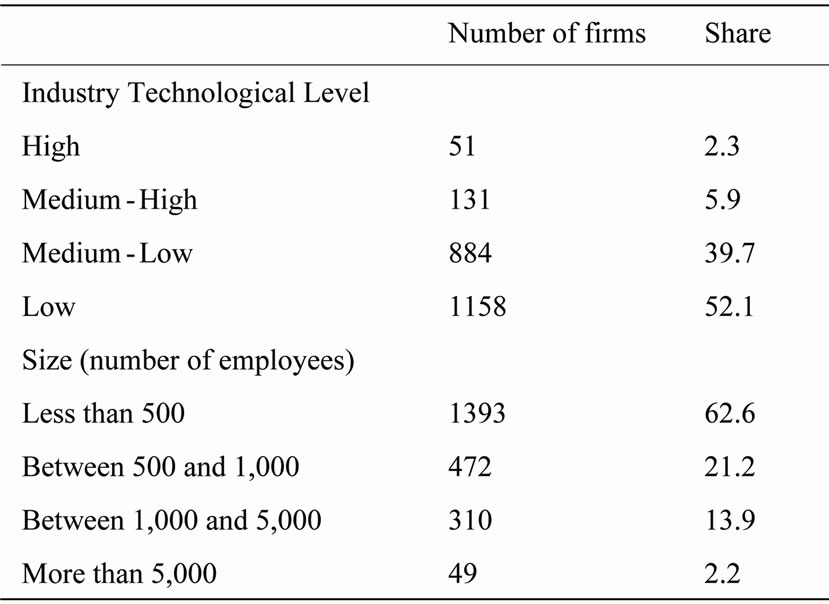
Table 1. Main characteristics of the sample.
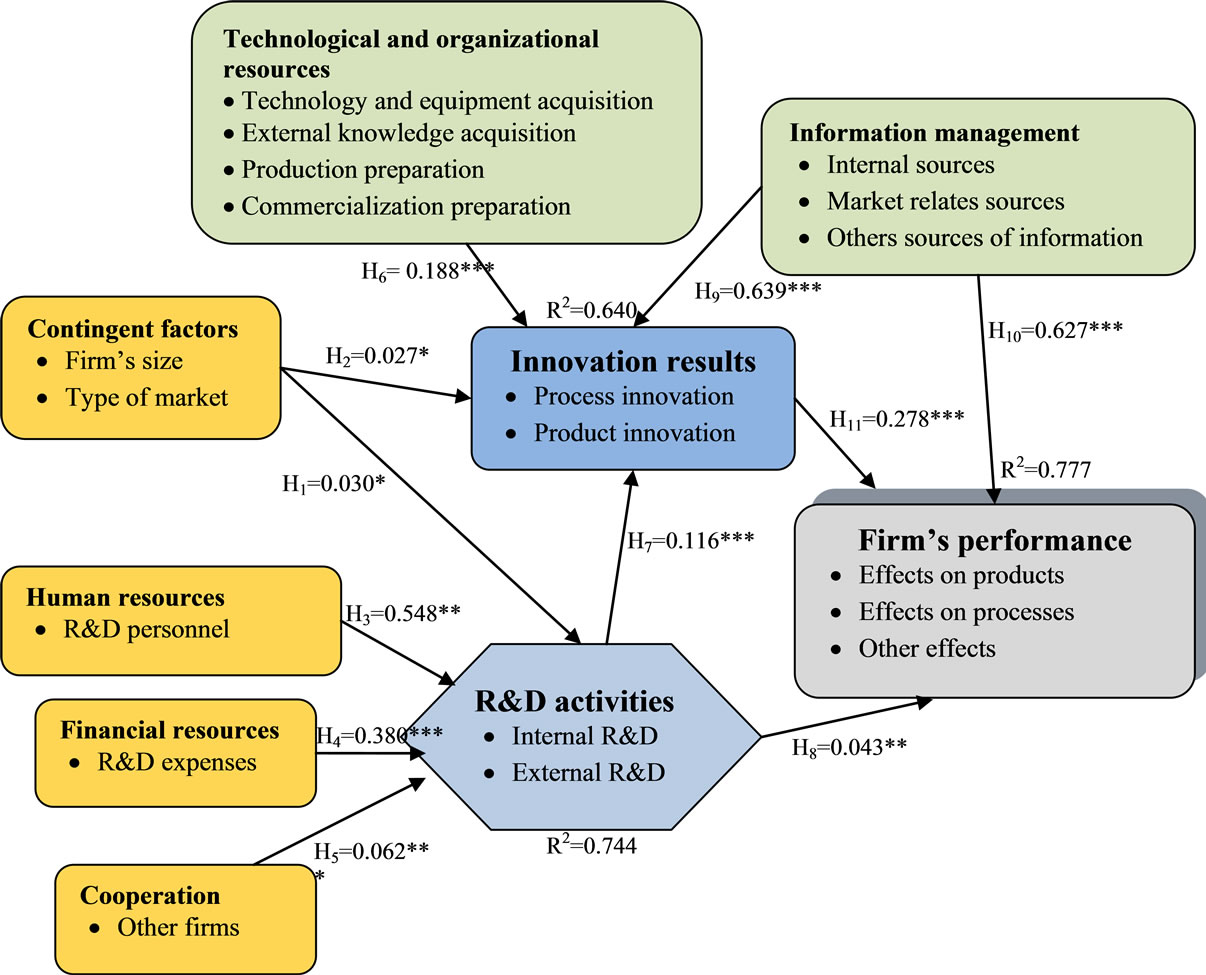
Figure 4. Estimation results. Note: *p < 0.005; *p < .01; *** p < 0.001.
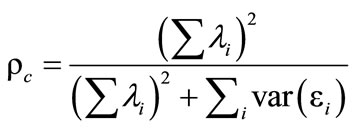
is bigger than 0.7, where λi is the standardized load of i indicator, εi is measurement error and var(εi) = 1 – λ²i. In our case the value obtained is 0.933.
c) Convergent validity. We use average variance extracted (AVE) proposed by Fornell and Larcker [47]. The value of the expression:
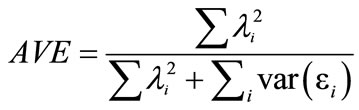
should be bigger than 0.5, since more of 50% of construct variance should be explained by its variables. In our study it reaches the value 0.823.
2) Formative indicators
a) Multicolineality. First we should avoid a multicolineality problem. Therefore we calculate an Inflation Variance Factor (FIV) demanding a value smaller than 5 for all indicators. The results are included in Table 4.
b) Discriminating validity. To test differences between constructs we employ two criterions: First, we test that AVE should be bigger than any other correlation between variables [47]. We substitute the diagonal of correlation matrix for AVE. The results are Table 5.
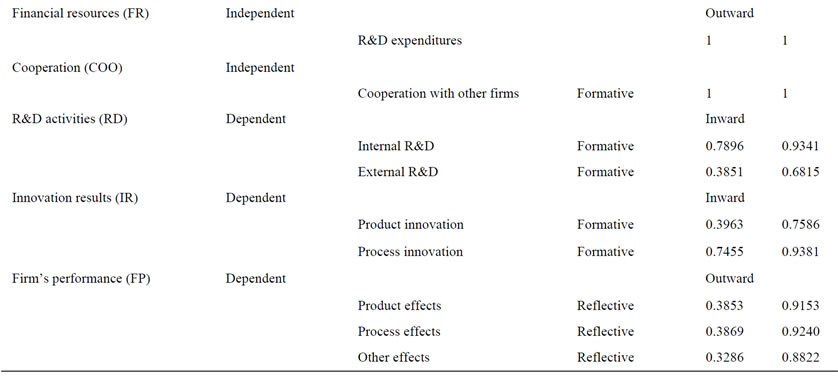
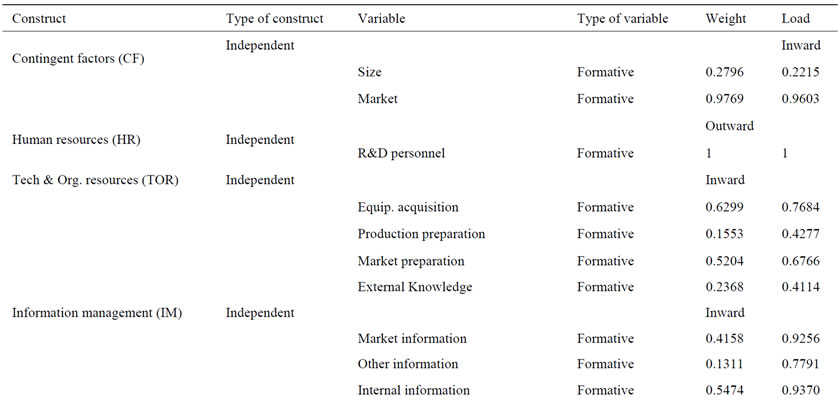
Table 2. Construct’s weights and factorial loads.
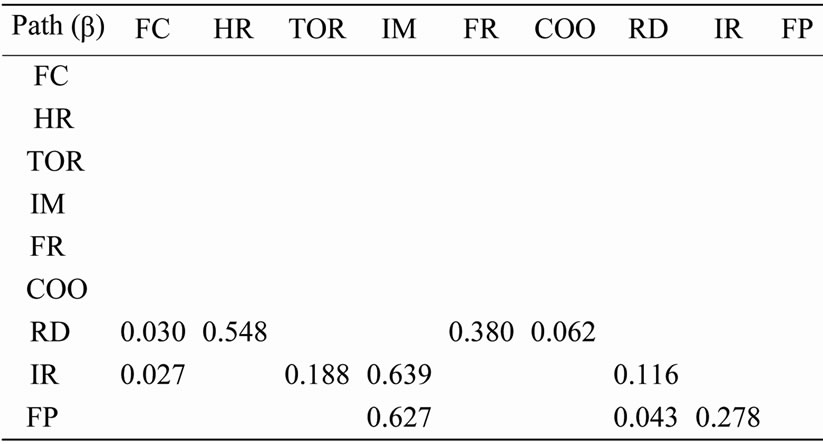
Table 3. Path values.
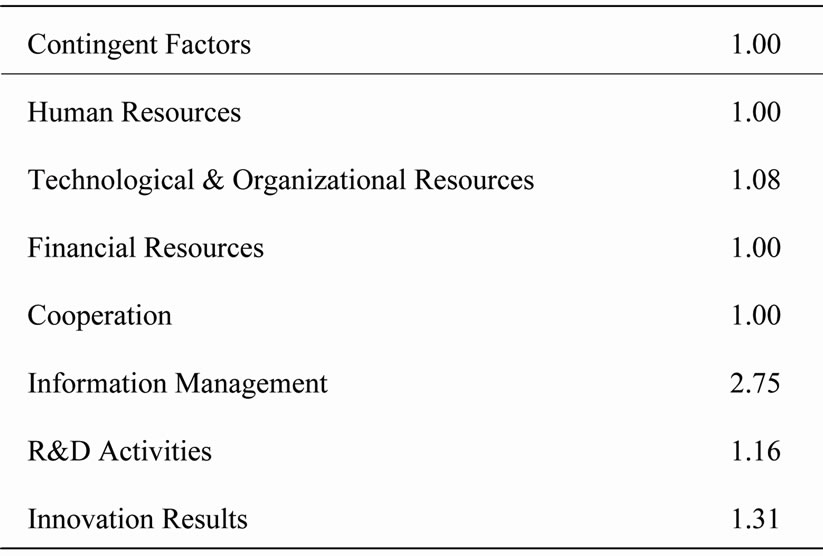
Table 4. Inflation variance factor.
All the variables satisfy the criterion. Secondly we analyze if a construct shares more variance with its own indicators rather than with other variables [48]. The cross-loading table is Table 6.
Only Size, External Knowledge, Other Information Sources, External R&D and Product Innovation present some problems, as it has been shown with highlighted text (with blue colour) in the previous table.
To analyze structural model we propose to test:
1) The share of the variance of each dependent construct explained by independent variables (R2) value should be bigger than 0.1. The results are in Table 7.
2) To study independent variables contribution to explained variance of dependent variables we use a criterion proposed by Falk & Miller. They suggest an empirical rule where predictor variable should explain at least 1.5% of the variance [49]. Following their criterion we obtain Table 8.
All the variables contribute to variance with more than 1.5% and satisfy the criterion, exception made of contingent factors and cooperation.
Moreover, we can observe that the most influent variable in R&D activities construct is Human resources, explaining 44.1% of variance, followed by financial resources (28.3%). On the contrary, contingent factors have a residual share.
In Innovation results construct the most relevant factor is information management (almost 50% of the explained variance).
At last, in firm’s performance construct is again information management the highest contributor, explaining 54% of the variance. Innovation results add with 21.7% and R&D activities with a very small 2%.
Accordingly, we can now look at the hypothesis we formulated and check them. In order to estimate the precision of the PLS estimates non-parametric techniques of re-sampling, such as Jacknife or Bootstrap, should be used. Both methods provide standard errors and t-statistics of parameters [50]. In our case we employed Bootstrap technique, obtaining the following results:
• Hypothesis 1: Contingent factors (size and market extent) affect positively to R&D activities: accepted with p < 0.05.
• Hypothesis 2: Contingent factors have a positive effect on innovation results (product and process): accepted with p < 0.05.
• Hypothesis 3: Human resources influence positively R&D activities: accepted with p < 0.001.
• Hypothesis 4: Financial resources directed to R&D activities have a positive effect on R&D activities: accepted with p < 0.001.
• Hypothesis 5: Cooperation with other agents generates a positive effect on R&D activities: accepted with p < 0.001.
• Hypothesis 6: Technological and organizational resources positively affect to innovation results: accepted with p < 0.001.
• Hypothesis 7: External or internal R&D activities have a positive effect on innovation results: accepted with p < 0.001.
• Hypothesis 8: External or internal R&D activities positively affect firm’s performance: accepted with p < 0.01.
• Hypothesis 9: Information management activities have a positive effect on innovation results: accepted with p < 0.001.
• Hypothesis 10: Information management activities positively influence firm’s performance: accepted with p < 0.001.
• Hypothesis 11: Innovation results have a positive effect on firm’s performance: accepted with p < 0.001.
Finally, in order to measure the predictive capacity of dependent constructs we have employed Stone-Geisser test [51,52]. In this case we have calculated Q2 value (cross-validated redundancy). If Q2 is bigger than 0 then the model has predictive relevance (as shown in Table 9).
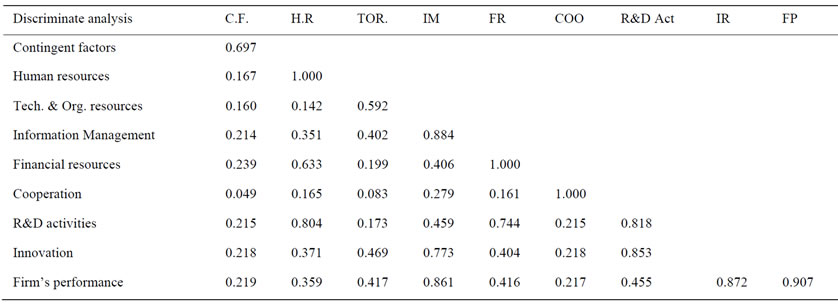
Table 5. Discriminate analysis.

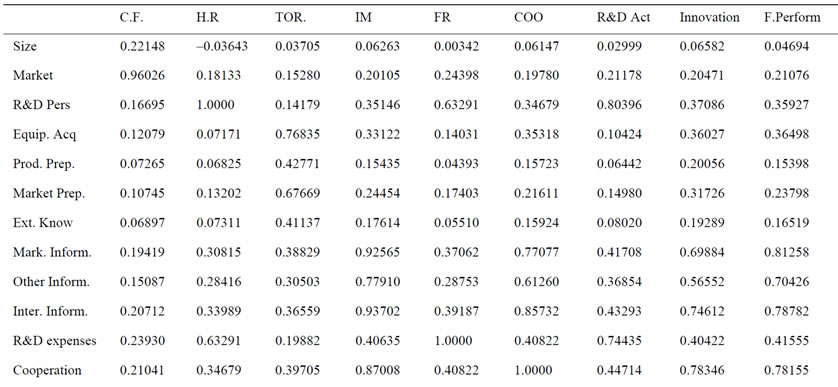
Table 6. Cross-loading table.
6. Main Conclusions
In this article we have proposed a model to analyze innovative behavior of Spanish industrial firms with more than 200 employees and its effects on firm’s performance. Its main characteristic is versatility, since we have introduced flexible relationships between different elements affecting firms’ innovation attitude, R&D activeties and business results. That means to apply Structural Equations Models and PLS techniques.
Our model defines nine constructs, latent variables created from observed variables: contingent factors, obtained

Table 7. Variance of each dependent construct explained by independent variables.
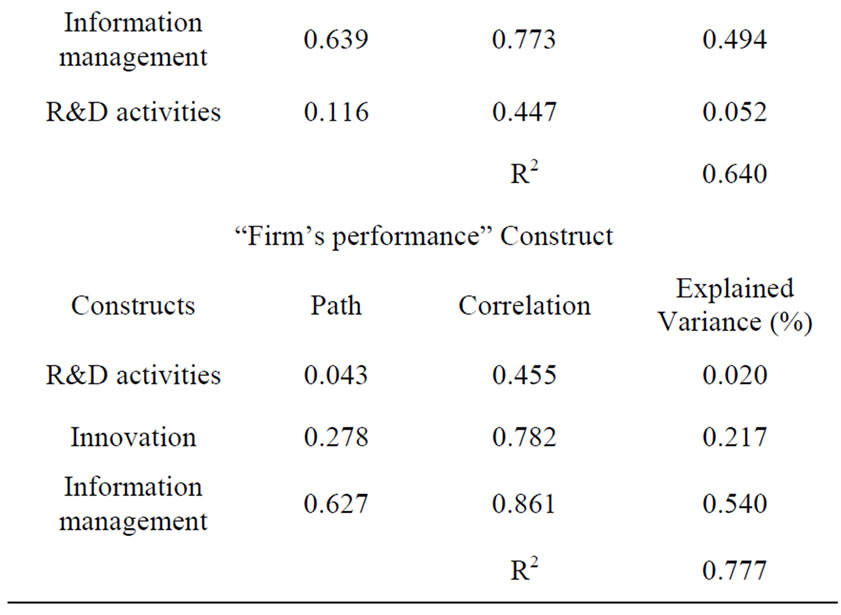
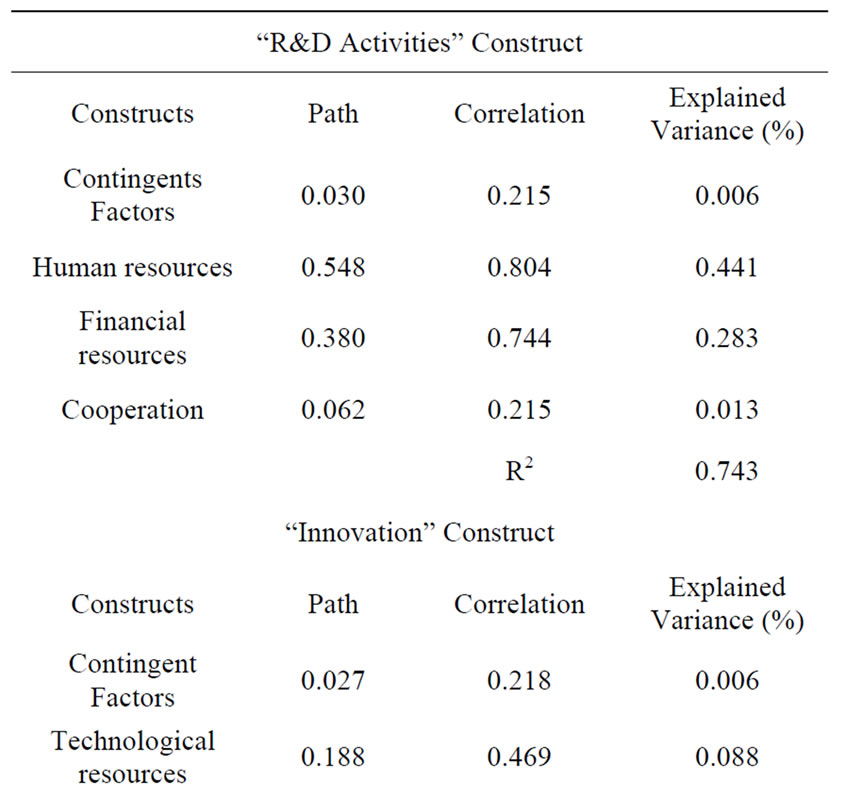
Table 8. Contribution to explained variance of dependent constructs.
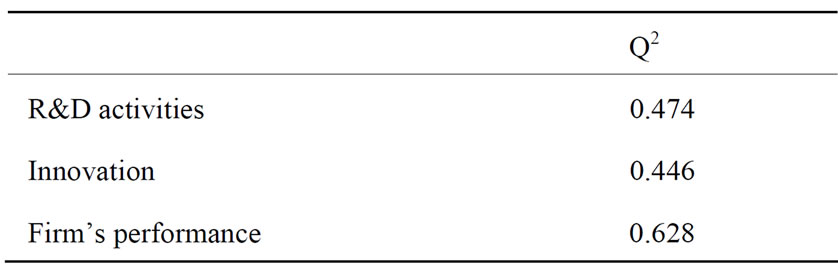
Table 9. Stone-geisser test.
from firm’s size and market extension; human resources, approached by R&D personnel; financial resources, created using R&D expenses; cooperation, using information from cooperation with other firms; R&D activities, obtained from external and internal R&D expenses; innovation results, from two variables, product and process innovation; information management, approached with the information of three sources: internal, market and other kind; technological and organizational resources, including the variables equipment and technology acquisition, external knowledge purchase; and production and commercialization preparation; and Firm’s results, reached with the effects of innovation on products, processes and others.
Since the relationships between constructs are complex, we employ a Structural Equations Model in order to arrive at a solution. The data come from PITEC and include a sample of 2224 Spanish firms with more than 200 workers. This is a database obtained from the Spanish National Statistics Institute’s Survey on Firms Technological Innovation.
The model is tested using PLS technique, a second generation multivariate analysis method especially recommended for research in business administration area, since it is usual in this field to find one of the next conditions: theory is not well built; the measures are not fully developed; data do not have normal distributions (sometimes the distribution is even unknown) or several variables are ordinal, categorical or dummies (this is our case).
In this work we have been able to reveal that when we evaluate R&D activities the most important factors are Human Resources allocated to them, since they represent 44% of the construct’s variance, followed by financial resources (28% of variance). On the contrary, contingent factors and cooperation have a very small weight. In other words, R&D in Spain, or more exactly its low level, is not an economic problem but the small number of people dedicated to this activity in our firms. This is probably the consequence of the lack of an entrepreneurrial research culture.
In reference to Spanish big firms’ results of innovation, both process and product, we have proved that information management is the most relevant factor (49% of construct’s variance). The other three elements, contingent factors, technological and organizational resources and R&D activities are not very relevant.
Finally, the main construct to delimitate firm’s performance variance is information management (54%), followed by innovation results (21%) and R&D activities (2%).
So, if we sum up a lack of entrepreneurial innovation culture in Spanish firms and the relevance of R&D in firm’s economic outcome we can conclude that it is compulsory a new way to focus Spanish industrial policy, oriented to beat this deficient interest in technological developments and concentrate the efforts in R&D and innovation.
7. References
[1] Z. Griliches, “Issues in Assessing the Contribution of R&D to Productivity Growth,” Bell Journal of Economics, Vol. 10, No. 1, 1979, pp. 92-116. doi:10.2307/3003321
[2] Z. Griliches and J. Mairesse, “Comparing Productivity Growth: An Exploration of French and U.S. Industrial and Firm Data,” European Economic Review, Vol. 21, No. 1-2, 1983, pp. 89-119. doi:10.1016/S0014-2921(83)80009-9
[3] Z. Acs, D. Audretsch and M. Feldman, “Real Effect of Academic Research: Comment,” The American Economic Review, Vol. 82, No. 1, 1992, pp. 363-367.
[4] D. Audretsch, “Agglomeration and the Location of Innovative Activity,” Oxford Review of Economic Policy, Vol. 14, No. 2, 1998, pp. 18-29. doi:10.1093/oxrep/14.2.18
[5] M. Porter and S. Stern, “Measuring the Ideas Production Function: Evidence from the International Patent Output,” NBER Working Paper 7891, 1999.
[6] S. J. Kline and N. Rosenberg, “An Overview of Innovation,” In: R. Landau and N. Rosenberg, Eds., The Positive Sum Strategy, Harnessing Technology for Economic Growth, 1986, pp. 275-305.
[7] J. L. Calvo, “Una Caracterización de la Innovación Tecnológica en los Sectores Manufactureros Españoles,” Economía Industrial, No. 331, 2000, pp. 139-150.
[8] J. L. Calvo, “Son las Actividades de I+D una Buena Aproximación a la Innovación Tecnológica?” Economía Industrial, No. 358, 2006, pp. 173-184.
[9] R. F. Hurley and G. T. Hult, “Innovation, Market Orientation and Organization Learning: An Integration and Empirical Examination,” Journal of Marketing, Vol. 62, No. 3, 1998, pp. 42-54. doi:10.2307/1251742
[10] P. Greene, C. Brush and M. Hart, “The Corporate Venture Champion: A Resource-Based Approach to Role and Process,” Entrepreneurship, Theory and Practice, Vol. 23, No. 3, 1999, pp. 103-122.
[11] S. W. Floyd and B. Wooldridge, “Knowledge Creation and Social Networks in Corporate Entrepreneurship: The Renewal of Organizational Capability,” Entrepreneurship, Theory and Practice, Vol. 23, No. 3, 1999, pp. 123-143.
[12] C. Camisón, “Sobre cómo Medir las Competencias Distintivas: Un Examen Empírico de la Fiabilidad y Validez de los Modelos Multi-Item para la Medición de los Activos Intangibles,” First International Conference, Management Related Theory and Research: An Iberoamerican Perspective, 1999.
[13] R. Hernández and A. de la Calle, “Estudio Sobre el Comportamiento Innovador de la Empresa,” Revista de Estudios Económicos and Empresariales, No. 18, Universidad de Extremadura, Centro Universitario de Plasencia, 2006.
[14] E. Mansfield, “Composition of R&D Expenditures, Relationship to Size of Firm, Concentration and Innovative Output,” Review of Economics and Statistics, Vol. 63, No. 2, 1981, pp. 610-615. doi:10.2307/1935857
[15] K. Pavitt, “Sectorial Patterns of Technical Change: Towards a Taxonomy and a Theory,” Research Policy, Vol. 13, No. 6, 1984, pp. 343-373. doi:10.1016/0048-7333(84)90018-0
[16] D. Audretsch and Z. Acs, “Innovation, Market Structure and Firm Size,” Review of Economics and Statistics, Vol. 69, No. 4, 1987, pp. 567-575. doi:10.2307/1935950
[17] M. Moch and E. Morse, “Size, Centralization and Organizational Adoption of Innovations,” American Sociological Review, Vol. 42, No. 5, 1997, pp. 716-725. doi:10.2307/2094861
[18] M. Buesa and J. Molero, “Tamaño Empresarial e Innovación Tecnológica en la Economía Española,” ICE Tribuna de Economía, Vol. 773, 1998, pp. 155-173.
[19] R. D. Dewar and J. E. Dutton, “The Adoption of Radical and Incremental Innovations: An Empirical Analysis,” Management Science, Vol. 32, No. 11, 1986, pp. 1422- 1433. doi:10.1287/mnsc.32.11.1422
[20] L. B. Mohr, “Determinants of Innovation in Organizations,” American Political Science Review, Vol. 63, No. 1, 1969, pp. 111-126. doi:10.2307/1954288
[21] D. Audretsch, “New-Firm Survival and the Technological Regime,” The Review of Economics and Statistics, Vol. 73, No. 3, 1991, pp. 441-450. doi:10.2307/2109568
[22] D. Audretsch, “Innovation, Growth and Survival,” Inter- - national Journal of Industrial Organization, Vol. 13, 1995, pp. 441-445. doi:10.1016/0167-7187(95)00499-8
[23] S. Sengupta, “Some Approaches to Complementary Product Strategy,” Journal of Product Innovation Management, Vol. 15, No. 4, 1998, pp. 352-367. doi:10.1016/S0737-6782(97)00106-9
[24] H. R. Greve, “The Effect of Core Change on Performance: Inertia and Regression toward the Mean,” Administrative Science Quarterly, Vol. 44, No. 3, 1999, pp. 590-614. doi:10.2307/2666963
[25] J. V. Baldridge and R. A. Burnham, “Organizational Innovation: Industrial, Organizational and Environmental Impact,” Administrative Science Quarterly, Vol. 20, 1975, pp. 165-176. doi:10.2307/2391692
[26] Z. Griliches, “R&D and Productivity: Econometric Results and Measurement Issues,” In: P. Stoneman, Ed., Handbook of the Economics of Innovation and Technological Change, Blackwell, Oxford, 1995.
[27] R. Narula and J. Dunning, “Explaining International R&D Alliances and the Role of Governments,” Merit Working Paper Series 97-011, 1997.
[28] J. Hagedoorn, “Understanding the Rationale of Strategic technology Partnering: Interorganizational Modes of Cooperation and Sectorial Differences,” Strategic Management Journal, Vol. 14, 1993, pp. 371-385. doi:10.1002/smj.4250140505
[29] J. Hagedoorn, “Strategic Technology Partnering during the 1980’s. Trends, Networks, and Corporate Patterns in NonCore Technologies,” Research Policy, Vol. 24, No. 2, 1995, pp. 207-231. doi:10.1016/0048-7333(94)00763-W
[30] J. Hagedoorn and R. Narula, “Choosing Organizational Modes of Strategic Technology Partnering: Interorganizational Modes of Cooperation and Sectorial Differences,” Strategic Management Journal, Vol. 14, No. 5, 1996, pp. 371-385. doi:10.1002/smj.4250140505
[31] E. Arnold and B. Thuriaux, “Developing Firms’ Technological Capabilities,” Report for the OECD, Brighton, Technopolis, 1997.
[32] C. Freeman, “The Economics of Technical Change,” In: D. Archibugi and J. Michie, Eds., Trade, Growth and Technical Change, Cambridge University Press, Cambridge, 1998.
[33] OECD, “Frascati Manual, Proposed Standard Practice for Survey of Research and Experimental Development,” The Measurement of Scientific and Technological Activities Series, Paris, 2002.
[34] OECD & Eurostat, “Oslo Manual, Guidelines for Collecting and Interpreting Innovation Data, the Measurement of Scientific and Technological Activities,” 3rd Ed., A Joint Publication of OECD and Eurostat, Paris, 2005.
[35] E. Mansfield, M. Schwartz, S. Wagner, “Imitation Costs and Patents: An Empirical Study,” The Economic Journal, Vol. 91, No. 364, 1981, pp. 907-918. doi:10.2307/2232499
[36] E. Mansfield, “Patents and Innovations: An Empirical Study,” Management Science, Vol. 32, No. 2, February 1986, pp. 173-181. doi:10.1287/mnsc.32.2.173
[37] J. Narver and S. Slater, “The Effect of a Market Orientation on Business Profitability,” Journal of Marketing, Vol. 54, October 1990, pp. 20-35. doi:10.2307/1251757
[38] T. C. Powell, “Total Quality Management as Competitive Advantage: A Review and Empirical Study,” Strategy Management Journal, Vol. 16, No. 1, 1995, pp. 15-37. doi:10.1002/smj.4250160105
[39] Z. Acs, L. Anselin and A. Varga, “Patents and Innovations Counts as Measures of Regional Production of New Knowledge,” Research Policy, Vol. 31, No. 8-9, 2002, pp. 1069-1085. doi:10.1016/S0048-7333(01)00184-6
[40] B. Arthur, “Increasing Returns and Path Dependence in the Economy,” University of Michigan Press, Michigan, 1994.
[41] J. A. Schumpeter, “The Theory of Economic Development,” Harvard University Press, Cambridge, 1934.
[42] R. R. Nelson and S. G. Winter, “Search of a Useful Theory of Innovation,” Research Policy, Vol. 6, No. 1, 1977, pp. 36-77. doi:10.1016/0048-7333(77)90029-4
[43] G. Dosi, C. Freeman, R. R. Nelson, G. Silverberg and L. Soete, “Technology Change and Economic Theory,” Pinter Publishers, London, 1988.
[44] C. Freeman, “Teoría Económica de la Innovación Industrial,” Alianza Editorial, Madrid, 1975.
[45] C. Freeman, “The Economics of Industrial Innovation,” 2nd Ed., Frances Printer, London, 1982.
[46] J. Hair, R. Anderson, R. Tatham and W. Black, “Multivariate Data Analysis,” Prentice Hall International, Upper Saddle River, 1998.
[47] C. Fornell and D. F. Larcker, “Evaluating Structural Equation Models with Unobservable Variables and Measurement Error,” Journal of Marketing Research, Vol. 18, February 1981, pp. 39-50. doi:10.2307/3151312
[48] D. Barclay, C. Higgins and R. Thompson, “The Partial Least Squares (PLS) Approach to Causal Modelling: Personal Computer Adoption and Use as an Illustration,” Technology Studies, Special Issue on Research Methodology, Vol. 2, No. 2, 1995, pp. 285-309.
[49] R. F. Falk and N. B. Miller, “A Primer for Soft Modelling,” The University of Akron, Ohio, 1992.
[50] W. W. Chin, “The Partial Least Squares Approach to Structural Equation Modelling,” In: G. A. Marcoulides Ed., Modern Methods for Business Research, Lawrence Erlbaum Associates, Mahwah, 1998, pp. 295-336.
[51] M. Stone, “Cross-Validatory Choice and Assessment of Statistical Predictions,” Journal of the Royal Statistical Society, Vol. 36, No. 1, 1974, pp. 111-147.
[52] S. Geisser, “The Predictive Sample Reuse Method with Applications,” Journal of the American Statistical Association, Vol. 70, 1975, pp. 320-328. doi:10.2307/2285815
NOTES
1But as it is appointed by the Oslo Manual, innovations can be achieved inside an organization without having carried out previous R&D activities.
2Data can be downloaded from http://sise.fecyt.es/sise-public-web/cargarArchivo.do?id=1393
3We use PLS-Graph software, developed by professor Chin. http://disc-nt.cba.uh.edu/chin/indx.html