Technology and Investment
Vol.1 No.1(2010), Article ID:1316,5 pages DOI:10.4236/ti.2010.11002
Long-Term Outperformance of Equity Carve-Outs?
— Evidence from Germany
1Tech University Darmstadt, Darmstadt, Germany
2European Business School (ebs), International University, Oestrich-Winkel, Germany
3Deutsche Börse AG, Xetra Market Development, London, United Kingdom
E-mail: schiereck@bwl.tu-darmstadt.de
Received November 11, 2009; revised November 27, 2009; accepted December 10, 2009
Keywords: Equity Carve-Out; Initial Public Offering, Long-Term Return, Underpricing
Abstract
While there has been done a lot of empirical research on IPO performance in general only ADDIN EN.CITE
1. Introduction
According to Schipper/Smith [2], an equity carve-out (ECO) is defined by a company selling stock in a subsidiary via an initial public offering (IPO). From an investor’s perspective there is some rare empirical evidence that these new listings outperform other initial public offerings in the long term1. Vijh [3] who indirectly compares US equity carve-outs and common IPOs presents first findings in this direction and explains his results by the strategic focus of carve-outs, parents as an active and superior monitors and reduced overpricing due to reputational aspects2. However, Brav et al. [4] showed that the results of Vijh [3] are likely to be induced by model misspecification. Prezas et al. [1] find a significant three year underperformance of equity carve-outs compared to common IPOs. The contradictive evidence presented so far indicates the valuable contribution of additional results from other stock markets. Our paper aims at analyzing the pricing and performance of equity carve-outs in Germany.
The remainder of this note is organized as follows: Section 2 provides a description of the methodological approach and specification of the event study. The results of the event study are provided and discussed in Section 3. Section 4 concludes.
2. Data and Methodology
For analyzing the performance of German ECOs and other IPOs over different time horizons we apply the event-study framework. While the event study procedure is straightforward for small short-term event windows, the methodological issues of measuring long-term performance are discussed more controversially. Therefore, we point out the discussion on major methodological challenges a bit broader.
2.1. Sample Characteristics
Calculations are based on a sample from the IPO database of Deutsche Börse AG, transaction data was obtained for 348 initial public offerings. Due to several restraints, 303 securities remained. 19 could be identified as involved in an ECO transaction, using the sample of German ECOs by Stienemann [9]. Those 19 ECOs form the ECO sample, whereas the control sample or IPO sample is composed of the remaining 284 common IPOs. Due to only few recent transactions, the two-year control sample was reduced to 280 firms, whereas the three-year ECO sample and control sample contained 16 and 240 firms, respectively.
As can be seen from Table 1, the size of the equity carve-outs (sample A) is both larger and subject to greater skewness than the size of the common IPOs (sample B). Although mean and median book-to-market equity ratios do not differ significantly, at least in economic terms, the dispersion in the common IPO sample is greater, possibly resulting from a larger sample size. A simple F-test shows that it seems unlikely for both samples to share a common population; however, this test requires independent random samples which are not given in this case. Thus, inferences about statistical differences cannot be made. However, due to the well-documented size and book-tomarket effects in average returns, it has to be accounted for those economically significant differences using reference portfolios and matching firms matched by size and book-to-market equity as benchmarks as introduced earlier.
2.2. Applied Methodology
Fama [10] explicitly emphasizes the joint test of market efficiency with a model for expected returns, when analyzing outperformance over multi-year periods. Unfortunately, all predictive models are only incomplete descriptions of the systematic return generating process, leading to so-called “bad-model problems”. They become more serious with longer event windows. The same is true for the estimated variance which is needed to determine the statistical significance of observed abnormal returns. Using simulations, Kothari/Warner [11] find that “longhorizon [parametric] tests are misspecified […] and the general conclusions are not sensitive to the specific performance benchmarks. Further, the tests can show both positive and negative abnormal performance too often.” Accordingly, the possibility arises that several observed delayed stock price reactions, including the underperformance of IPOs according to Ritter [12] are due to a “bad model” or test misspecification rather than mispricing.
Barber/Lyon [13] presents three possible reasons for the observed bias; the new listing bias, the rebalancing bias and the skewness bias. Cowan/Sergeant [14] adds the overlapping horizon bias. The last two sources of biases can be expected to play a significant role in our analysis: (1) the skewness bias arises because long-term returns are found to be positively (right) skewed which represents a violation of the normality assumption of most statistical tests, leading to non-normal, left-skewed t-statistic distribution with a mean smaller than zero. Inferences based on the conventional t-statistic are thus biased. (2) Due to correlation in calendar-time, i.e. clustering of IPOs, many event horizons overlap in calendar-time. The consequences are content of the overlapping horizon bias: As firms are exposed to the same unpriced risk factors, e.g. common economic shocks during the event window, this translates into positive cross-sectional correlation within a sample. Since significance testing relies on the assumption of uncorrelated disturbances, the bias leads to a violation of the independence assumption, and thus has high impact on the statistical inferences.
As determined by descriptive statistics (see Table 1), the average common IPO and the average ECO differ significantly in size and book-to-market equity. Thus, using the simple average of both panels would lead to the bad-model problem. One possibility to bypass this problem is to match the sample securities with portfolios based on firm characteristics, such as size and book-to-market equity. This will be referred to as control portfolio or reference portfolio approach and is widespread in tests for IPO underperformance.
The returns of the respective stocks in the reference portfolio can either be equally weighted or value-weighted. As there is no common sense regarding which model is superior, we apply both. By using this approach, both the rebalancing bias and the new listing bias are controlled for. The sample and the reference portfolio are both compounded without rebalancing, they only include firms with similar trading records, and they are matched on size and book-to-market equity which was found to diminish possible return differentials.
The similar third approach uses single securities instead
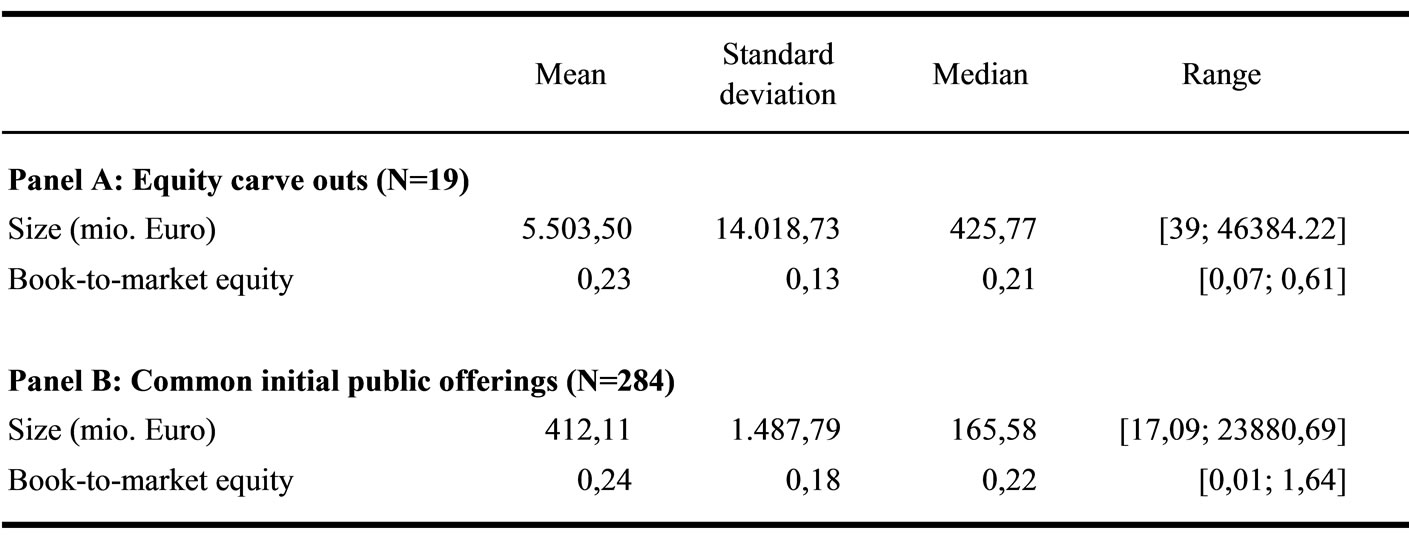
Table 1. Descriptive statistics of the samples.
of portfolios to match with the sample securities. This approach of matching firms or control firms is proposed by Barber/Barber/Lyon [12] and employed by Prezas et al. [1]. The rationale behind this adjustment is mainly derived from the skewness bias. Barber/Lyon [8] find that abnormal returns calculated using control firms instead of reference portfolios are reasonably symmetric. In addition, analogous to the reference portfolio approach, the new listing bias and the rebalancing bias are controlled for. As a forth approach we apply the cross-sectional Fama/French [15] three-factor-model.
There was also a lively debate on calculating returns over longer periods, discussing the pros and cons of cumulative abnormal returns (CAR) and the buy-and-hold or holding period abnormal return metric (BHAR). As stated by Fama [9], BHARs capture the return for an investor’s passive trading strategy. Gompers/Lerner [16] formulates the concern that CARs tend to misrepresent performance when returns are highly volatile. Barber/ Lyon [12] find that CARs suggest abnormal performance when there is none. This reservation to CARs let us recommend the use of BHARs, although Fama [9] points out that CARs experience fewer statistical problems since they are less skewed. However, regarding the investor’s perspective of this study, the increased magnitude of the skewness bias is accepted in order to account for the significant volatility during the period under investigation in Germany. The cross-sectional sample variance of abnormal returns is calculated as suggested by Kothari/ Warner [10] and Brav [17]. This approach corresponds to the paired difference t-test.*
In addition to the twofold cross-sectional dependence problem, the skewness bias constitutes a major problem for significance test specification, as already noted above. Therefore, Lyon et al. [18] propose a skewness-adjusted t-statistic tskew in addition to the conventional t-statistic, which is supposed to reduce the associated bias. In order to estimate the statistical significance of the tskew, we use a bootstrap application for approximating the empirical distribution of returns.
3. Empirical Evidence from Germany
Results for initial short-term underpricing are not robust across predictive models and aggregation methods, as shown in Table 2a. The equal-weighted reference portfolio and three factor model yield similar results, showing a significant underpricing between 50-150%. Those predictive models provide robust results across aggregation methods, suggesting that smaller and larger ECOs are alike. Unfortunately, this is not supported by the other two predictive models, since the significant results tend to vanish. Matching firms shows a significant underpricing at the 10% level with the paired difference t-test; significances disappear when not accounting for inter-sample dependence. Assuming a small impact of the skewness bias for matching firms, this seems to be a case of underrejection due to the inflated variance underlying the tind, as there is supposed to be no intra-sample dependence in short returns. Thus, this presents an indication towards the greater underpricing of large ECOs.
The underpricing appears to vanish using valueweighted reference portfolios and matching firms combined with the value-weighted aggregation method. Not only are the initial day returns insignificant, they are even positive at about 53%. These results indicate that larger ECOs are engaged in greater underpricing.
The results for the long-term performance are presented in Table 2b. In the long-term, there is a significant underperformance for the 24-month holding period at about 20-30% with equally weighted aggregation and all models except matching firms. However, this underperformance vanishes with value-weighted aggregation, suggesting relatively better performance of larger ECOs. However, the tskew suggests that the significance is attributable to the skewness bias. Thus, the null hypothesis of no longerterm performance divergence cannot be rejected.
4. Conclusions
Most abnormal returns, except for the initial day holding period with value-weighted reference portfolios, are significantly different from zero. Thus, the null hypothesis of no abnormal short-term holding period returns has to be rejected. Interestingly, ECOs were found more underpriced than IPOs in the short-term. These results are opposing to arguments by Cheung/Krinsky [8], arguing that underpricing is based on information asymmetries and that carve-outs should experience less misspricing, because they are already valued and monitored by the market prior the transaction.
According to our results, the null hypothesis of no long-term abnormal performance has to be rejected. Based on these results, the positive effects of active monitoring do not have to be rejected in general. However, negative consequences related to the asymmetric information hypothesis suggested by Nanda [6] evidently outweigh possible efficiency gains from superior monitoring.
Nevertheless, the discussions above illustrate the dependence of the results regarding alternative methodolog-
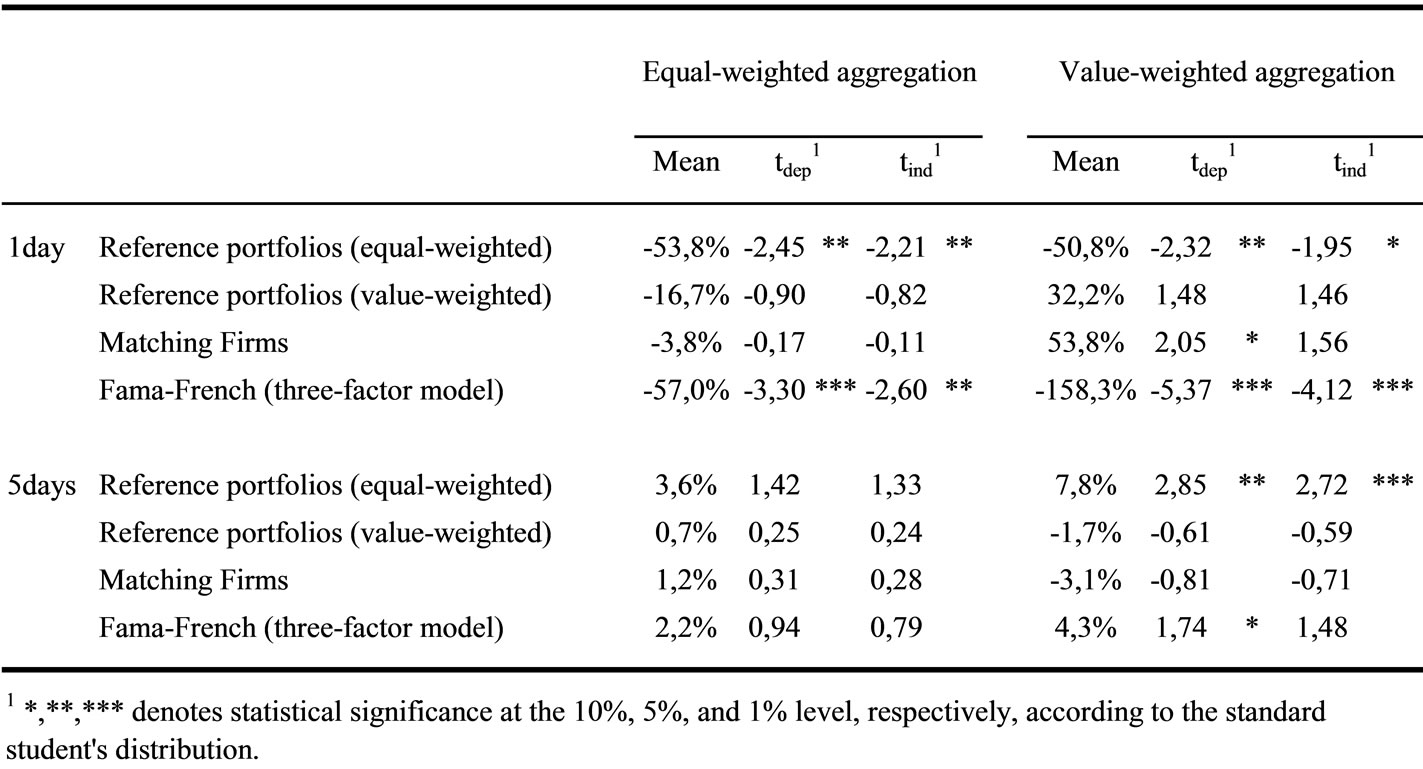
Table 2a. Short-term performance/underpricing.
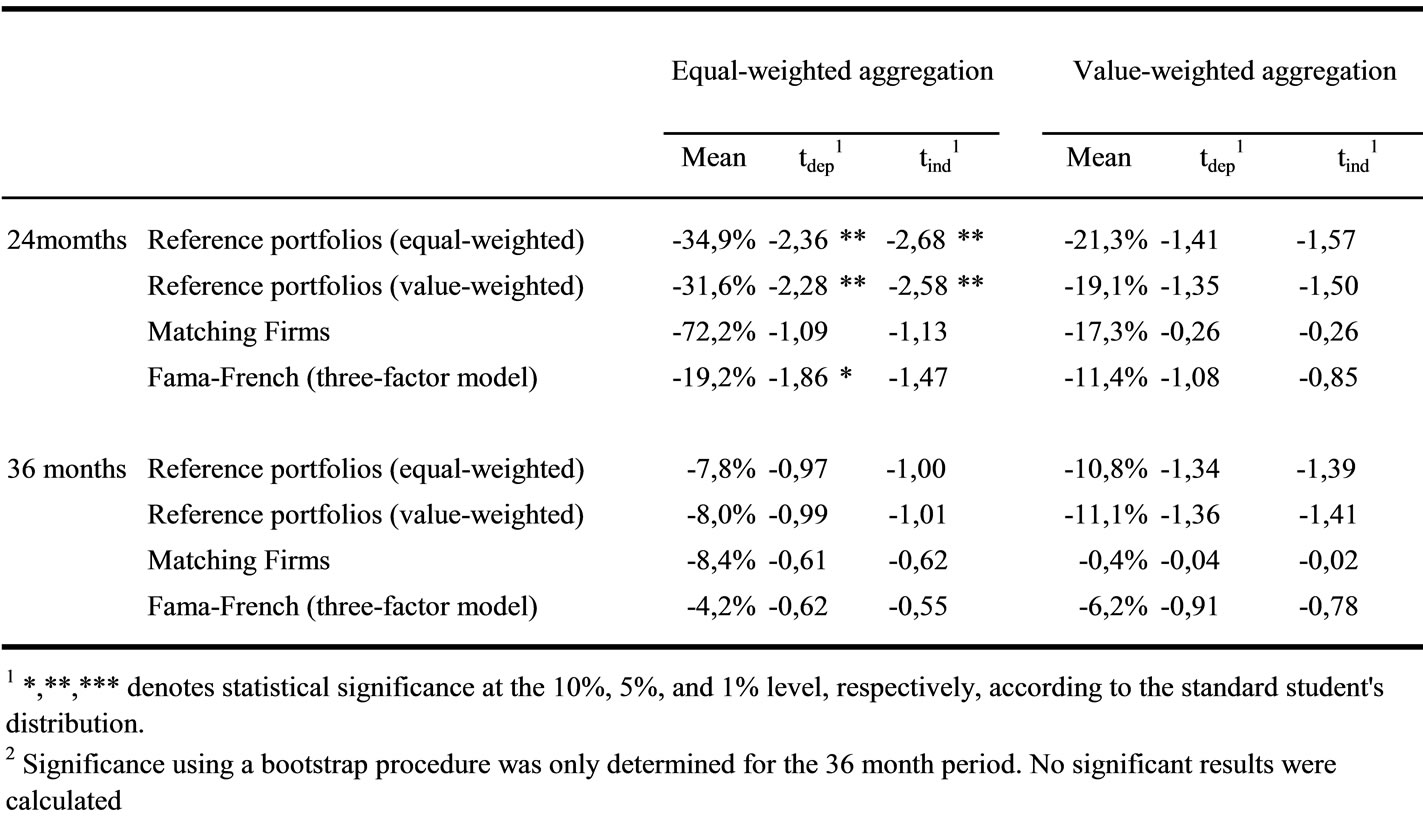
Table 2b. Long-term performance.
ies. The impact of different biases was examined, suggesting that further research is needed to confidently answer the question of performance differentials between ECOs and common IPOs. Our results suggest at least that the divergence is not as clear as argued by Prezas et al. [1].
5. Acknowledgment
Arnd Schikowsky passed away while working on this study. This paper is dedicated to him.
Large part of this work was completed when Christian Voigt was Research Assistant at the European Business School. The views expressed in this article are those of the authors and do not necessarily reflect the views of Deutsche Börse AG, any of its subsidiaries, or anyone else.
6. References
[1] A. P. Prezas, M. Tarimcilar and G. K. Vasudevan, “The pricing of equity carve-outs,” in the Financial Review, Vol. 35, Iss. 1, pp. 123–138, 2000.
[2] K. Schipper and A. Smith, “A comparison of equity carveouts and seasoned equity offerings,” in Journal of Financial Economics, Vol. 15, Iss. 1/2, pp. 153–186, 1986.
[3] A. M. Vijh, “Long-term returns from equity carve-outs,” in Journal of Financial Economics, Vol. 51, Iss. 2, pp. 273–308, 1999.
[4] A. Brav, C. Geczy and P. A Gompers, “Is the abnormal return following equity issuances anomalous?” The Wharton School, University of Pennsylvania, 1998.
[5] F. M. Weiser, M. Užik and I. Röhrig, “Capital market reactions to the announcement of equity carve-outs and spin-offs,” in Finanz Betrieb, Vol. 7, Iss. 9, pp. 571–580, 2006.
[6] V. Nanda, “On the good news in equity carve-outs,” in Journal of Finance, Vol. 46, Iss. 5, pp. 1717–1737, 1991.
[7] A. Brav and P. A. Gompers, “Myth or reality? The longrun under-performance of initial public offerings: Evidence from venture and nonventure capital-backed companies,” in Journal of Finance, Vol. 52, Iss. 5, pp. 1791– 1821, 1997.
[8] S. C. Cheung and I. Krinsky, “Information asymmetry and the underpricing of initial public offerings: Further empirical evidence,” in Journal of Business Finance & Accounting, Vol. 21, Iss. 5, pp. 739–747, 1994.
[9] M. Stienemann, “Wertsteigerungen durch desinvestitionen,” Private Universität Witten/Herdecke gG-mbH, Dissertation, 2003.
[10] E. F. Fama, “Market efficiency, long-term returns, and behavioral finance,” in Journal of Financial Economics, Vol. 49, Iss. 3, pp. 283–306, 1998.
[11] S. P. Kothari and J. B. Warner, “Measuring long-horizon security price performance,” in Journal of Financial Economics, Vol. 43, Iss. 3, pp. 301–339, 1997.
[12] J. R. Ritter, “The long-run performance of initial public offerings,” in Journal of Finance, Vol. 46, Iss. 1, pp. 3–27, 1991.
[13] B. M. Barber and J. D. Lyon, “Detecting long-run abnorstock returns: the empirical power and specification of test mal statistics,” In Journal of Financial Economics, Vol. 43, Iss. 3, pp. 341–372, 1997.
[14] A. Cowan and A. M. A. Sergeant, “Interacting biases, nonnormal return distributions and the performance of tests for long-horizon event studies,” in Journal of Banking and Finance, Vol. 25, Iss. 4, pp. 741–765, 2001.
[15] E. F. Fama and K. R. French, “Common risk factors in the re-turns on stocks and bonds,” in Journal of Financial Economics, Vol. 33, Iss. 1, pp. 3–56, 1993.
[16] P. A. Gompers and J. Lerner, “The really long-run performance of initial public offerings: The pre-NASDAQ evidence,” in Journal of Finance, Vol. 58, Iss. 4, pp. 1355– 1392, 2003.
[17] A. Brav, “Inference in long-horizon event studies: A Bayesian approach with application to initial public offerings,” in Journal of Finance, Vol. 55, Iss. 5, pp. 1979– 2016, 2000.
[18] J. D. Lyon, B. M. Barber and C-L. Tsai, “Improved methods for tests of long-run abnormal stock returns,” in Journal of Finance, Vol. 54, Iss. 1, pp. 165–201, 1999.
NOTES
1The reaction of parent companies on the announcement of an ECO has been studied numerously. ADDIN EN.CITE
2See for theoretical support of these arguments e.g. ADDIN EN.CITE
*Due to the overlapping horizon bias, paired difference tests might be misspecified in long-horizon event studies. ADDIN EN.CITE