Journal of Water Resource and Protection
Vol.6 No.2(2014), Article ID:42879,7 pages DOI:10.4236/jwarp.2014.62011
Metals Assessments in the Water Bodies of Sagarmatha National Park and Buffer Zone, Nepal
1Central Department of Botany, Tribhuvan University, Kathmandu, Nepal
2Department of Environment health and hygiene, Padova University, Padova, Italy
Email: *nghimire077@gmail.com
Received October 29, 2013; revised November 28, 2013; accepted December 25, 2013
ABSTRACT
Sagarmatha (Mt. Everest) National Park (SNP) of Nepal is a popular international eco-touristic destination. In the last few years, tourist flow has increased tremendously generating anthropogenic pressure on natural environment. Generation of huge solid waste, open defecation and poor septic tank condition of toilets have been considered as the major sources of pollution to water bodies in the area. Heavy metals, such as cadmium, copper, lead, chromium and mercury, are important environmental pollutants, particularly in areas with high anthropogenic pressure. Their presence in the atmosphere, soil and water, even in traces can cause serious problems to all organisms, and heavy metal bioaccumulation in the food chain especially can be highly dangerous to human health. Heavy metals (Cu, Pb, Mn, Fe and Zn) and metals (Na, Mg) were analyzed. Thirty nine (13 samples in each year) water samples were collected from river and springs to assess the water quality in the SNP and its buffer zone. Water quality in the SNP has been found degraded in terms of heavy metals; particularly Na and Mg contents were found higher when compared with the earlier report. Iron content in 46% samples was found more than WHO and Nepalese standard for drinking water. The river water quality in general still stands good in terms of standard for drinking water (WHO, Nepal standard) however degradation process has accelerated.
Keywords:Water Quality; Solid Waste; Tourism; Open Defecation; Anthropogenic Pressure; Poor Septic Tank
1. Introduction
Sagarmatha National Park (SNP) is a World Heritage Site and a popular destination for international eco-tourists. Panoramic view of snow cap, clean environment, live glacier, glacier lakes, unique flora and fauna, scenic beauty of Himalayan peaks, wonderful Sherpa culture, colourful festivals, etc. are the sources of attraction for tourists to visit this National Park. These visitors are concentrated and overcrowded in spring (April-May) and autumn seasons (October-November) creating a seasonal pressure on resources [1]. Tourism is a major source of income in Khumbu region, but still a large population depends upon agro-pastoral activities. The area is inhabited mainly by Sherpa, followed by Tamang, Rai, etc. [2]. It is the habitat of many endangered species such as musk deer, snow leopard, red panda and Himalayan monal.
Increasing tourism has brought positive economic changes in the area but it has also accelerated environmental degradation like water pollution. In 2007, 25,818 tourists visited the area whereas 32,123 international trekkers visited SNP in 2009. A large number of tourists accompanied by porters and guides produce a series of impacts on environment and society. Caravello et al. [3] have reported that the water quality of aquatic bodies in the Khumbu valley has deteriorated microbiologically as well as chemically. Unmanaged solid waste and open defecation are the major sources of environmental degradation [4]. Considering the ecological significance of SNP and current trend of environmental degradation, a detail ecological study of surface water bodies has been done. In this communication, we have presented the results of metal assessments of the surface water in Sagarmatha National Park and Buffer Zone (SNPBZ). The metals estimated in the water samples were copper (Cu), iron (Fe), manganese (Mn), zinc (Zn), sodium (Na), magnecium (Mg) and lead (Pb).
2. Study Area
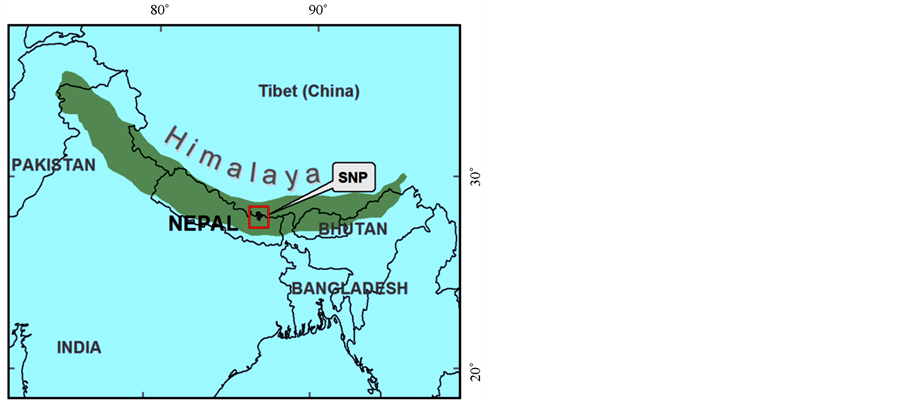
The Sagarmatha National Park (27˚30'19" to 27˚06'45" N latitude, 86˚30'53" to 86˚99'08" E longitude) located in the southern slope of Sagarmatha (Mt. Everest), lies in the Solukhumbu district of the north eastern region of Nepal (Figures 1(a) and (b)) and covers 1423 sq km
 (a)
(a)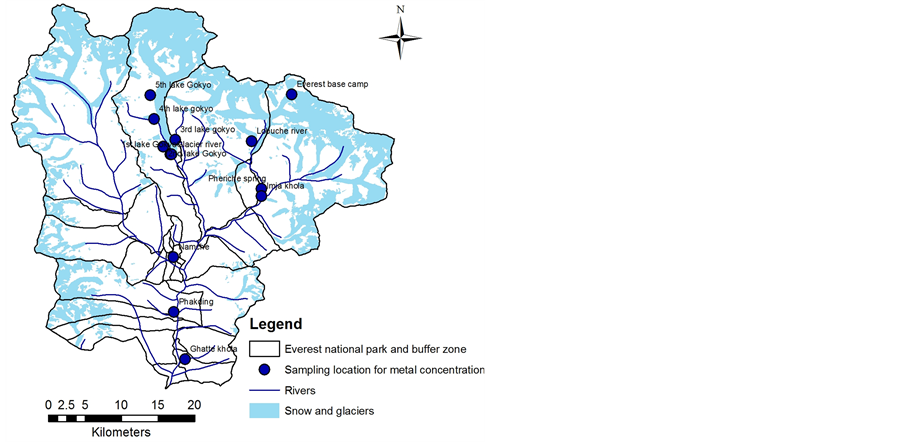 (b)
(b)
Figure 1. (a) Location of Sagarmatha National Park and Buffer zone; (b) Location of samplings points in water bodies of Sagarmatha National Park and Buffer zone.
(1148 sq km as National Park and 275 sq km as Buffer Zone) Characterized by rugged topography, the altitude of the Park ranges from 2845 m at Jorsella to 8848 m at the top of the Mt. Everest (the World’s highest mountain).
A total of 1288 households with 5869 (51% male ad 49% female) people live in the Park and Buffer Zone (SNPBZ); among them 87.8% are Buddhist and 11.8% Hindu [5]. Nearly 1/3rd of the park area (65.6%) is barren and lies above 5000 m; other land use type are glacier (16.24%), grassland (6.88%), shrubs/bush (5.9%), forest (3.31%), settlement and agriculture (0.79%), ponds/lakes (0.59%), river/spring (0.01%) [6]. About 80% of the precipitation falls in the monsoon season (June to September). Lukla and Namche Bazaar receive 950 and 860 mm precipitation per year, respectively, and precipitation decreases with elevation. An average minimum temperature is in January whereas maximum during August (−7.7˚C to 16.2˚C).
The Sagarmatha region is drained north to south by three major rivers namely, Dudh Kosi, Bhote Kosi and Imja Khola. Imja Khola originates from Khumbu glacier and Dudhkosi from Ngozumpa glacier. Bhotekosi originates in Tibet and it meets Dudhkosi at Larja dobhan below the Namche Bazaar. Several tributaries feed these major river systems. The major lakes in the SNP are Imja and Gokyo.
3. Materials and Methods
3.1. Sample Collection
Water samples from thirteen locations were collected and analyzed in three consecutive years—28 Oct. - 17 Nov. 2008, 3 - 26 June, 2009 and 16 - 31 May 2010. The criteria of selection of sampling points were based on outflow region of lakes, vicinity of tourist trail located on the banks of wetlands and sources of major river system.
3.2. Sample Preservation
Water samples were collected from the water bodies in acid rinsed polythene bottle of capacity 125 ml. Three drops of concentrated nitric acid were used to adjust the pH of the samples below 2 (acidic medium) to preserve it. The samples were brought to Kathmandu and analyzed in Water Engineering Laboratory of Katmandu, and Aquatic Ecology Laboratory of Kathmandu University, Dhulikhel, Kavre.
3.3. Analytical Procedure
Water samples were analyzed for Sodium (Na), Lead (Pb), Manganese (Mn), Copper (Cu), Zinc (Zn) and Iron (Fe) through Flame Atomic Absorption Spectrophotometer. For analysis of these metals, 200 ml of acidified samples were taken in a beaker and added about one ml of concentrated HNO3. Samples were heated at about 100˚C until it’s volume was reduced to 15ml. Samples were transferred into 25 ml volumetric flask and the volume was made up to the mark by adding double distillated water. Reading was taken by Atomic Absorption Spectrophotometer (AAS). All the analyses were carried out adopting standard methods of analysis formulated by APHA [7]. Magnesium (Mg) was measured by volumetric method. For this, 50 ml of the water sample was taken and added with 2 ml of NaOH solution of 1N, mixed with 2 - 3 drops of indicator (Eriochrome Black T indicator). Titration was done against Ethylenediaminetetraacetic acid (EDTA) solution until the color changed. By calculating the volume used in titration, the amount of Mg (mg/l) was calculated by following APHA [7].
4. Results and Discussion
Iron (Fe) content in eighteen water samples was found higher than the WHO (0.3 mg/l) and Nepalese (0.3 mg/l) standard for drinking water (Table 1). It ranged between <0.04 and 8.92 mg/l (Figures 2 and 3) with the highest value at 5th lake of Gokyo (4950 m). In 2008, Fe content in three samples was higher than the standard. These were at Everest Base Camp (0.4 mg/l), Lobuche river at pheriche (0.4 mg/l), and Imja Khola just below Dengboche village (0.7 mg/l). The Fe content increased in 2009; seven samples had higher value than standard: 4th lake of Gokyo (1.38 mg/l), 3rd lake of Gokyo (0.48 mg/l), 2nd lake of Gokyo (0.53 mg/l), Glacier river near to 1st lake (3.06 mg/l), Everest base camp (1.05 mg/l), Lobuche river near Pheriche (1.58 mg/l), Imja Khola near Denboche village (3.6 mg/l). The 4th lake of Gokyo had
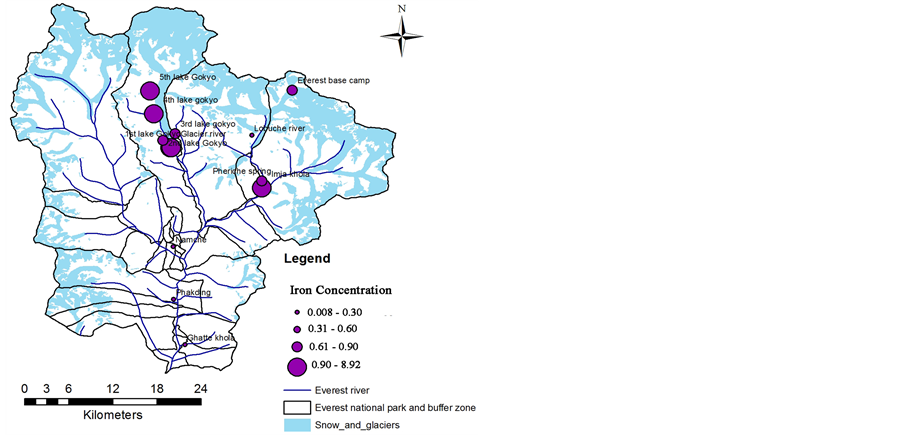
Figure 2. Average iron concentration (mg/l) in Water bodies in the SNPBZ.
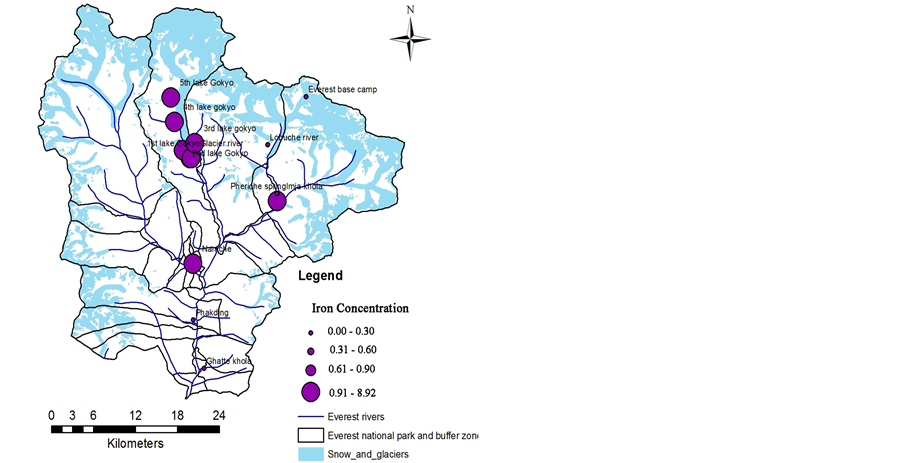
Figure 3. Iron concentration (mg/l) in 2010, in the Water bodies of SNPBZ.
the highest iron concentration among the five lakes in the series in all measurements. Sharma et al. [8] have also recorded almost similar result in the Gokyo lake (1.0 - 1.5 mg/l in 2008 and 0.6 - 1.5 mg/l in 2009). In 2010, eight samples had higher quantity of iron than that of WHO and Nepalese standards for drinking purpose: all five lakes of Gokyo lake series (5th lake - 8.92mg/l, 4th lake - 1.35 mg/l, 3rd lake-1.2 mg/l, 2nd lake - 1.92 mg/l, 1st lake - 1.92 mg/l), glacier river below 1st lake (1.37 mg/l), Imja Khola below Dengboche village (3.5 mg/l), Namche spring (2.46 mg/l) . Hence from the above data, we conclude that the Fe concentration in water bodies has been increasing at the major places.
Sodium (Na) and Magnesium (Mg) were at the lower level than the standard threshold. However, an increasing trend in Na and Mg when compared with the earlier reports were observed. Reynolds et al. [9] had reported 1.61 mg/l (0.71 - 1.61 mg/l) content of Na, where as in present investigation, it was 0.2 - 6.4 mg/l (Figures 4 and 5), 6.4 mg/l in 2nd Gokyo lake in 2008, 3.83 mg/l in Namche spring in 2009, 3.15 mg/l at Imja khola near Denboche village in 2010, 2.8mg/l at Namche spring and 2.78 in 2nd Gokyo lake. Sodium (Na) content recorded in the present study was almost higher than values reported by Sharma et al. [8]. They found 0.9 - 1.1 mg/l in Gokyo lake series in 2008 and 1.0 - 1.2 mg/l in 2009 which was lower than the value record by Sharma et al. [10] reported 0.92 mg/l in 2nd lake, 1.19 mg/l in 3rd lake, 0.26 mg/l in 4th lake.
Magnesium was earlier reported between 0.11 and 0.52 mg/l [9], but in present investigation, it was found between 0.49 at Pheriche and 8.7 mg/l at Namche spring (Figures 6 and 7). At some places, Mg content was high

Table 1. Metal analysis of Khumbu region.
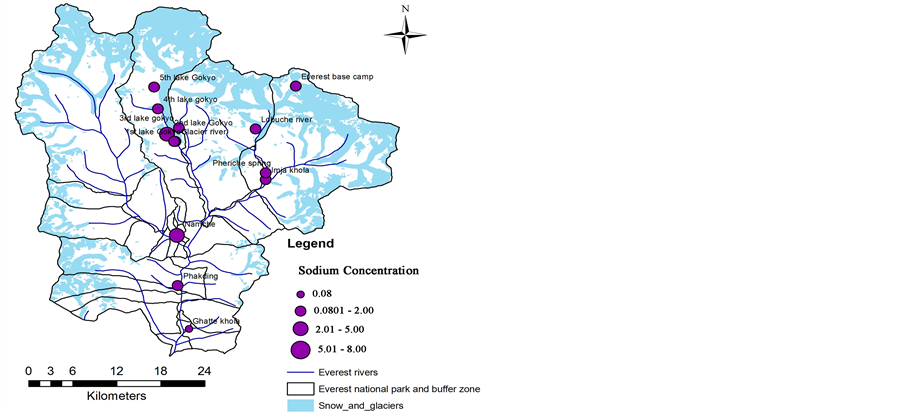
Figure 4. Average sodium concentration (mg/l) in Water bodies in SNPBZ.
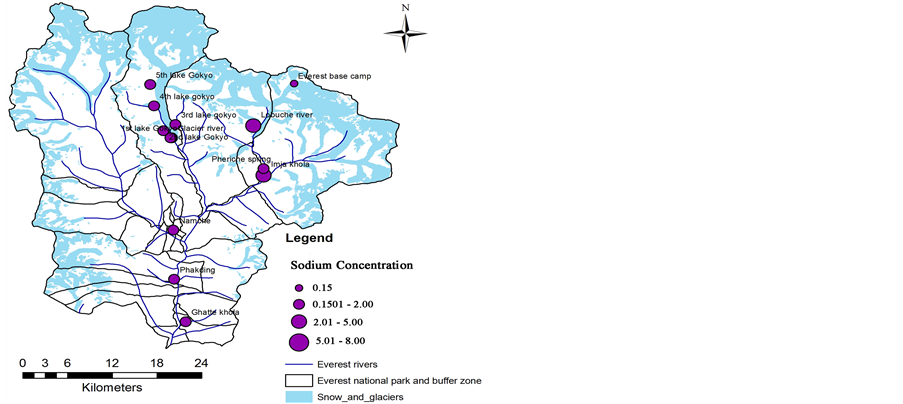
Figure 5. Sodium concentration (mg/l) in 2010 in water bodies in SNPBZ.
such as, 2nd Gokyo lake 6.2 mg/l, 6.2 mg/l at 1st Gokyo lake, 6 mg/l at Lukla (Ghatte khola), 4.86 mg/l at 4th Gokyo lake, 3.7 mg/l value showed by four spots (Glacier river, Lobuche river at pheriche, Imja khola at Denboche, Phakding springs). These values indicate that metal concentration in the Khumbu region is going to increase annually.
Sodium (Na) and Magnesium (Mg) were at the lower level than the standard threshold. However, an increasing trend in Na and Mg when compared with the earlier reports were observed. Reynolds et al. [9] had reported 1.61 mg/l (0.71 - 1.61 mg/l) content of Na, where as in present investigation, it was 0.2 - 6.4 mg/l (Figures 4 and 5), 6.4 mg/l in 2nd Gokyo lake in 2008, 3.83 mg/l in Namche spring in 2009, 3.15 mg/l at Imja khola near
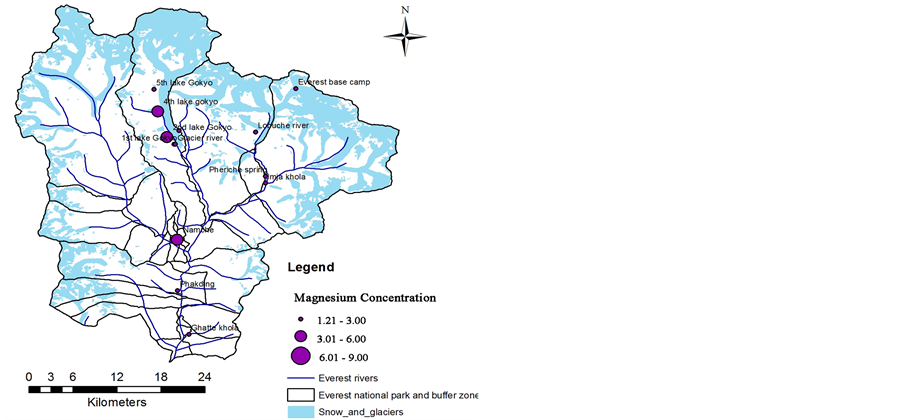
Figure 6. Average magnesium concentration (mg/l) in Water bodies in SNPBZ.
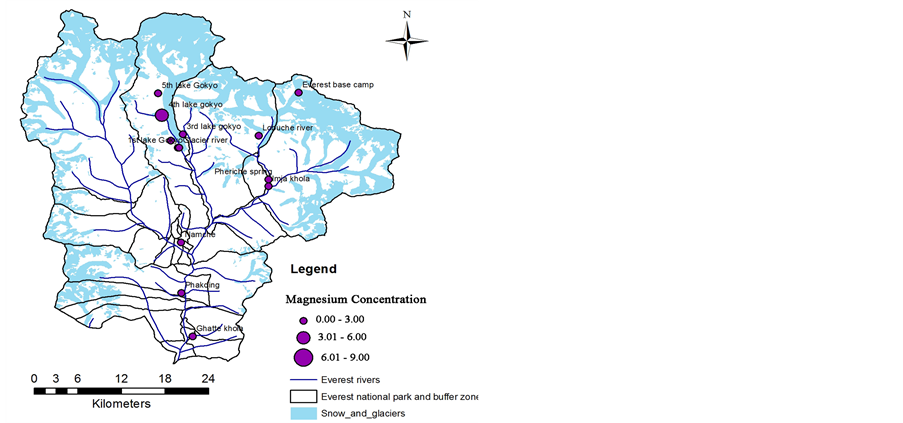
Figure 7. Magnesium concentration (mg/l) in Water bodies in SNPBZ in 2010.
Denboche village in 2010, 2.8 mg/l at Namche spring and 2.78 in 2nd Gokyo Lake. Sodium (Na) content recorded in the present study was almost higher than values reported by Sharma et al. [8]. They found 0.9 - 1.1 mg/l in Gokyo lake series in 2008 and 1.0 - 1.2 mg/l in 2009 which was lower than the value record by Sharma et al. [10] reported 0.92 mg/l in 2nd lake, 1.19 mg/l in 3rd lake, and 0.26 mg/l in 4th lake.
Magnesium was earlier reported between 0.11 and 0.52 mg/l [9], but in present investigation, it was found between 0.49 at Pheriche and 8.7 mg/l at Namche spring (Figures 6 and 7). At some places, Mg content was high , such as,2nd Gokyo lake 6.2 mg/l, 6.2 mg/l at 1st Gokyo lake, 6 mg/l at Lukla (Ghatte khola), 4.86 mg/l at 4th Gokyo lake, 3.7 mg/l value showed by four spots (Glacier river, Lobuche river at pheriche, Imja khola at Denboche, Phakding springs). These values indicate that metal concentration in the Khumbu region is going to increase annually.
Copper (Cu) content was found higher in three water samples collected from Lobuche river (0.04 mg/l), Lobuche river before mixing Imja (0.1 mg/l), Imja khola near to Dingboche village (0.08 mg /l). In increase in copper contamination is observed, however it is less than the prescribed standard level. Manganese (Mn) was found between 0.01 - 0.22 mg/l. 0.22 mg/l at 5th Gokyo lake, 0.11 mg/l in Na mche spring, 0.1 mg/l in Imja near Dengboche village and 0.1 mg/l in Glacier river.
The average concentration of zinc was well below the limit of WHO (3 mg/l) and Nepalese standard for safe drinking water at all the sampling points. Zinc was found between 0.01 mg/l - 0.2 mg/l, however four samples had an increase of Zn in 2009 and 2010 compared to 2008 samplings. The value 0.2 mg/l was recorded at Namche spring where as 0.12 mg/l at 1st Gokyo Lake. The concentration of lead (Pb) was also very low in all samplings Based upon the present study, it can be said that, the concentrations of metals were found gradually increased (2010 < 2009 < 2008 < previous report), particularly Na and Mg. The increase in concentration of heavy metals is related with the waste generated by increased tourism, and improper and unscientific management of solid wastes in the SNPBZ. These visitors are concentrated and overcrowded in spring and autumn seasons creating a pressure on resource. This large number of tourists and trekkers leave a large amount of garbage and human excreta in the SNP. In 1994, the total garbage (waste) altogether burnable as well as non burnable was recorded 1, 26,373 kg at that time international flow was 13,461. This amount was increased with parallel with increased with tourist flow. 2, 13,112 kg of waste in 1999 having tourist number 26,788. In 2007, 221,586 kg of waste , at that time the tourist number was 26,511 [11]. From this, it was concluded that solid waste generation rapdly increased with increased in tourist number which ultimately changed the chemical parameters of water.
5. Conclusion
The average trend in metal concentrations in the water bodies in Sagarmatha National Park and Buffer Zone was in the following order: Pb < Cu < Zn < Mn < Mg < Fe < Na. Sodium (Na), Magnesium (Mg), Lead (Pb), Manganese (Mn), Copper (Cu), Zinc (Zn) were found within the limit set for drinking water (WHO as well as Nepalese standard for drinking water) however degradation process in water quality has been noticed. Results reveal that quantity of these heavy metals has increased in the last few years.
Acknowledgement
We are thankful to Hindukush Karakorum Himalaya (HKKH) partnership project for research grant, Department of National Parks and Wildlife Conservation for permission to work in the SNPBZ, to Sagarmatha Pollution Control Committee (SPCC) for their co-operation.
REFERENCES
- P. K. Jha, “An Overview of Sagarmatha (Mt. Everest) Region,” In: P. K. Jha and I. Khanal, Eds., Contemporary Research in Sagarmatha (Mt. Everest) Region, Nepal: An Anthology, Nepal Academy of Science and Technology, Kathmandu, 2010, pp. 1-14.
- U. R. Bhuju, P. R. Shakya, T. B. Basnet and S. Shrestha, “Nepal Biodiversity Resource Book: Protected Areas, Ramsar Sites and World Heritage Sites,” International Centre for Integrated Mountain Development (ICIMOD), Kathmandu, 2007.
- G. U. Carovello, A. M. Boselli, P. Bertollo and A. Baroni. “Assessing Ecosystem Health: An Analysis of Tourism Related Change and Impact in Khumbu Valley, Nepal,” Ecoprint: An International Journal of Ecology, Vol. 14, 2007. 45-64.
- N. G. Ghimire, B. B. Shrestha, G. U. Caravello and P. K. Jha, “Sources of Water Pollution in Sagarmatha National Park and Buffer Zone, Nepal,” In: P. K. Jha and I. Khanal, Eds., Contemporary Research in Sagarmatha (Mt. Everest) Region, Nepal: An Anthology, Nepal Academy of Science and Technology, Kathmandu, 2010, pp. 103-109.
- CBS, “Central Bureau of Statistics of Year Book,” Central Bureau of Statistics, Kathmandu, 2001.
- WWF, “Sagarmatha Community Agroforestry Project. A Retrospectrive (1996-2002),” World Wide Fund/Nepal, Kathmandu, 2003.
- APHA, AWWA, WPCF, “Standard Methods for Examination of Water and Waste Water,” American Public Health Association, Washington DC, 2005.
- C. M. Sharma, S. Sharma, S. Gurung, I. Juttner, R. M. Bajracharya and N. Shrestha Pradhan, “Ecological studies within the Gokyo wetlands, Sagarmatha National Park, Nepal,” In: P. K. Jha and I. Khanal, Eds., Contemporary Research in Sagarmatha (Mt. Everest) Region, Nepal: An Anthology, Nepal Academy of Science and Technology, Kathmandu, 2010, pp. 139-154.
- B. Reynolds, A. Jenkins, P. J. Chapman and J. Wilkinson, “Stream Hydrochemistry of the Khumbu, Annapurna and Lantang Regions of Nepal,” In: Top of the World Enviromental Research: Mount Everest-Himalayan-Ecosystem, Backhuys Publishers, Leinden, 1998, pp.123-140.
- C. M. Sharma, S. Sharma, R. M. Bajracharya, S. Gurung, I. Juttner, S. Kang, Q. Zhang and Q. Li, “First Results on Bathymetry and Limnology on High-Altitude Lakes in the Gokyo Valley, Sagarmatha (Everest) National Park, Nepal,” Limnology, Vol. 13, No. 1, 2012, pp. 181-192. http://dx.doi.org/10.1007/s10201-011-0366-0
- Sagarmatha Pollution Control Committee (SPCC), Annual Progress Report 2004/05-2005/06, Namche, Nepal, 2007.
NOTES
*Corresponding author.