Journal of Water Resource and Protection
Vol. 3 No. 5 (2011) , Article ID: 4976 , 12 pages DOI:10.4236/jwarp.2011.35036
Groundwater Protection Using Numerical Simulations Applied to the Carbonate Aquifer Resource in the Augusta’s Industrial Area (Sicily, Italy)
1ENEA, Casaccia, Rome, Italy
2Centre for GeoTechnologies, University of Siena, San Giovanni Valdarno, Italy
3Earth Sciences Department, University of Catania, Catania, Italy
4CRS4 Cagliari, c/o Technology Park Pixinamanna, Pula, Italy.
E-mail: andrea.carloni@enea.it, guastaldi@unisi.it, ferrara.vincenzo@eutelia.com, fender@crs4.it
Geostatistics
Received February 12, 2011; revised March 17, 2011; accepted April 19, 2011
Keywords: Carbonate Rocks, Groundwater Flow, Monte Carlo Simulation, Numerical Modeling,
ABSTRACT
Simulation of flow in fractured aquifers is a complex issue. The problem of mathematical modeling of highly heterogeneous porous media, typical of natural systems, couples with the needs making proper simplifying assumptions and approximations. In this kind of groundwater systems, studying contamination spreading and analyzing risk are challenging tasks. The main difficulty stems from determining both the travel times and the maximum distances covered by pollutants. In this context, the risk of contamination in the deep carbonate aquifer of the Augusta coastal area is presented. We used a geostatistical approach and numerical codes (MODFLOW-2000, MT3DMS) to reconstruct the complex geological framework of the study area where several contamination scenarios of hypothetical point source in a risk assessment framework were simulated. Results on the contaminant spreading are discussed and the effect of the geological structures characterizing the zone under study, namely horst and graben, are described.
1. Introduction
The carbonate aquifer in coastal Augusta area (Syracuse, Italy) represents an important drinkable water reserve that has undergone a strong depletion because of overexploitation by many local industrial factories. This has caused both a decrease of the groundwater level and the problem of seawater intrusion. Due to its importance, the hydrogeological characteristics of coastal area between Augusta and Priolo cities have been investigated with a twofold objective, namely, evaluating the consequences of an accidental contamination scenario and planning a sustainable and rational groundwater resource exploitation. As described below, this has been achieved through a number of steps such as the realization of the conceptual model of the aquifer system, the spatial reconstruction of the hydrogeological system and soil properties, and the setup and runs of the numerical flow and transport models. Finally, on the base of the results of the numerical runs, a risk analysis was performed and the conclusions were drawn.
2. Climatic, Geologic and Hydrogeological Setting
The morphology of North-Eastern part of Iblean Plateau, the zone where Augusta area lies, is characterized by gentle relieves and alluvial terrace surface, with torrential river flows affected by both climatic factors and high hydraulic conductivity (K) of outcropping carbonate formations. The cumulative annual mean rainfall is 660 mm, the mean temperature varies from 12˚C to 24˚C, and the annual potential evapotraspiration is around 900 - 1000 mm. The huge Mesozoic-Tertiary carbonate succession (“Monti Climiti” Formation, Mc in Figure 1; [1,2]) with intercalations of several volcanic Early Miocenic levels (Tortonian “Carlentini” Formation, Mv in Figure 1; [3,4]) characterizes the study area. The stratigraphic sequence ends with Plio-Pleistocenic terrige-
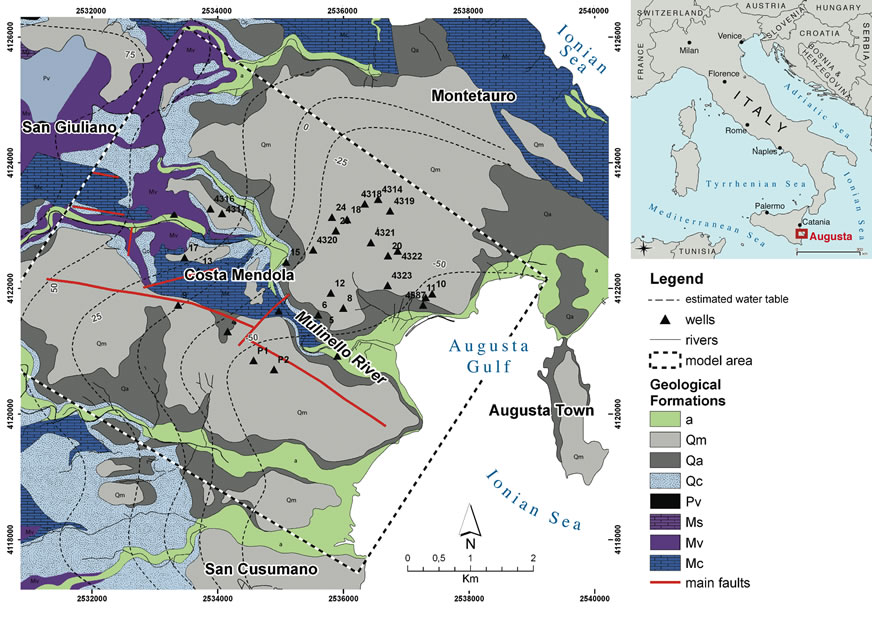
Figure 1. Schematic geological map of the Augusta area, the north eastern part of Iblean Plateau (Sicily, Italy): (a) Alluvial deposits; (Qm) Late pleistocene sands and calcarenites; (Qa) Early pleistocene clays; (Qc) Early pleistocene sands and calcarenites; (Pv) Pliocenic volcanites; (Ms) Tortonian-messinian “monte carrubba” formation; (Mv) Volcanic tortonian “carlentini” formation; (Mc) Aquitanian-serravallian “monti climiti” formation.
nous deposits, mainly coastwise outcropping [5], constituted by yellowish calcarenites (Late Pleistocene, Qm in Figure 1) at the bottom, and partially heteropic blue clays at the top (Late Pleistocene, Qa in Figure 1). The zone is characterized by horst and graben structures that are bounded by dislocations belonging to the pre-Pleistocenic NW-SE or WNW-ESE fault system [5], and by the ENE-WSW or NE-SW dislocations referred to the Plio- -Pleistocenic tectonic phase [3]. Sands-calcarenitic and clays-calcareous Pleistocenic sediments (Qc in Figure 1) fill up the grabens, whilst limestones outcrop on the top of hosts. The North-Western Augusta and the South- -Western S. Cusumano graben are the main hydrogeological structures and these separated by the Costa Mendola horst.
The upper confined aquifer below the impervious clay sediments is constituted by late Pleistocenic calcarenites and sands that fill up the grabens. These sediments have a medium-high hydraulic conductivity due to porosity and partially to fracturation (K = 10–3 – 10–4 m/s). The deep aquifer in Miocenic limestones is the main reservoir of the area that has a high hydraulic conductivity due to porosity and fracturation (K = 10–1 – 10–2 m/s). Locally, there is a volcanoclastic level (“Carlentini” formation), with low hydraulic conductivity (K = 10–7 –10–9 m/s) that separates the two aquifers. Almost continuous volcanoclastic levels can be found within the aquifer that determine further confined aquifer levels with different thickness. The regional groundwater flow is oriented along the WNW-ESE direction according to the grabens structures, whilst the hydrogeological watershed is located on the Costa Mendola carbonate horst. The piezometric surface level lowered from the sixties to the eighties of the past century, due to the over exploitation that determined seawater intrusion in the carbonate deep aquifer [6].
3. The Hydrogeological Conceptual Model
The conceptual model and the reconstruction of the stratigraphic surfaces were made relying on boreholes data, isobaths maps of pre-Quaternary sediments, and isopachs map of Pleistocene formations [7] that were processed by means of geostatistical analysis tools. The spatial distribution of these regionalized variables [8] was made using the classical mutual distance of measured points functions and/or modeling experimental semi-variograms. After verifying the model by cross-validation procedure, the ordinary kriging geostatistical interpolation was applied [9]. The three dimensional model shows the main hydrological and hydrogeological structures that define the principal aquifers, the geometry, thickness, and the tectonic-stratigraphic relations of geological formations (Figure 2). The Marcellino and Mulinello rivers are the main hydrogeological components that are connected with the aquifer, causing both drainage effect in the north western part of area and recharge in the southern-eastern zone. The water balance is the sum of the recharge terms, namely, rainfall and the groundwater inflow from the north-west boundary domain area, and discharge terms, namely, wells exploitation, evapotranspiration and the groundwater flow towards the sea in the south-east boundary domain area.
4. Method: Numerical Simulation
Numerical simulation of groundwater flow in fractured aquifers implies coping with the problem of strong soil heterogeneity of the medium. Different systems of faults and fractures intersect a highly heterogeneous soil matrix in which clay alternates with carbonates, vulcanites and other soil textures. The main issue is to find a compromise between simplifying assumptions that make the problem amenable, and the preservation of the main characteristics of the ongoing flow and transport processes. The reliability and the effectiveness of the approximations made directly impact on both the quality of the modeling and the risk analysis for estimating maximum contaminant spreading and travel times. However, to further transfer soil and rock characteristics into the model a geostatistical approach for conditioning hydraulic conductivity was implemented. From the mathematical point of view, it is worth to be remarked that contaminant migration is governed by the classical flow and transport equations for porous media.
4.1. Modeling Flow in Fractured Aquifers Using a Stochastic Approach
The mathematical modeling of flow in fractured aquifers is generally a very complex issue, as the flow regime of water in fractures is generally quite different from that in porous media. On the one hand, it might expect the flow to be turbulent in fractures and laminar in the porous medium; on the other hand, there is no evidence of fully connected fracture systems. Thus, flow lines are not fully contained in the fractured pattern but they intercept the soil matrix. The net result is that the flow velocity can be assumed to be laminar globally. From the modeling point of view, this can be obtained by identifying a network of local preferential paths characterized by a large hydraulic conductivity that is immerged in a low (or at least lower) hydraulic conductivity porous matrix. However, water circulation in an aquifer can be schematized at different scales, depending on the type of process considered. Heterogeneous processes at a small scales become homogeneous processes at a larger scale using an equivalent porous medium [10].
The case under study is a carbonate aquifer in which the flow network can be assumed mainly dispersive. This network is basically characterized by two distinct circulation patterns, namely, the fracture network that constitutes a preferential path for water movement; and a porous matrix in which water flows and is released more slowly. This distinction of the soil into fractures and porous matrix cannot be considered an absolute statement, as it should be intended a limit situation of real scenarios whose conditions are generally not that clearly marked. In this case, large faults and different systems of intersecting fractures are present, as well as different types of porous media from high (carbonates) to very low permeability (vulcano-clastic units) and impervious units (clayey stratum). As expected, the flow of water into this kind of soils should be considered as a continuum of non-separable processes.
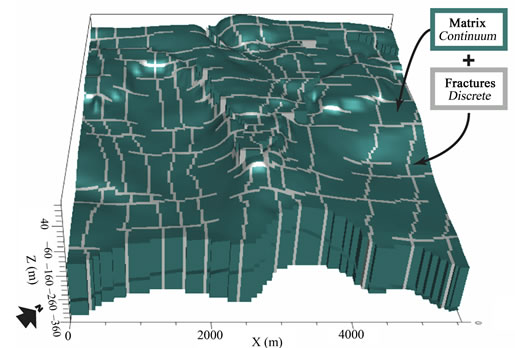
According to this rationale, the CDC (Combined Discrete and Continuum Approach) has been chosen for modeling these miscellanea of soils and structures [11]. The properties of the carbonate aquifer are defined as follows. On the small scale, the medium can be considered as a continuous with a primary porosity that of the carbonate aquifer. Instead, permeability derives from a kind of blend of internal and stratigraphic fracturing that, however, can be assimilated as a special porous medium with a given assigned primary permeability (Figure 3).
The main fracture systems are associated to tectonic lineaments that are explicitly traced on the domain under study. This network of faults is assigned a specific value of permeability as if it were an equivalent, continuum, high-permeability porous medium. Again the CDC schematization fits to the project objective, as it allows us to map the characteristics of the zone under study to the computational domain with a sufficient degree of accuracy. This is obviously referred to the main system of faults related to geological discontinuities that cross the zone.
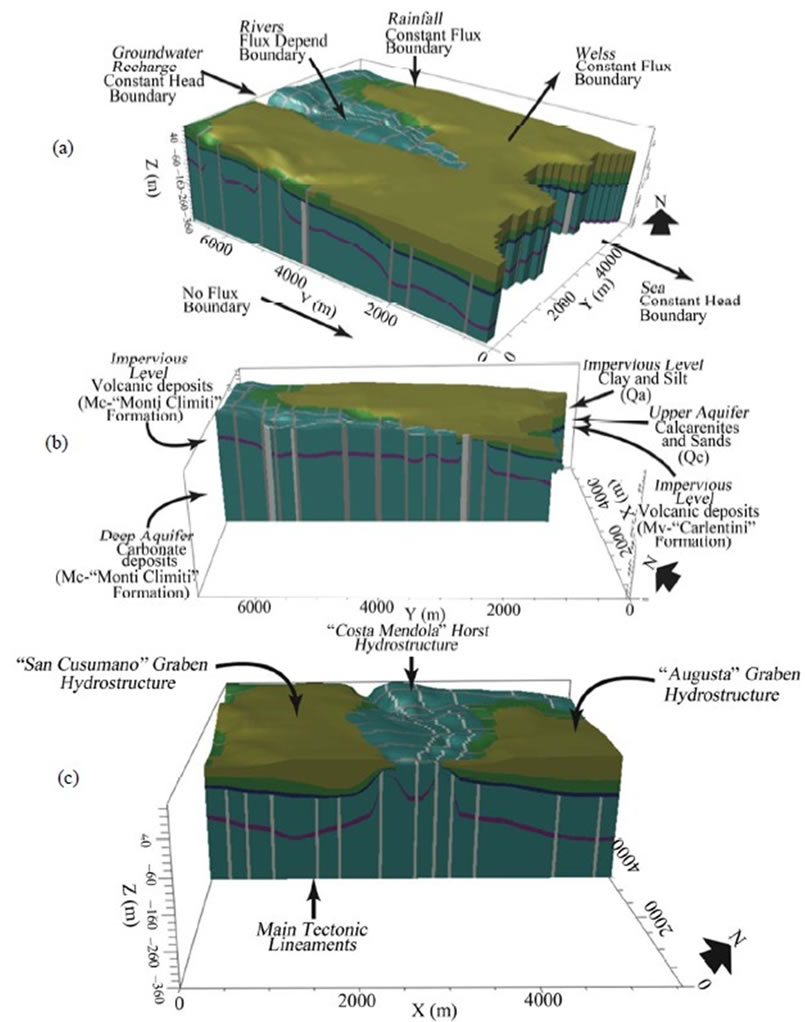
Figure 2. (a) Hydrogeological boundary conditions; (b) Stratigraphic cross-section on the costa mendola graben and hydraulic characteristics of geological formations; (c) Stratigraphic cross-section in SSW-NNE direction showing the main hydrostructures.
How to model the soil at a smaller scale? The soil in which explicit major faults are merged can be considered as a blend of smaller fractures and soil matrix. Actually, it was not schematized it as an equivalent porous medium. Instead, the following procedure was applied: firstly a porous medium was intended with permeability equal to the average value of the layer. Then, it was assumed that spatial variations of the permeability value were present in the domain and that, those variations were distributed as a discrete (a set of histogram, Figure 4) Gaussian-like function with an average value equal to the permeability of the layer.
Values of permeability higher than the average are supposed to mimic fractures, whereas values of permeability lower than the average mimic clogs, low-spatial density fractures, or weathered fractures. From the operational point of view, each element of the three-dimensional grid is assigned a permeability value according to a random generator that uses the probability density function described above. The hydraulic conductivity values of the deep carbonate aquifer were assigned by a specific procedure written in PERL language through proper algorithm acting directly on the MODFLOW simulator input file. A stochastic distribution Monte Carlo type [12], based on a properly formulated Gaussian probability density function was used for generating the statistical component of the hydrodynamic properties of the model. This component was assigned keeping into account the main geological structures of the zone, according to both the literature and the three- -dimensional model reconstruction.
 (a)
(a)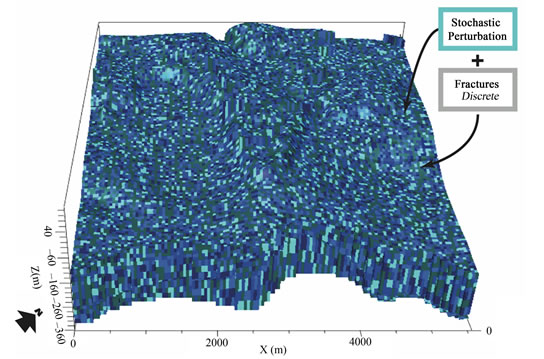 (b)
(b)
Figure 3. Conceptual CDC approach to assign the hydraulic conductivity to deep carbonate aquifer.
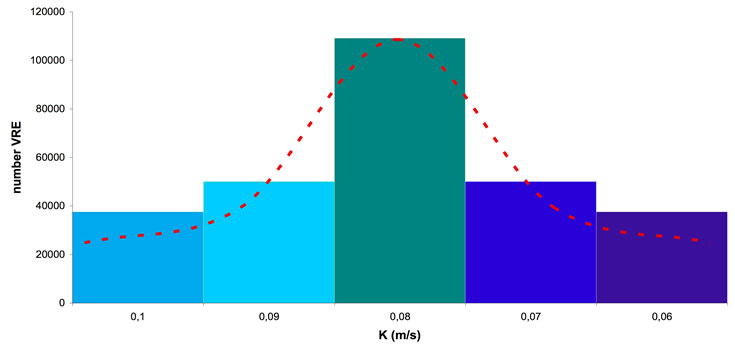
Figure 4. Gaussian-like distribution of hydraulic conductivity of deep carbonate aquifer.
4.2. Groundwater Numerical Flow Model
Flow simulations have been performed using the MODFLOW-2000 code [13] that is a finite differences based numerical simulator.
The extension of model area is almost 39 km2 coastwise (Figure 1). This has been discretized in space using a rectangular mesh, composed by 55 m × 45 m cells, with the major side parallel to the groundwater flow direction, for a total of almost 263 000 nodes. The domain is discretized in 16 layers, that follows the heterogeneities of the medium, namely the fractures related to main tectonic structure and the thickness of low hydraulic conductivity strata.
Boundary conditions for numerical simulations were setup as follows. A constant-head condition with linear gradient was assigned in NNW boundary (inflow) and in the SSE boundary (sea-outflow). Constant fluxes were assigned to the extraction wells, as well as for rainfall recharge and evapotranspiration. Finally, the influence of the surface water body (Marcellino and Mulinello rivers) was accounted for using a flux-dependent condition.
Once the model has been setup, steady-state flow was simulated for calibrating model parameters and performing sensivity analysis. Much effort was devoted mainly to calibrating hydraulic conductivity. This operation was performed through minimization of the differences between simulated and measured heads [9].
5. Results of Contaminant Transport Simulation
After calibrating the flow, a preliminary contamination risk analysis was performed for the aquifer, by simulating contaminant transport using the MT3DMS code [14]. It was assumed that contaminant transport in a fracturated aquifer is mainly due to advection, while dispersion determines its dilution [15,16]. In particular, simulations run in order to account for the worst case scenario, thus it was neglected adsorption phenomena and decay reactions. Dispersion coefficients were assigned accounting both the scale of the domain under study and the characteristic dimension of the spatial discretization of the computational grid.
Two hypothetical point sources of contamination in the carbonate horst were considered, namely where the aquifer outcrops and, thus it is mainly vulnerable. Simulations were run taking into account both contamination targets distances (wells), and aquifer vulnerability condition (Figure 5).
In the first scenario, the contamination source was located close to the drink water wells on the central area of Costa Mendola horst, while the second contamination source (second scenario) has been positioned on the outcropping limestones close to Mulinello River in the north-western horst area. This was aimed at both investigating the influence of the river on the contamination dispersion and evaluating the aquifer watershed effect. A constant-concentration condition was assigned in the contaminant point-source locations. Given the very high hydraulic conductivity values of the aquifer that indicate a theoretical 7-days travel time from the NNW boundary to the SSE boundary, a simulation time of one month was considered (this was also acceptable in terms of computational time).
5.1. First Scenario
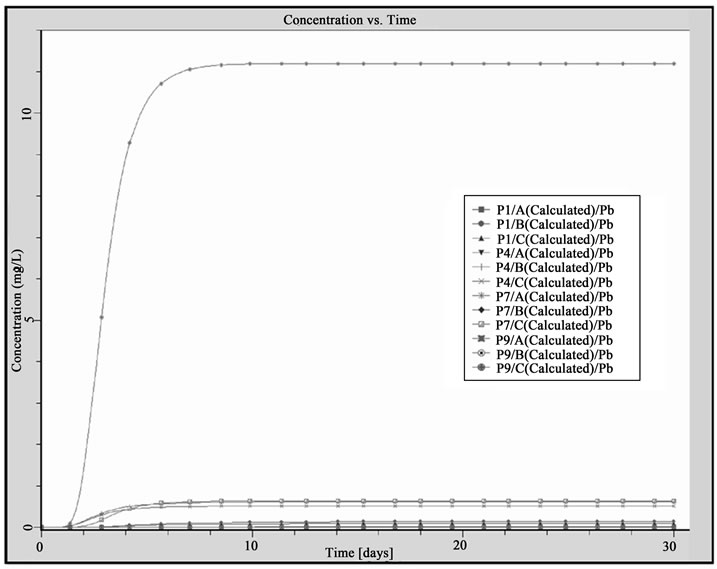
The plume tends to spread laterally (up to 1000 m) until the 10th simulation day, then the plume shape can be considered stationary at the 30th day. When considering the vertical spreading, the plume impacts the whole aquifer saturated portion, with higher concentrations in the upper part, as can be seen by comparing contour maps at three different-elevation layers. Also in this case, the plume shape stabilized at –300 m a.m.s.l. between the 7th and the 10th simulation day. Figure 8 shows the concentration values versus time only for drink water wells; the solution model returns concentration values lower than 9.E-11 mg/l for the entire simulation time, not allowing the contamination to reach the drinkable water wells area Figure 8 (a).
On the other hand, the contamination plume reached industrial wells at 3rd simulation day, while stabilized at its maximum concentration between the 10th day (P7 well) and the 16th day (P1, P2, P4 wells); only P2 and P7 exceeded 1 mg/l concentration value, the observation threshold (Figure 6 and Figure 8 (a)).
5.2. Second Scenario
The contaminant plume splits in two different branches since the 3rd simulation day, due to the aquifer watershed. In this case, a higher risk of contamination was noted for the zone under study, especially because the plume marches towards the water supply wells that are located in NNE sector of model domain (Figure 7).
The spreading of contamination plume mainly occurs towards the San Cusumano graben (SSW sector), according to the hydraulic gradient that is stronger in that zone than elsewhere. Whilst, the contamination plume spreading to Augusta graben does not impact the complete hydrostructure, but it remains comprised between the Costa Mendola horst and the Augusta graben, without directly interesting the drink water wells area. However, the mentioned split of the contaminant plume is an
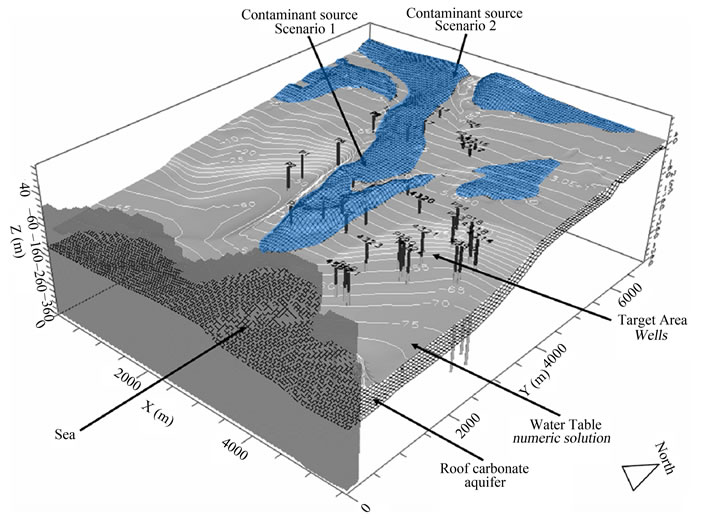
Figure 5. Initial conditions for the transport: groundwater flow numerical solution, point sources of contamination, target area, and reservoir roof geometry (deep carbonate aquifer).
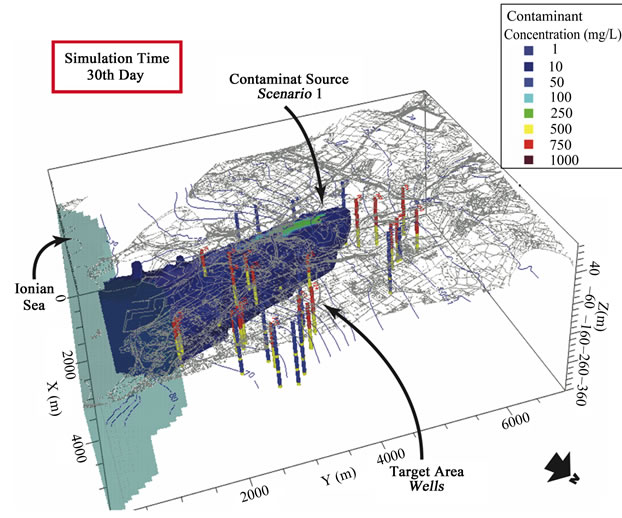
Figure 6. 3D view of transport numerical model solution for scenario 1: contamination plume (minimum threshold concentration = 1 mg/l) at 30th simulation day.
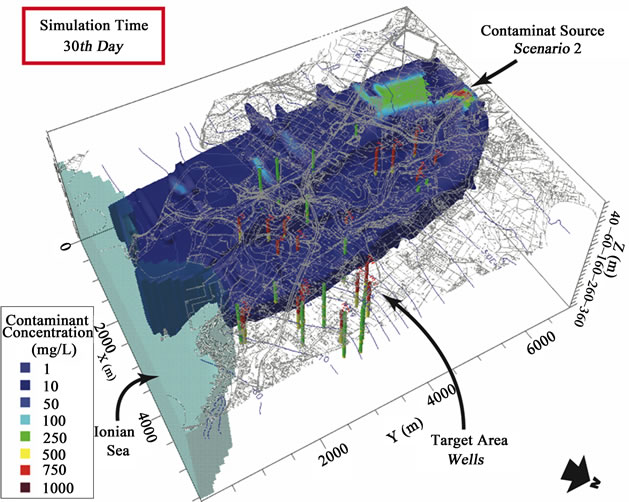
Figure 7. 3D view of transport numerical model solution for scenario 2: contamination plume (minimum threshold concentration = 1 mg/l) at 30th simulation day.
 (a)
(a)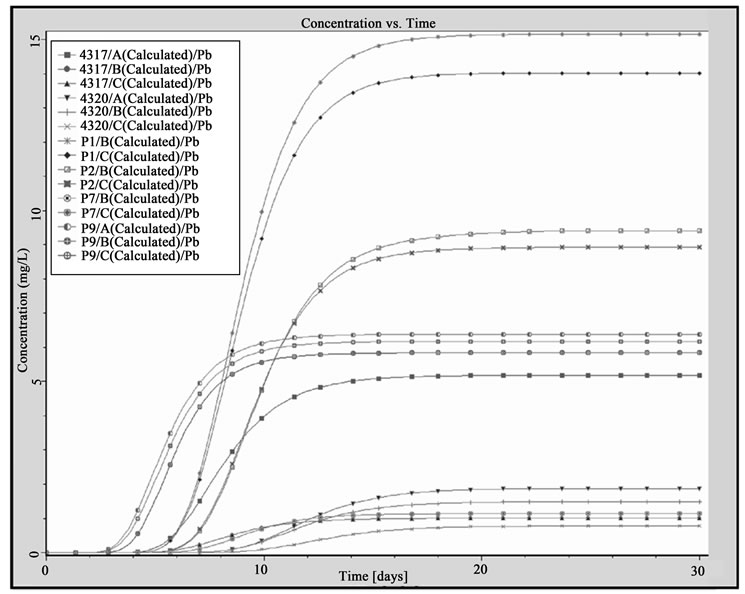 (b)
(b)
Figure 8. Concentration of pollutants observed in the drink water wells and industrial wells: (a) scenario 1; (b) scenario 2.
index of the potential risk that this zone undergoes and it deserves further investigation.
Results at the 10th simulation day (section A-A’ in Figure 10) show a strong vertical spreading of the contamination plume, due to the influence of the high-conductivity fracturated zones. In the current simulations, results seem not to indicate a quality degradation of groundwater in the capture zones of drink water wells (Figure 7 and Figure 9). Moreover, the plume contaminates Costa Mendola horst and San Cusumano graben area, thus P9, P7, P4, P2, and P1 wells get impacted between the 15th and the 23rd simulation day. Again, the contaminant plume spreading reaches a pseudo steady-state after the 30th simulated day (Figure 8 (b) and Figure 10).
6. Conclusions
In this work preliminary results regarding the potential contamination risk of the water supply wells of the industrial Augusta coastal plane were presented. As discussed above, the zone, characterized by a horst and graben geological structure, represents a challenge for modelers, given the complexity of the soil layers that are crossed by faults and different fracture systems embedded in a soil matrix in which clayey, volcanitic and carbonate layers alternate. Given this complicated scenario, the modeling problem was approached by a stepwise procedure, aimed at making the problem treatable from the mathematical and numerical point of view without any relevant loss of information with regards to water flow in the aquifer. Main faults were explicitly included in model, whilst the various fracture systems presents in the carbonates were modeled as high permeability spots in the soil matrix, whose probabilistic distribution and spatial location was assigned by means of geostatistical analysis, given the lack of information at small scale of soil heterogeneities and degree of soil fracturation.
This approach constituted the base for simulating the flow field of the aquifer. Simulated heads were in good agreement with the measured ones that clearly indicated how the aquifer system of the Augusta zone is strongly confined by the two main tectonic graben depressions, while, on the contrary, it has a phreatic free surface where the graben structures is present. Two scenarios for evaluating the risk of contamination of water supply wells were considered. A set of potential contaminant point sources were considered and the relative plume spreading was simulated.
Scenario no. 1 indicates that a potential point source in the SSE part of the horst structure should not affect these wells that are located in the NNE part of the northern graben. On the contrary, scenario no. 2 shows the watershed divide effect on the plume spread, as it splits into two sub-plumes, one for each graben. In this second case, the contamination might impact the northern part of the graben that is close to the carbonate horst where some water supply wells are present. This suggests that further study is needed.
Finally it is worth remarking that these results must not be consider as conclusive at all, but the effort in trying to pass from a conceptual model to a risk analysis by means of the choice of the approximations of soil characteristics and a proper use of some geostatistical tools in conjunction with numerical simulation of flow and
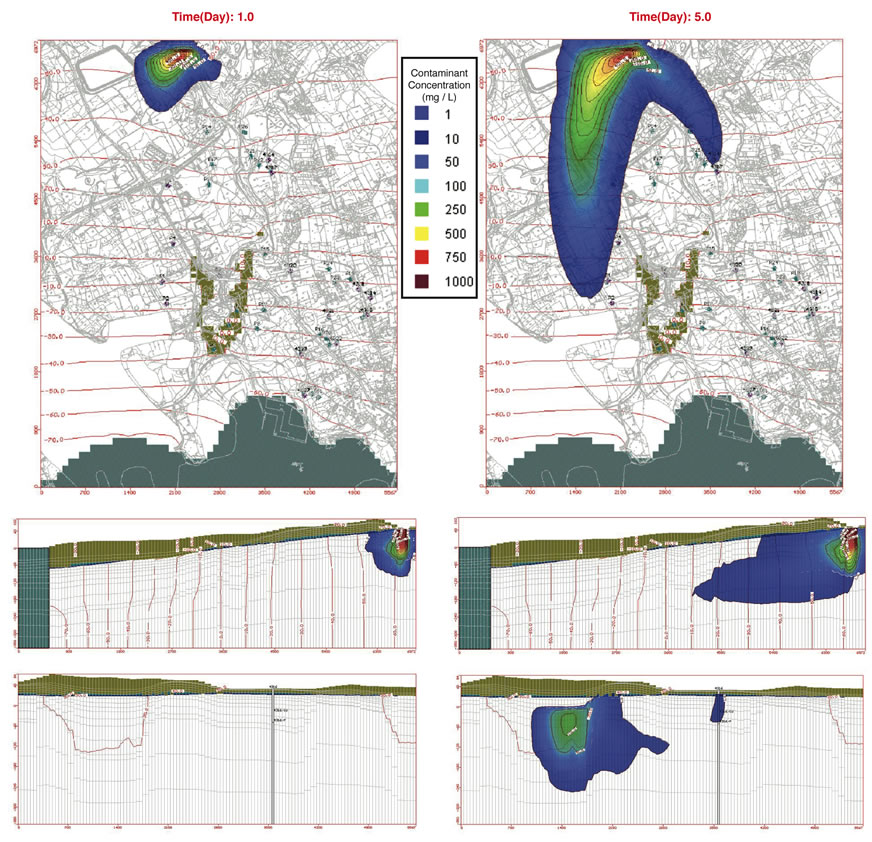
Figure 9. Maps and cross-sections of numerical model solution for scenario 2 at 1st and 5th simulation days: contamination plume (minimum threshold concentration = 1 mg/l).
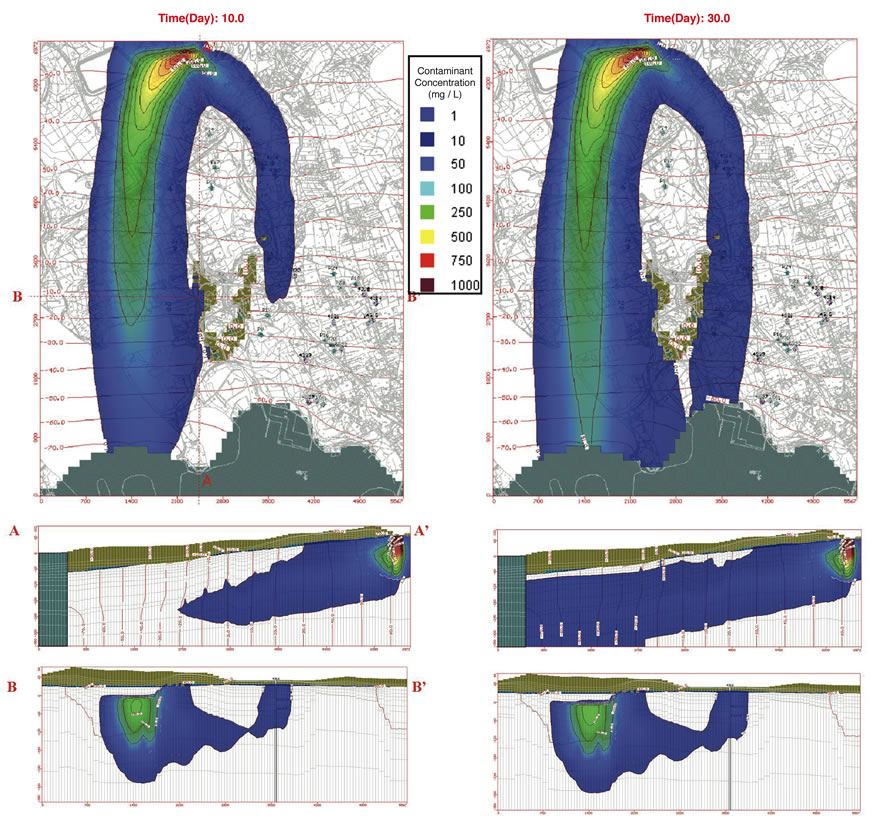
Figure 10. Maps and cross-sections of numerical model solution for scenario 2 at 10th and 30th simulation days: contamination plume (minimum threshold concentration = 1 mg/l).
transport has lead to obtain encouraging results.
REFERENCES
- M. Grasso and F. Lentini and S. Carbone, “Carta Geologica Del Settore Nord - Orientale Ibleo,” Memorie della Società Geologica Italiana, Lineamenti Geologici del Plateau Ibleo, Presentazione Delle Carte Geologiche Della Sicilia Sud - Orientale, XXXVIII, fasc. unico.
- H. M. Pedley, “Sedimentology and Palaeoenvironment of the Southeast Sicilian Tertiary Platform Carbonates,” Sedimentary Geology, Vol. 28, No. 4, 1981, pp. 273-291. doi:10.1016/0037-0738(81)90050-6
- S. Carbone and F. Lentini, “Rapporti Tra Vulcanesimo Miocenico e Tettonica Nel Settore Orientale Dei Monti Iblei (Sicilia Sud-Orientale),” Rend. Soc. Geol. It., Vol. 4, 1985, pp. 245-248.
- M. Grasso and F. Lentini, “Sedimentary and Tectonic Evolution of the Eastern Hyblean Plateau (South-Eastern Sicily) during Late Cretaceous to Quaternary Time,” Palaeogeography, Palaeoclimatology, Palaeoecology, Vol. 39, No. 3-4, 1982, pp. 261-280. doi:10.1016/0031-0182(82)90025-6
- S. Carbone, M. Grassoand F. Lentini, “Considerazioni Sull’Evoluzione Geodinamica Della Sicilia Sud-Orientale dal Cretaceo al Quaternario,” Geological Society of Italy Memoir, Vol. 24, 1982, pp. 367-386.
- V. Ferrara and A. Pennisi, “Salt Water Intrusion and Its Influence on Groundwater Use in the Siracusa Area (South-Eastern Sicily),” Proceedings of 13th Salt-Water Intrusion Meeting, Cagliari, 1994, pp. 227-234.
- S. Carbone, “I Depositi Pleistocenici Del Settore Nord- -Orientale Ibleo Tra Agnone e Melilli (Sicilia SE): Relazione Tra Facies e Lineamenti Strutturali,” Boll. Soc. Geol. It., Vol. 104, 1985, pp. 405-420.
- G. Matheron, “The Theory of Regionalized Variables and Its Applications,” Ecole Nationale Superieure des Mines de Paris, Fontainebleu, 1971.
- J. P. Chiles and P. Delfiner, “Geostatistics: Modeling Spatial Uncertainty,” Wiley, New York, 1999.
- J. Bear, “Hydraulics of Groundwater,” McGraw-Hill, Boston, 1979.
- L. Kiraly, “Modelling Karst Aquifers by the Combined Discrete Channel and Continuum Approach,” Bulletin du Centre d’Hydrogeologie, Vol. 16, 1998, pp. 77-98.
- R. Y. Rubinstein and D. P. Kroese, “Simulation and the Monte Carlo Method,” 2nd Edition, John Wiley & Sons, New York, 2007. doi:10.1002/9780470230381
- A. W. Harbaugh, et al., “MODFLOW-2000, the U.S.G.S Modular Ground-Water Model - User Guide to Modularization Concepts and the Ground-Water Flow Process,” Open File Report 00-92, USGS, Denver, 2001.
- C. Zheng and P. P. Wang “A Modular Three-Dimensional Multispecies Transport Model for Simulation of Advection, Dispersion and Chemical Reactions of Contaminants in Groundwater Systems,” Documentation and User’s Guide, Department of Geology and Mathematics, University of Alabama, Birmingham, 1998.
- K. Spitz and J. Moreno, “A Practical Guide to Groundwater and Solute Transport Modeling,” John Wiley & Sons, New York, 1996.
- J. Bear and A. Verruijit, “Modeling Groundwater Flow and Pollution,” Reidel Publishing Company, Dordrecht, 1987.