Journal of Water Resource and Protection
Vol. 2 No. 7 (2010) , Article ID: 2233 , 10 pages DOI:10.4236/jwarp.2010.27071
Chesapeake Bay Tidal Characteristics
1Department of Civil and Environmental Engineering, Mississippi State University, Starkville, USA
2US Army Corps of Engineers, Coastal and Hydraulics Laboratory–ERDC, Vicksburg, USA
E-mail: xiongyiwv@yahoo.com
Received January 23, 2010; revised March 19, 2010; accepted May 7, 2010
Keywords: Chesapeake Bay, Tidal Characteristics
ABSTRACT
The basic knowledge of tidal characteristics in Chesapeake Bay is a prerequisite to understand the tidal processes in Chesapeake Bay. The tidal characteristics in Chesapeake Bay were assessed in this paper using basic tidal hydraulic analysis. Tidal elevation, currents and salinity data of Chesapeake Bay from National Oceanic and Atmospheric Administration (NOAA) were retrieved, and analyzed to understand Chesapeake Bay tide. General knowledge of location, geometry, tides, freshwater inputs, wind, salinity, etc in Chesapeake Bay was described. Sediment distribution of Chesapeake Bay was briefly described and discussed. Amplitude and phase of the selected major constituent, form factor, phase difference between tide elevations and currents at a few tidal elevation stations within Chesapeake Bay were calculated. Tidal prism was figured out using cubature method. The analysis approach could also be used as a source of reference for basic tidal study in other tide-affected field.
1. Introduction
Chesapeake Bay encountered a severe environmental suffering during past a few decades, due to nitrogen, phosphorus and sediment pollution. It has been recognized that environmental quality factors are directly dependent on the tides in the Bay [1].
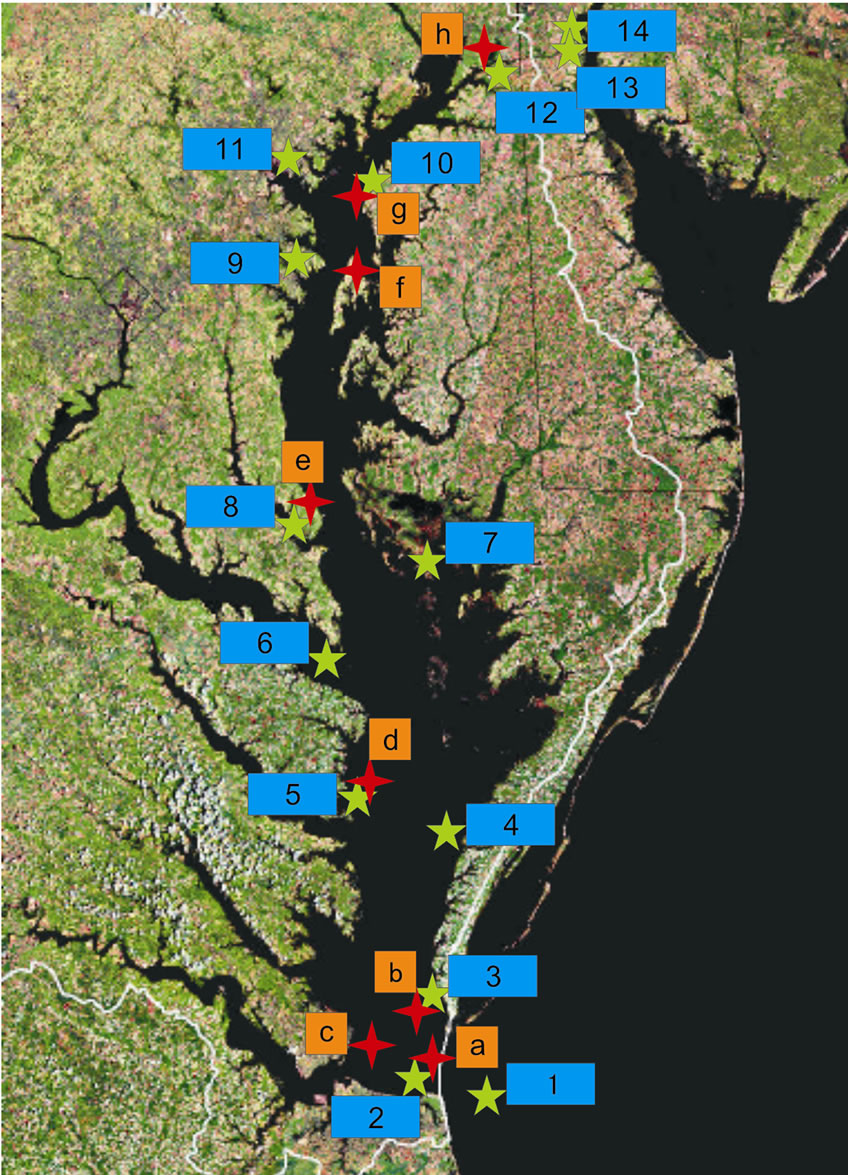
Chesapeake Bay is the largest bay in US. The Chesapeake Bay and its tributaries are the best studied estuaries in the world [2]. The Chesapeake Bay “main stem”, defined by tidal zones, is approximately 195 mi (315 km) long and 3.5 to 35 mi (5.6 to 56 km) wide, and has a surface area of nearly 4,400 mi2 (11,601 km2). The main stem is entirely within Maryland and Virginia. Nearly 50 rivers, with thousands of tributary streams and creeks, drain the approximately 64,000 mi2 (166,000 km2) forming the Chesapeake Bay Basin. The basin contains more than 150,000 stream miles (241,500 km) in the District of Columbia and parts of six states: New York, Pennsylvania, Maryland, Virginia, West Virginia, and Delaware [3]. Figure 1 shows the location of Chesapeake Bay in accordance with “NOAA Tides and Currents”. In addition, the fourteen tidal elevation stations and seven tidal current stations are indicated (see Table 1 for details).
The Chesapeake estuary is a drowned river and it is partially mixed. The depths are relatively shallow, so that mixing of at least moderate magnitude extends to the depths. In the total estuary approximately 50% of the system is less than 20 ft (6 m) deep, 35% has depths greater than 30 ft (9 m), 18% greater than 40 ft (12 m), and only 8% greater than 60 ft (18.3 m) [2].
Tides and freshwater inputs from the various tributaries of the Chesapeake Bay control the hydraulics of the bay [1]. National Research Council (2004) mentioned that three main factors influencing Chesapeake Bay’s circulation: freshwater inflow, the geometry of the basin, and tidal strength. Due to its small depth-length ratio, Chesapeake Bay accommodates slightly more than one semidiurnal tidal wave at all times, which results in a special tidal characteristics within Chesapeake Bay. Although the Bay has more than 50 tributary rivers, only 3 -the Susquehanna, Potomac, and James-account for more than 80% of the total freshwater input, with Susquehanna accounting for nearly half of the total (49%). All Eastern Shore Rivers combined contribute less than 4% of the total. In the average year, the total amount of freshwater discharged into the Bay (71 km3 or 17 mi3) is roughly equivalent to the tidal mean volume of the Chesapeake Bay estuarine system (76 km3 or 18 mi3) – the combined volume of the Bay proper and its tributary estuaries. The flows of the Bay’s major rivers are typical of mid-latitude rivers: high discharges in spring, pro-
 : Tidal Station;
 : Current Station
duced by snow melt and spring rains; low flows in late summer and early fall, followed by moderate flows through-out the remainder of the year [4]. Fresh water in Chesapeake Bay has a mean residence time of 7 months [5].
Wind is also reported as an important energy input in Chesapeake Bay. Zhong and Li [6] proposed that tidal and wind forcing appears to have nearly equal importance in Chesapeake Bay. Chesapeake Bay is classified as a partially–stratified estuary [7].
The main channel is of 5 to 7 km (4.4 mi) width and 23 m (75 ft) depth at the mouth of the Chesapeake Bay [8]. Bathymetries in the Upper Chesapeake Bay are characterized by a steep east-west slope and a relatively gentle north-south slope. A narrow and deep navigation channel exceeding 9 m (30 ft) follows the contour of the eastern coast, bounded to the west by broad banks [9]. The Chesapeake & Delaware Canal runs 14 miles long, 450 feet wide and 35 feet deep across Maryland and Delaware, connecting the Delaware River with the Chesapeake Bay and the Port of Baltimore. The C&D Canal is owned and operated by the U.S. Army Corps of Engineers, Philadelphia District.
The mean tidal range decreases from 0.9 m (3 ft) at the Bay’s entrance (Chesapeake BBT) to a minimum of 0.3 m (1.0 ft) at Annapolis, then rises to 0.7 m (2.3 ft) at the head. Average tidal current amplitudes decrease from a maximum of 1.03 m/s (3.38 ft/s) at the mouth to a minimum of 0.13 m/s (0.43 ft/s) in the middle Bay, but increase to 0.59 m/s (1.94 ft/s) at Baltimore in the upper Bay [6].
The tidal and current range on the eastern shore is generally higher than that on the corresponding western shore, which is mostly explained as the result of earth rotation. However, Wang and Chao [9] proposed that the deep channel is the root cause of the current intensification, while the earth’s rotation does not play a crucial role.
The salinity increases from zero at the head of the estuary to nearly that of seawater at the mouth. In the upper Chesapeake Bay and in each tributary estuary there are considerable seasonal variations in salinity which diminish in magnitude in magnitude toward the mouths of these estuaries [2].
Figures 2 and 3 are one-month and three-day tides at Chesapeake Light (8638979), respectively. These two plots reveal that the tide is predominantly driven by semidiurnal constituent. The magnitudes of Spring and Neap tide ranges are approximately 1.7 m (5.6 ft) and 0.7 m (2.3 ft), respectively, as shown in Figure 2. Also, the mean tide range is around 1.2 m (3.9 ft).
The understanding of tidal characteristics is the premise to learn tidal and sediment transport processes in estuarine areas. Investigation on hydrodynamic environment of the bay is in favor of comprehending pollutant transport and mechanism of deep water zone maintaining [10]. Therefore, it is desirable to perform a general basic tidal study in Chesapeake Bay in order to further understand the tidal characteristic in Chesapeake Bay. In addition, the basic tidal analysis approaches can be optionally used in other estuaries.
2. Tidal Characteristics within Chesapeake Bay
2.1. Stations and General Issues
Table 1 lists the tidal stations (See Figure 1 for the locations) and Table 2 describes their tidal characteristics. M2 constituent is obviously the dominant constituent with the next largest constituent being an order of magnitude less in amplitude. Annapolis has the lowest M2 tidal elevation, while the higher tide occurs at both the entrance of the Bay and the C&D Canal. Also, the tide on eastern shore has the higher amplitude than that on western shore. In addition, Salas-Monreal and ValleLevinson [11] provided the mean depths of transects through a few stations.
Table 1. Tidal characteristics at water elevation stations.
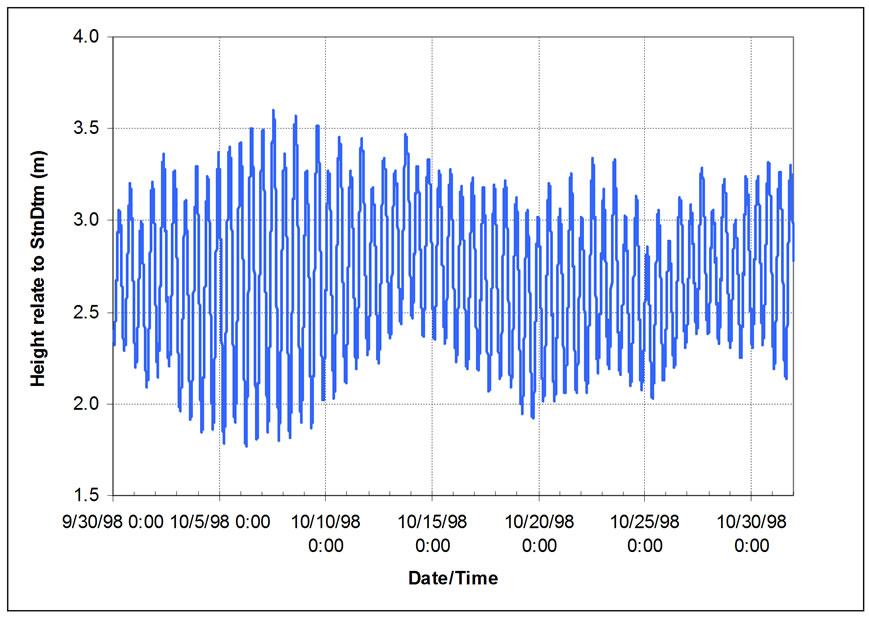
Figure 2. One-month ocean tide at chesapeake light.
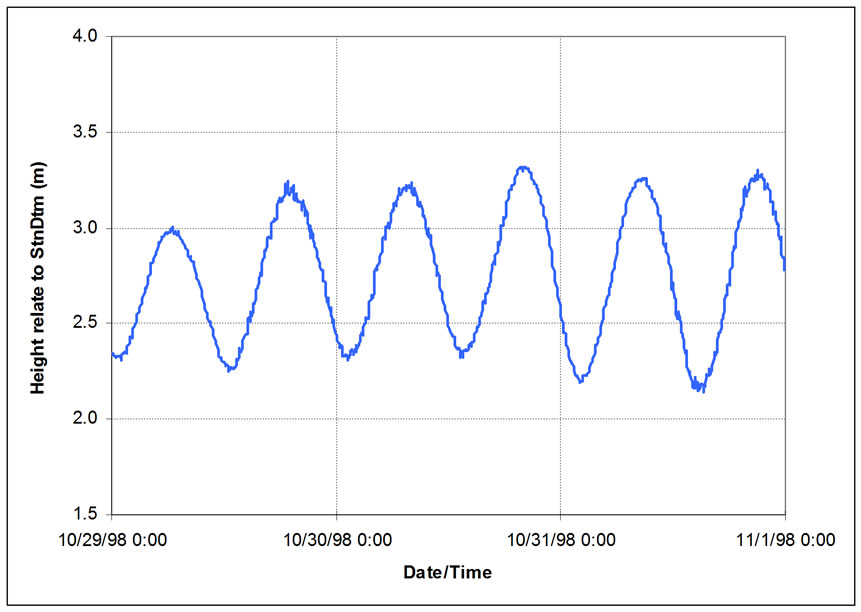
Figure 3. Three-day ocean tide at chesapeake light.
Table 3 gives the Chesapeake Bay current stations from Chesapeake Bay Port (See Figure 1 for the locations).
The relative importance of the diurnal and semidiurnal tidal constituents and tide classification can be expressed in terms of form factor as shown in Table 2 [12], which is defined as,
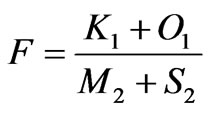
where ,
,  ,
,  , and
, and  are the amplitudes of the corresponding tidal constituents. In terms of the form factor, F, the tides may be roughly classified as shown in Table 4.
The calculated form factors reveal that semidiurnal tide is almost throughout Chesapeake Bay except for the standing wave in three upper Bay stations (Annapolis, Tolchester Beach, and Baltimore) with higher latitudes.
The natural fundamental period  can be calculated as below,
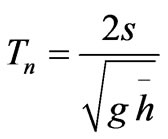
where s is the length of Chesapeake Bay, 320 km; g is the gravity acceleration, 9.81m/s2,  is the mean depth of Chesapeake Bay, 5 m [13]. The calculated natural fundamental period Tn, 25.38 hours, is closer to the diurnal tidal period, thus, amplification of diurnal tide could be observed. In accordance with Schwartz [14], the diurnal tide could be amplified at near the semidiurnal nodal area where semidiurnal tide range is small (see Figure 4). In accordance with Figure 4, Windmill Point is located near the semidiurnal nodal area, around –230 km (–149 mi) from the upstream end. The form factor at Windmill Point, representing mixed mainly semidiurnal tide, is slightly higher than those at adjacent stations with semidiurnal tide as shown in Table 2. Consequently, approximate nodal area locations of Windmill Point might be a reason for the observed a little bit amplification of diurnal signal at Windmill Point. Referring to Huang et al. [9], as Rappahammock Light and Bishop Head have higher M4/M2 than other stations within Chesapeake Bay, shallower tidal wave would be assumed at these two locations. Therefore, more attentions might have to be paid to there due to probable significant sediment transport processes around these two stations.
Figure 4 is the calculated M2 tidal amplitudes in Chesapeake Bay with friction by superposition of the incident and reflective waves. The friction is represented by an exponential function [15]-exp(–μx) ( μ is the amplitude damping coefficient; x is the travel distance starting from the mouth of the Bay, m). Then, the super
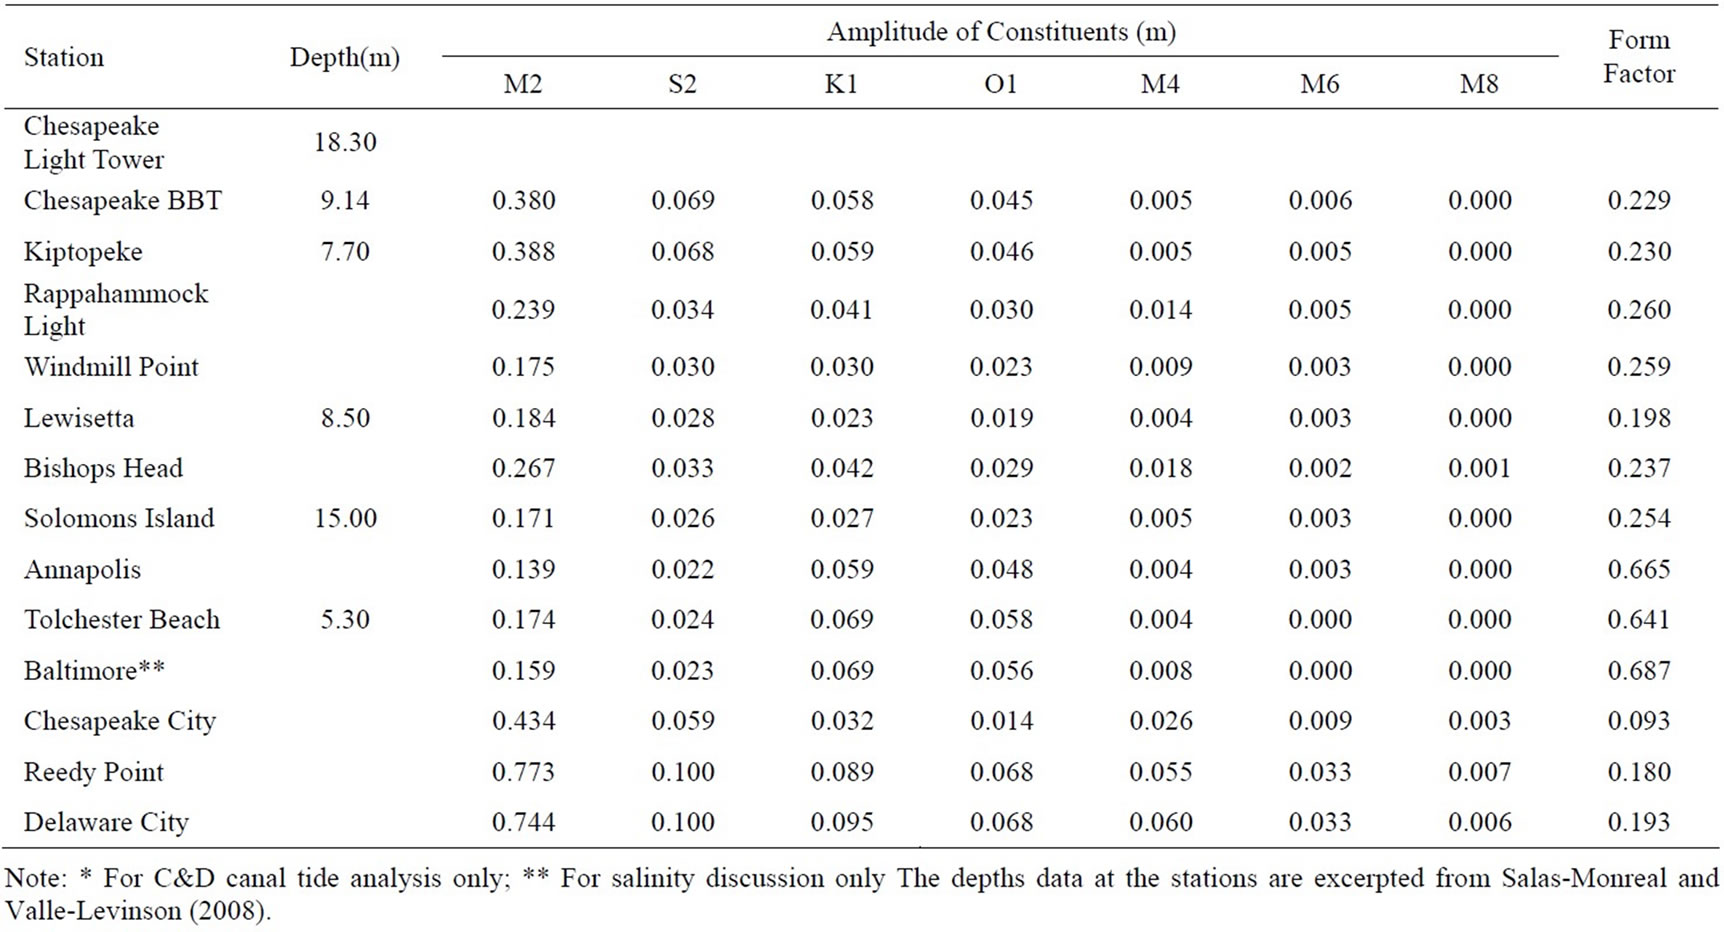
Table 2. Tidal characteristics at water elevation stations.
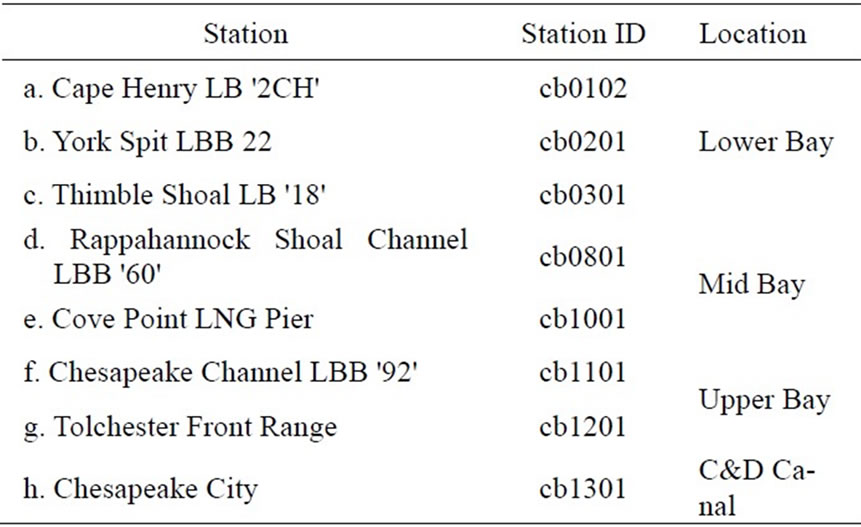
Table 3. Chesapeake bay current stations.
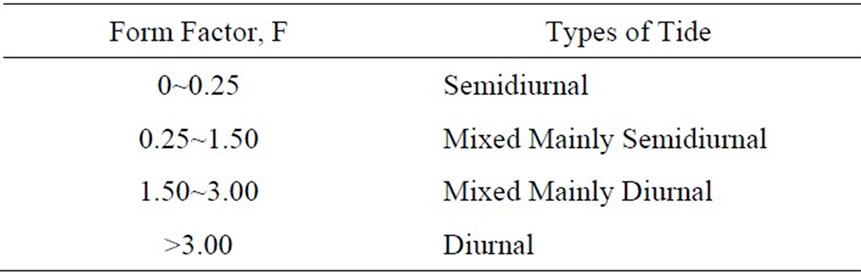
Table 4. Tide classification.
position of the incident and reflective waves can be expressed as,
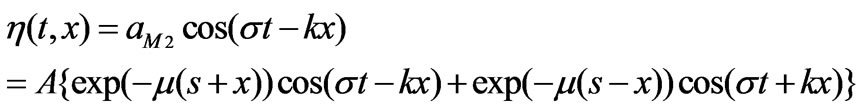
where 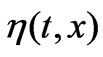 is water surface profile for the integrated wave, m; aM2 is the M2 constituent amplitude, m, A is the M2 constituent amplitude of the progressive wave at the entrance, m; K is wave number, m-1;
  is wave angular frequency, s-1. Therefore, the M2 constituent amplitude within Chesapeake Bay is,

Both the M2 constituent amplitudes at CBBT (0.380 m at –320 km) and Tolchester Beach (0.174 m at –40 km) are used to figure out the damping coefficient,  1.65 × 10⁻⁶, which adjusts the amplitudes of both incident and reflective waves along the travel distance. Similar to Boon [13], Figure 4 represent that two minimum tidal amplitudes occur at around –80 km (–50 mi) and –230 km (–143 mi) from the upstream end, which approximately corresponding to somewhere close to Annapolis and Windmill Point, respectively. The amplitudes at both Windmill Point and Annapolis are relative low comparing with other stations, which matches the result as shown in Figure 4. Because of friction and energy dissipation, the amplitude at the upper Bay is generally lower even with the effect of reflection in accordance with Table 2 and Figure 4, although the M2 constituent amplitude at upper Bay might be overestimated in Figure 4 due to the assumed constant damping coefficient, μ. In brief, there are two areas with lower M2 constituent amplitude, and a generally decrease of the amplitude of the dominant M2 constituents, as tide moves upstream. Standing wave characteristics and narrowness at Chesapeake City result in higher M2 tide there.
Figure 5 depicts the 3-day salinity at three stations, and the salinity decreases gradually from the mouth (~22 ppt at CBBT) up to the upper Chesapeake Bay (~6 ppt at Baltimore). The salinity at CBBT is more sensitive to the tidal elevation, while the salinities at Lewisetta and Baltimore are almost constant in this short time period. The peak salinity at CBBT is in response to the water surface elevation to some extent in accordance with Figure 5.
For this partially mixing Bay, seasonal-varied freshwater flow might be most influencing factor affecting salinity distribution in Chesapeake Bay.
The deep channel, along with earth rotation and freshwater effects (due to predominant freshwater from Western Shore), might make a lower salinity on western shore. Stronger stratification could be observed at upper end with lower tidal velocity. Vertical stratification is not discussed in detail for data deficiency.
In recent decades, Chesapeake Bay has had widespread water quality problems due to fine sediment. Sediment distribution is usually dominated by hydraulic condition and material origin [10]. Tidal current, freshwater, wind, etc could be the factors affecting the process of sediment transport and the distribution of sediment. Without considering freshwater input, Table 5 shows the calculated near bed velocity amplitude of tidal stations based on dominant M2 constituent. The near bed velocity amplitude can be expressed as
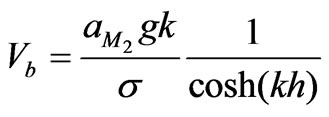
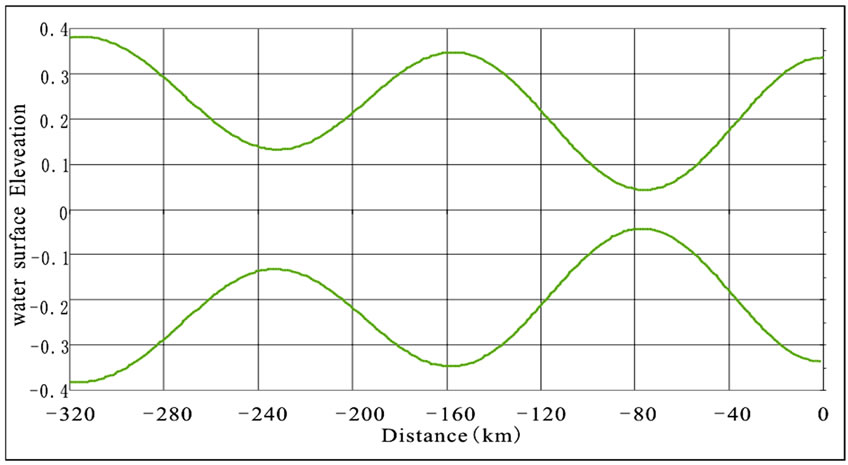
Figure 4. Calculated M2 constituent tidal amplitudes in chesapeake bay with friction.
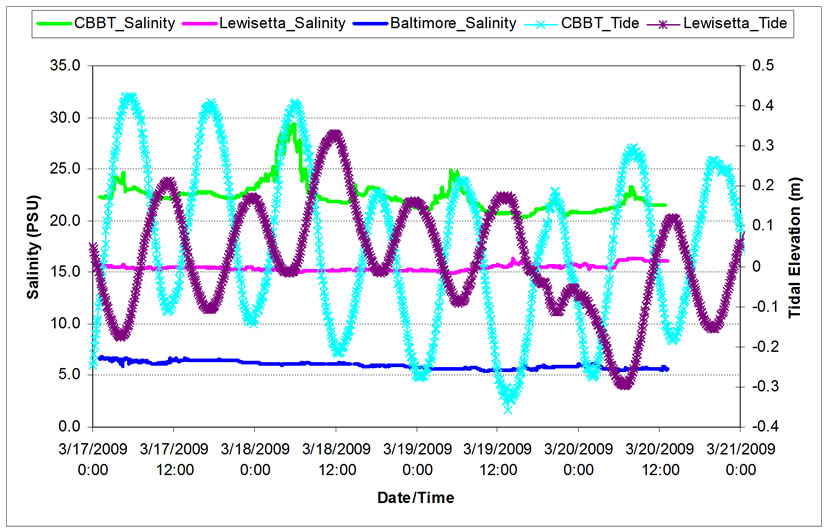
Figure 5. Salinity in chesapeake bay
where V is near bed velocity amplitude at the location of the station, m/s; h is water depth, m. The higher the velocity amplitude, the more important the sediment process at the station. In accordance with the criteria, the sediment process at both lower Bay and C&D Canal is significant. Table 5 also depicts that velocity amplitude at the bed on the eastern shore is generally higher than that on the corresponding western shore due to the higher amplitude of M2 constituent. Therefore, the gradient of bottom shear stress from eastern shore to western shore could be assumed for a general sediment transport estimate.
Freshwater brings great amount of fine sediment, while the force resulting from freshwater flow is in both local scale and lower magnitude. Therefore, tidal force could be more important in the general sediment transport and re-distribution at Chesapeake Bay. Tidal current dominate the process of sediment transport, controlling the distribution of sediment and development of seabed [10]. The long-term annual average of suspended material contributed by the Chesapeake Bay basins is approximately 4.3 million tons per year. About 90 percent of this material came from the three largest rivers (Susquehanna, Potomac, and James). It was assumed that the great majority of the sediment supplied from the freshwater flow is fine-grained silts and clays [3]. More fine sediment is supposed to be accumulated at western shore, as freshwater inflows are located mostly close to western shore.
Consequently, differentiating sediment transport & distribution in western shore from that in eastern shore is necessary in both water quality modeling and the following restoration practice.
Sediment distribution along the length of Chesapeake Bay is even more elusive due to complex interactions among tide, freshwater input, wind, bathymetry, etc. Data indicated that the greatest sediment volume is associated with the bay mouth, which further suggests that the continental shelf has been more significant source of sediment to the Bay with high tidal velocity (see Table 5) than the Susquehanna River and other watershed tributaries [3]. Although sand is the predominant sediment type in the lower Bay, part is composed of clay and silt-sized material and there also is good evident for its significant net up estuary transport [3]. Therefore, a quantification of northward Bay fine sediment transport determines the water quality in both lower Bay and other tidal-affected area. In another word, controlling the fine sediment movement in lower Bay could be an important step to improve water quality in the Bay.
2.2. Tide at Entrance (Chesapeake BBT)
Corresponding to the Spring and Neap tidal variations Tide range varies between 0.5 m (1.6 ft) and 1.0 m (3.3 ft) at the entrance of Chesapeake Bay (See Figure 6).
2.3. Tidal Currents
Figure 7 shows the general currents within Chesapeake Bay at current stations as shown in Figure 1. Not solely related to the tidal elevation, the magnitude of current at each station is affected but multi-factors such as cross area, freshwater flow, etc. Phase difference is noticed in accordance with Figure 7. Although there is no observed data at current station cb1001, which is close to narrowing Solomons Island, higher velocity could be the fact at this station for the smaller cross section.
Figure 8 shows both the tidal elevation at Chesapeake BBT and current at cb0102. Since cb0102 is rather close to Chesapeake BBT, so the current at cb0102 could be approximately used for Chesapeake BBT. Generally, not much phase difference is observed between the tide and current, which matches the result of in-phase generated by Whitford [8]. However, wind might be the primary reason for the discrepancy during 03/18/2009 12:00- 03/19/2009 06:00.
Excluding the effect of wind, Figure 9 depicts tidal elevation at Chesapeake BBT, currents at both cb0102 and cb0301 during the period of 09/21/2008 16:00- 09/22/2008 13:00 (wind speed is nearly zero). An approximate in-phase result is observed in Figure 9, which matches the accepted mainly progressive wave at the entrance.
The characteristics of mainly standing waves are obviously observed at both Annapolis and Tolchester Beach as shown in Figures 10 and 11, respectively. Lower tidal velocity occurs at Tolchester Beach with the standing wave.
In accordance with Figures 10 and 11, more sawtoothed pattern tides in upper Bay indicate more upland tides.
2.4. Phase Aspect of the Tide Elevation in Chesapeake Bay
NOAA Predicted tidal elevations at 9 stations within Chesapeake Bay are shown in Figure 12. The changes of the tidal amplitudes are observed along the main channel seem to be a consequence of the interaction between the tide and the Bay morphology as well as the wave reflection, and are described by the law of energy conservation [16]. It is observed that the whole bay experienced a low tide on January, 9, 2009. Comparing the tidal phase lag for M2 constituent from the entrance against the plots in Figure 12, it is not dif ficult to find that they are in good agreement.
Table 6 lists the tidal phase lag from the entrance (Chesapeake BBT) in terms of the dominated M2 constituent. Table 7 lists the tidal phase lag from the en-
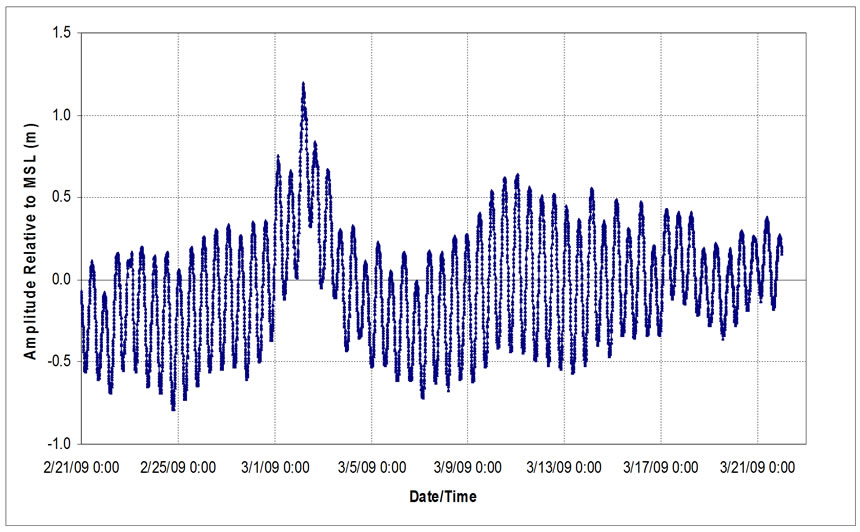
Figure 6. Observed spring and neap tide cycle at entrance (chesapeake BBT).
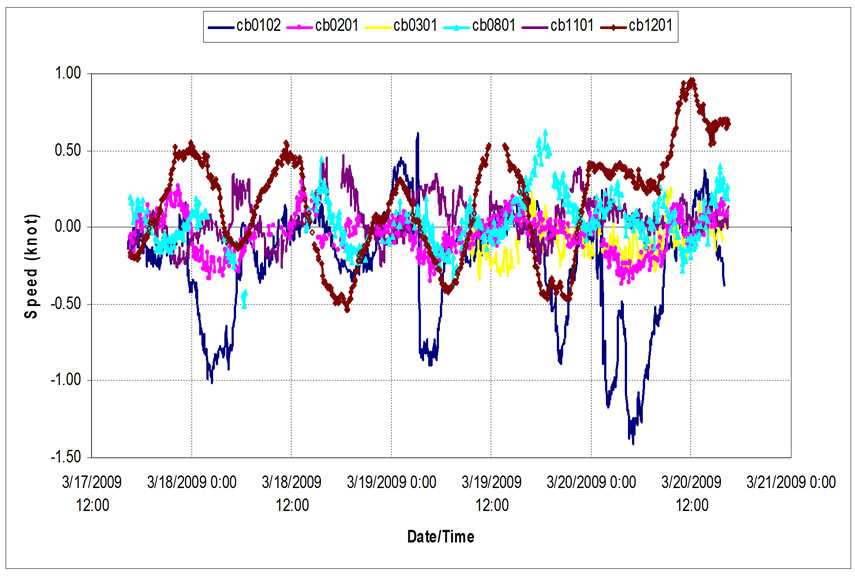
Figure 7. Observed tidal currents within chesapeake bay.
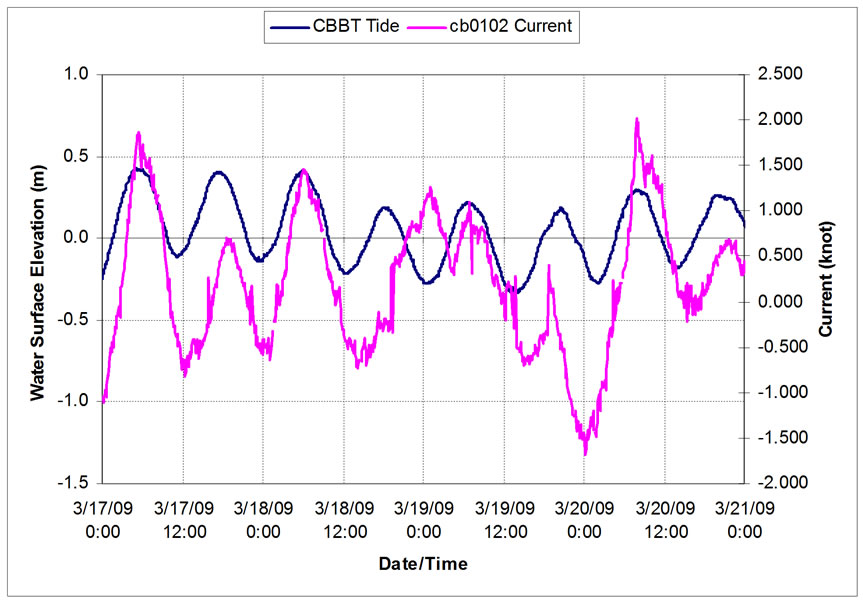
Figure 8. Tide and current at the entrance with wind effect (chesapeake BBT).
trance (Chesapeake BBT) in terms of the K1 constituent. The region from Chesapeake BBT to Lewisetta is more like a progressive wave region. However, there is a narrowing of the channel around Solomons Island, and there is only around half hour lag for M2 and two and half hours for K1. Therefore, a standing wave is indicated and the tide is likely to be amplified around Solomon Island.
2.5. Tide Prism
Cubature method is employed to calculate the tidal prism (03/18/2009) of Chesapeake Bay in accordance with the tide on 03/18/2009 in Figure 12. The identification of subareas is shown in Figure 13, and the tidal prism is calculated as shown in Table 8.
The tidal prism is about for M2 constituent is around 1.25 × 10⁹ m3 (4.41 × 1010 ft3) as shown in Table 8. Freshwater flow is around 4,250 m3/s (150,000 ft3/s) in March in accordance with USGS.
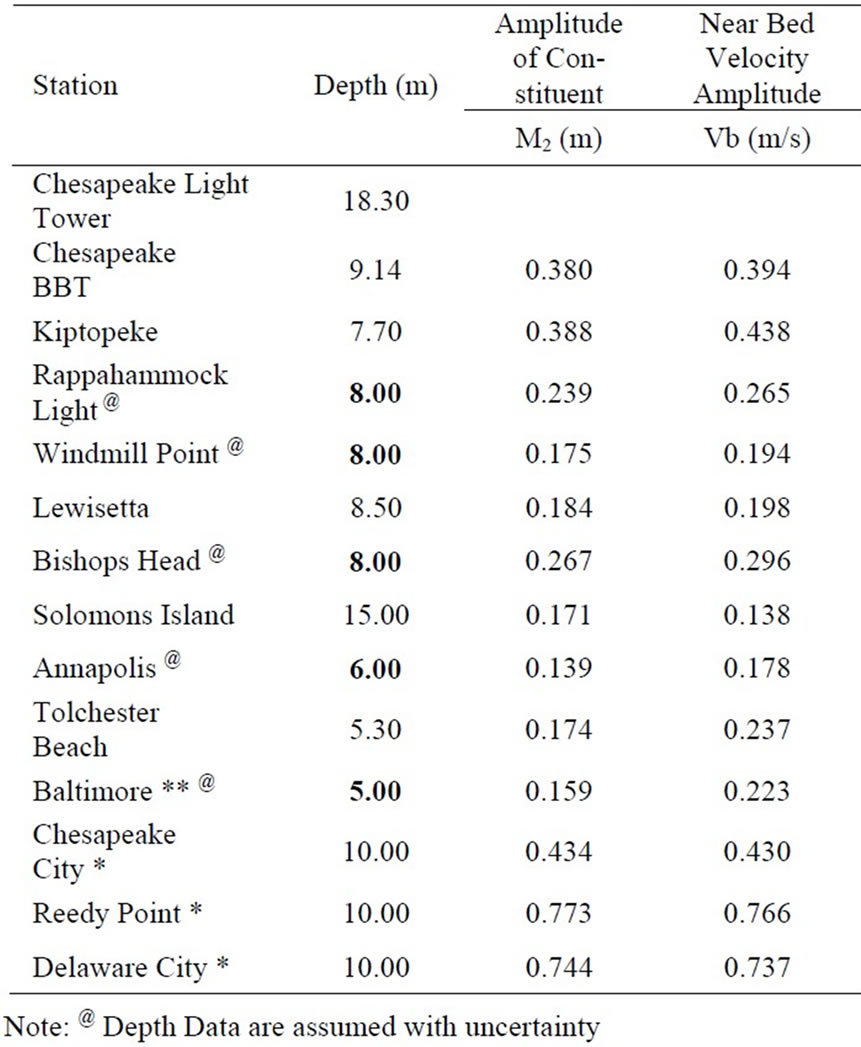
Table 5. Near bed velocity amplitude of tidal stations based on M2.
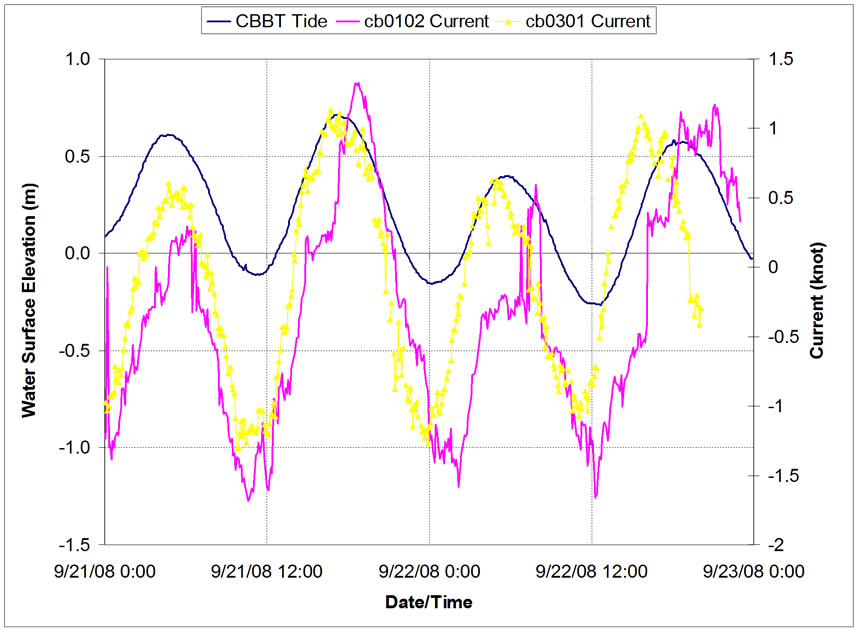
Figure 9. Tide and current at the entrance (chesapeake BBT).
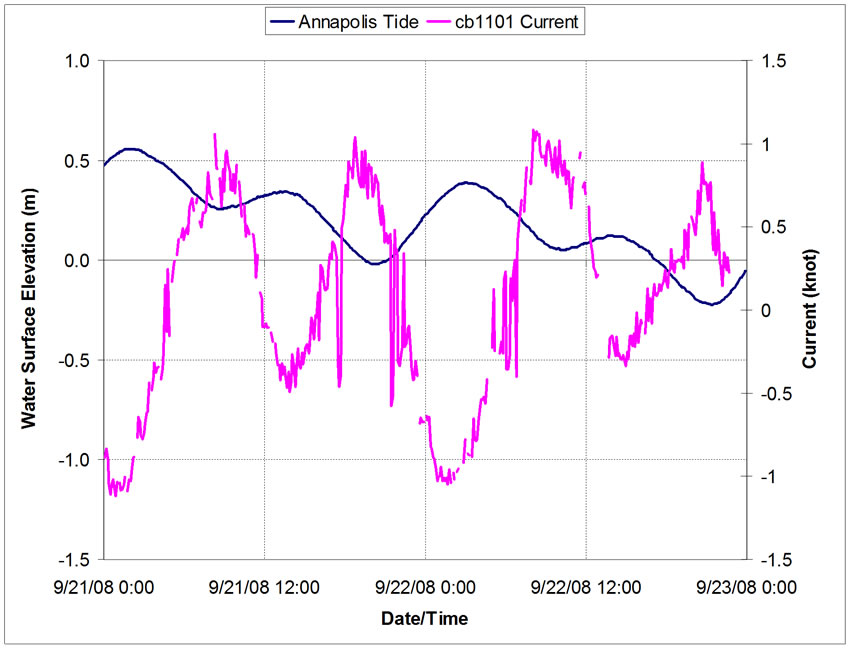
Figure 10. Tide and current at annapolis.
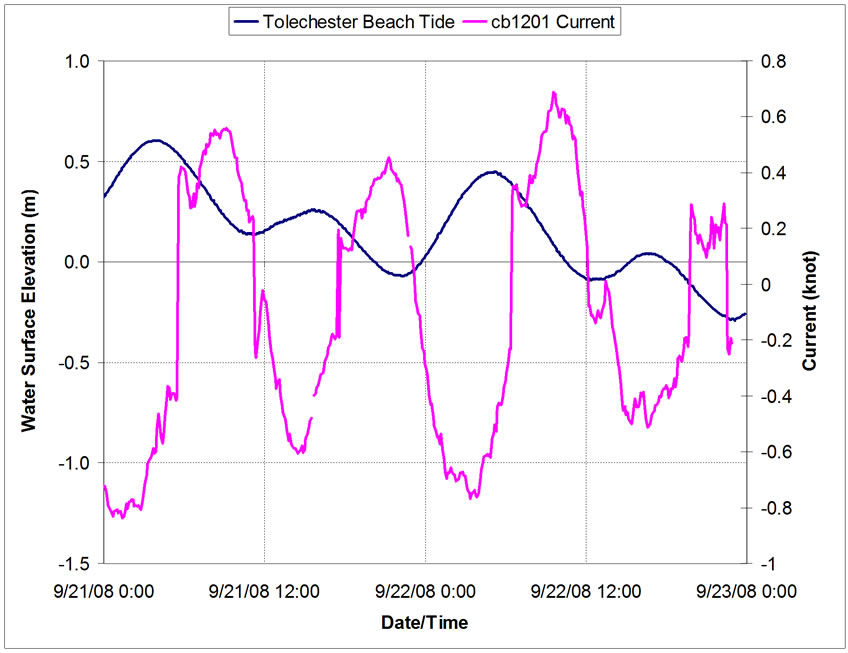
Figure 11. Tide and current at tolchester beach.
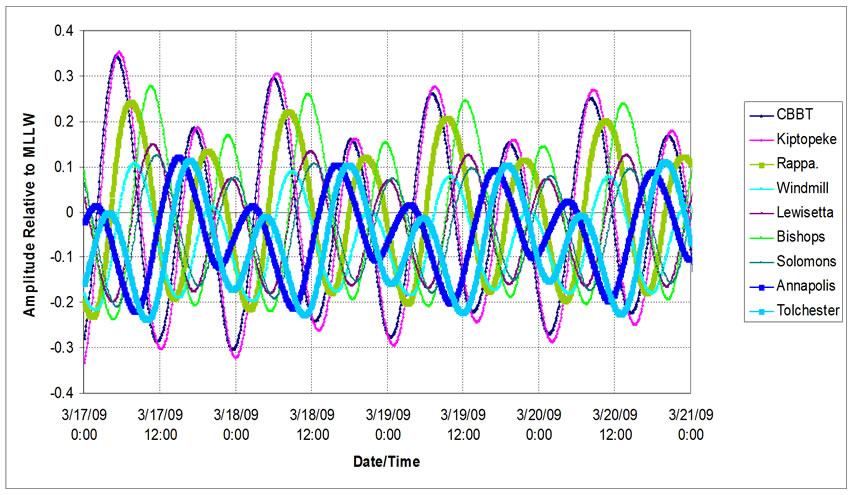
Figure 12. Predicted tides elevations within chesapeake bay.
Therefore, freshwater volume in 12.42 hours is 1.90 × 10⁸ m3 (6.71 × 109 ft3) approximately. Consequently, the Canter Cremer Estuary Number can be figured out as N = 0.15, which shows that the Chesapeake Bay is partially mixed as N > 0.10 in this specific time period. Consequently, the tidal prism formula [17] in terms of M2 constituent gives a lower limit of flushing time of 3.2 days.
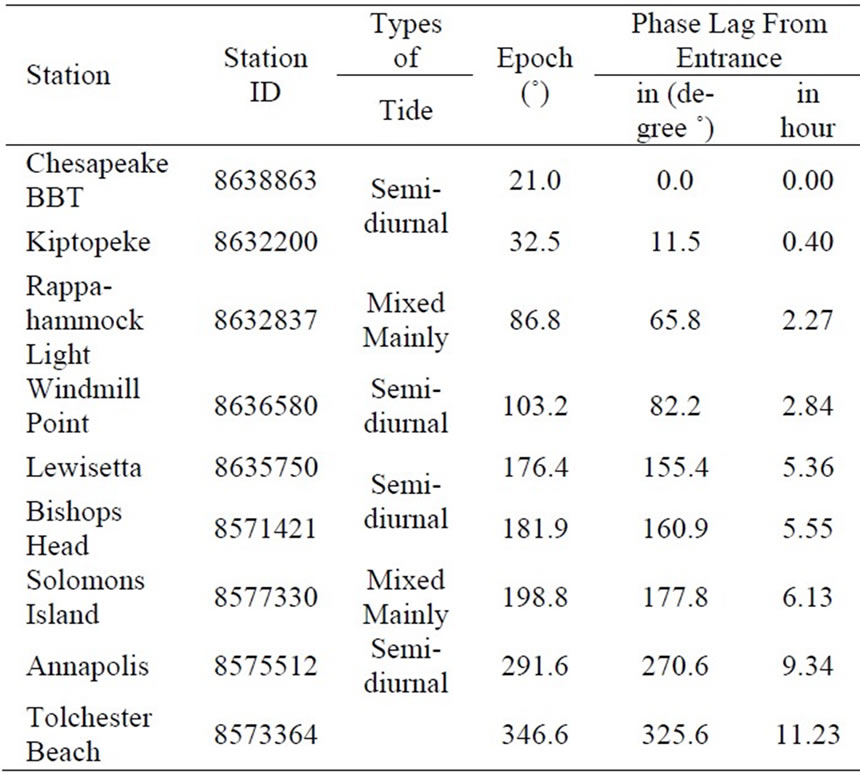
Table 6. Tidal phase lag for M2 from the entrance (chesapeake BBT).
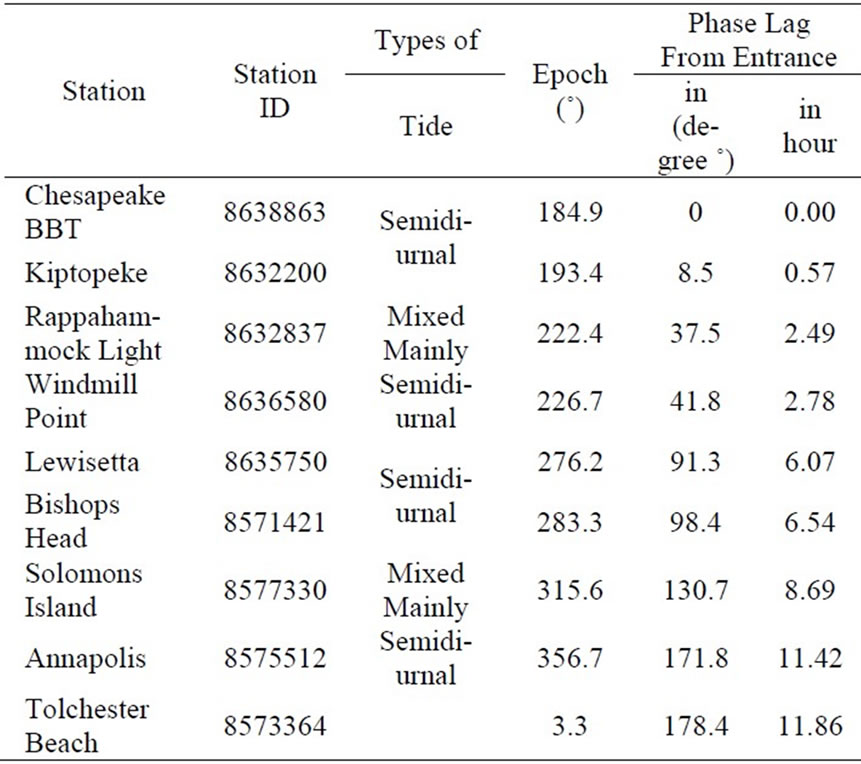
Table 7. Tidal phase lag for K1 from the entrance (chesapeake BBT).
2.6. C&D Canal Analysis
The Canal could be regarded as open to Chesapeake Bay (Left end open). Figure 14 shows the observed tidal elevations at Chesapeake City and Reedy Point located on C&D Canal. M2 constituent is the dominant constituent at both these two stations in accordance with Table 2. Consequently, information on the progressive wave in C&D Canal is summarized in Table 9. Ideally, the tidal elevation at Chesapeake City would be nearly zero for its location on node, and the standing waves at both stations are in phase. However, some distortions on both ampli-
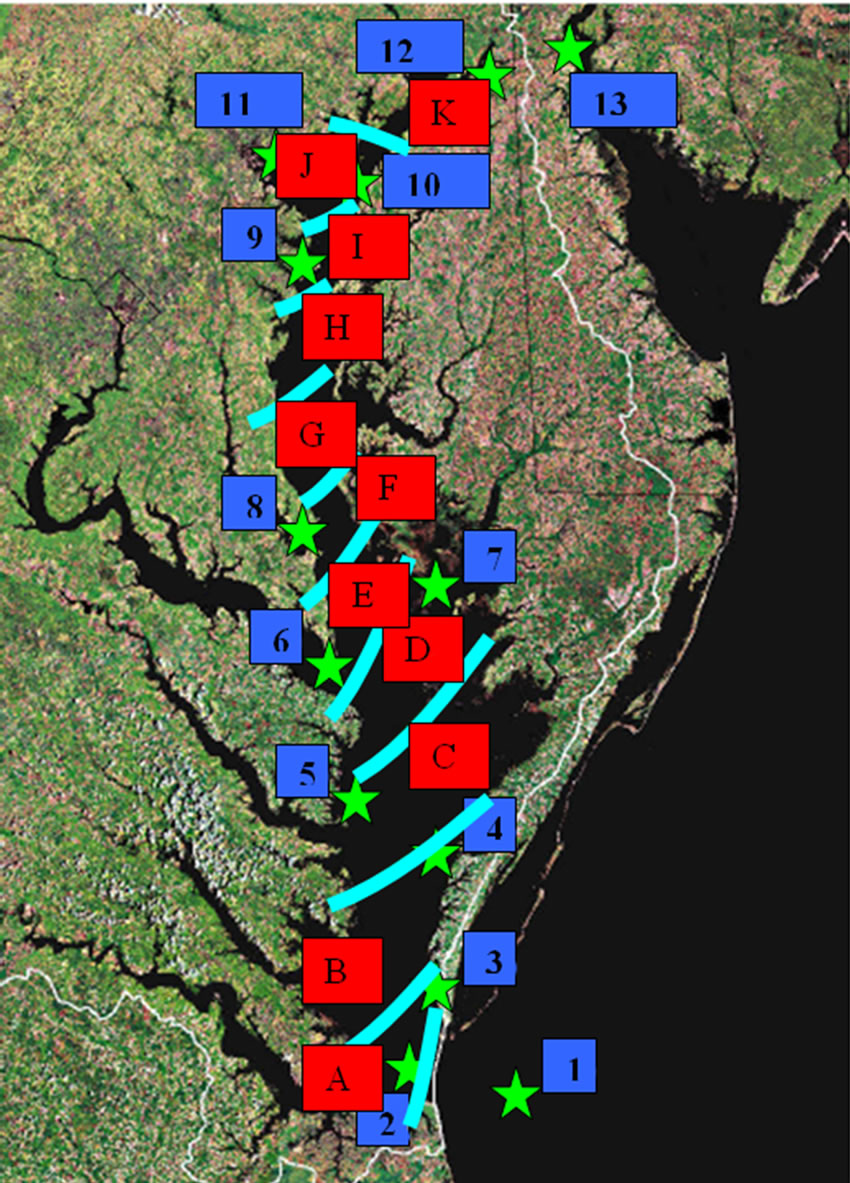
Figure 13. Subarea map.
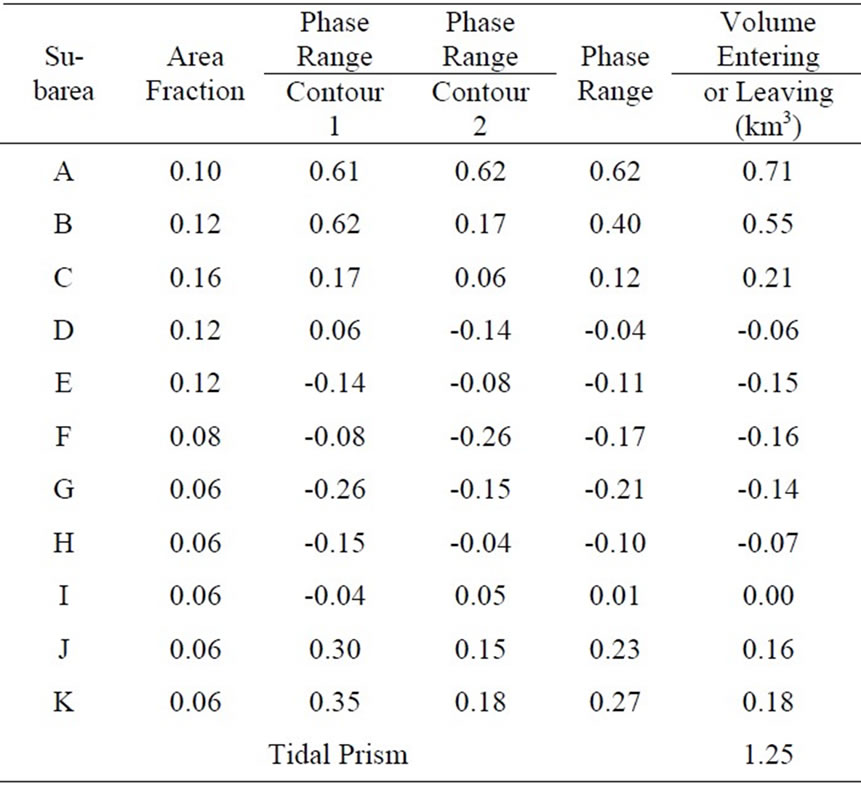
Table 8. Tidal prism calculation using cubature method
tude and phase occur due to the imperfect reflection resulting from Upper Chesapeake Bay’s morphology.
Figure 15 represents that an approximate 90º phase difference exists between tidal elevation and current at Chesapeake City due to the effect of standing wave.
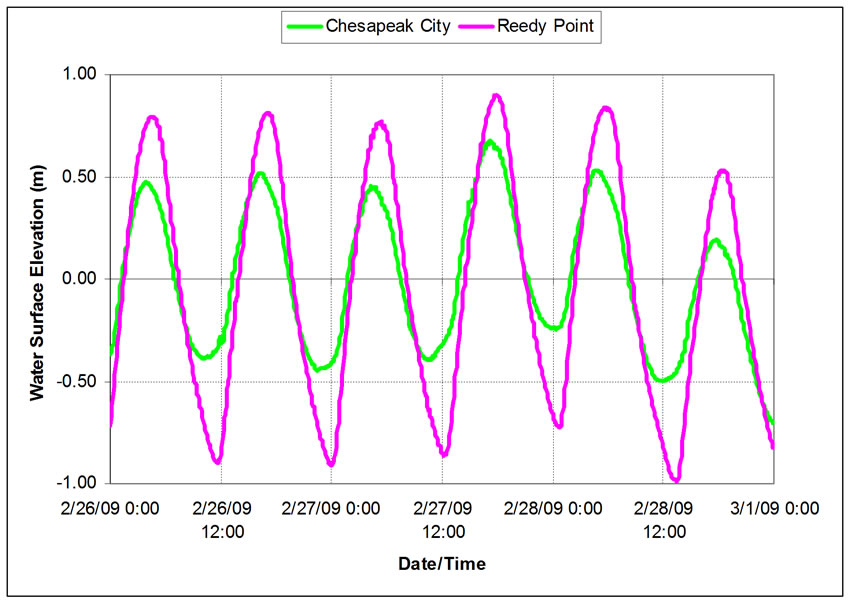
Figure 14. Observed tidal elevations in chesapeake bay & delaware bay canal.
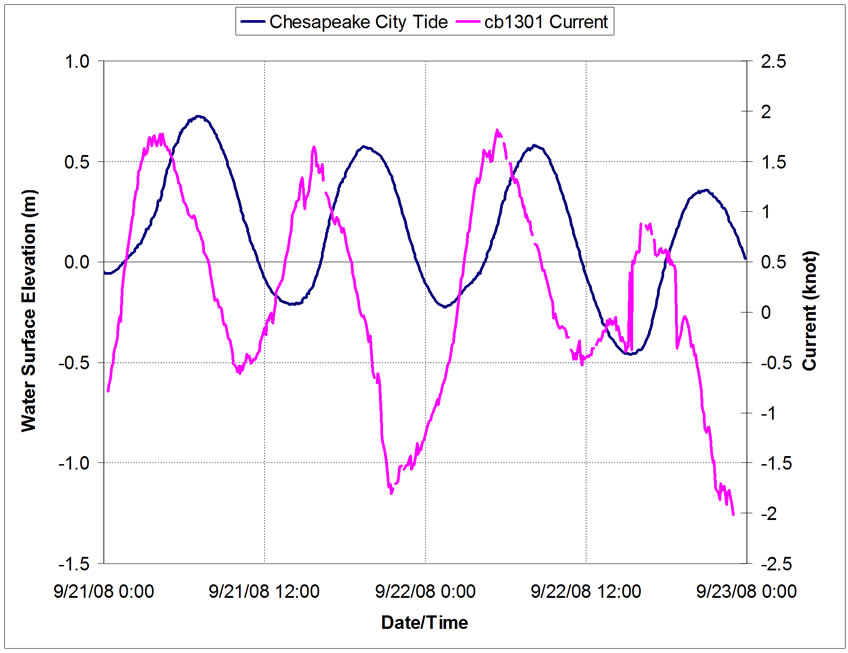
Figure 15. Tide and current at chesapeake city.
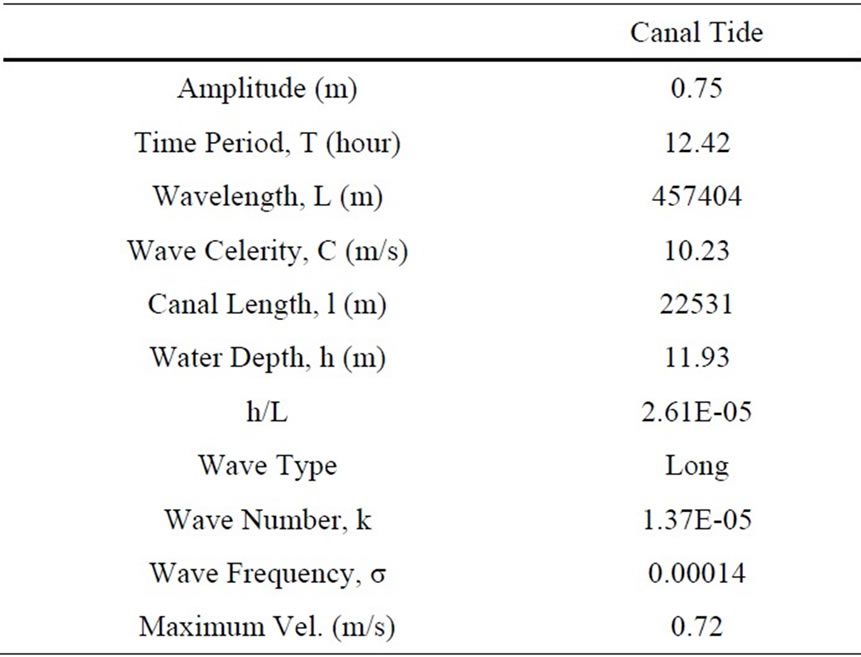
Table 9. Progressive wave in C&D canal.
3. Conclusions
This paper performs basic tidal analyses of Chesapeake Bay so as to represent a basic tidal analysis approach and provide tidal information for the understanding of tide, sediment transport, and other processes in Chesapeake Bay.
The general distributions of tidal and current ranges, salinity probably result from deep channel, earth rotation, and freshwater discharge. A brief description of general sediment distribution in Chesapeake Bay was represented in this paper in accordance with tidal characteristics and Langland and Cronin [3]. Wind has a significant impact on the tides in Chesapeake Bay.
Taking friction into considered, dominant semidiurnal M2 constituent tidal elevations within Chesapeake Bay were computed to compare against the actual M2 amplitudes, and they are found in good agreement. Higher M2 amplitude was observed at Chesapeake City due to standing wave and the narrowing of C&D Canal.
Removing the effect of wind, mainly progressive wave at the entrance and mainly standing waves are at upper Chesapeake Bay were observed.
The changes of the tidal amplitudes are the consequence of the interaction between the tide and the bay morphology as well as the wave reflection.
REFERENCES
- G. Walters and F. Klein, “Modeling Tides in the Chesapeake Bay,” Project Report.
- R. Patrick, “Rivers of the United States: Estuaries,” John Wiley and Sons, 1994.
- M. Langland and T. Cronin, “A Summary Report of Sediment Processes in Chesapeake Bay and Watershed,” Water-Resources Investigations Report 03-4123, U.S. Department of the Interior & U.S. Geological Survey, 2003.
- P. D. Curtin, G. S. Brush and G. W. Fisher, “Discovering the Chesapeake: The History of An Ecosystem,” JHU Press, Baltimore, 2001.
- National Research Council (USA), Committee on Nonnative Oysters in the Chesapeake Bay, United States, 2004.
- L. Zhong and M. Li, “Tidal Energy Fluxes and Dissipation in the Chesapeake Bay,” Continental Shelf Research, Vol. 26, No. 6, 2006, pp. 752-770.
- H. V. Wang and S. Chao, “Intensification of Subtidal Surface Currents over a Deep Channel in the Upper Chesapeake Bay,” Estuarine, Coastal and Shelf Science, Vol. 42, No. 6, 1996, pp. 771-785.
- D. J. Whirford, “Observations of Current Flow through the Mouth of the Chesapeake Bay,” Estuarine, Coastal and Shelf Science, Vol. 49, No. 2, 1999, pp. 209-220.
- H. V. Wang and B. H. Johnson, “Validation and Application of the Second Generation Three Dimensional Hydrodynamic Model of Chesapeake Bay,” Water Quality and Ecosystems Modeling, Vol. 1, No. 1-4, 2000, pp. 51- 90.
- S. Huang, H. Lou, Y. Xie and J. Hu, “Hydrodynamic Environment and is Effects in the Xiangshan Bay,” International Conference on Estuaries and Coasts, Hangzhou, 9-11 November 2003.
- D. Salas-Monreal and A. Valle-Levinson, “Sea-Level Slopes and Volume Fluxes Produced by Atmospheric Forcing in Estuaries: Chesapeake Bay Case Study,” Journal of Coastal Research, Vol. 24, No. sp2, 2008, pp. 208- 217.
- D. T. Pugh, “Changing Sea Levels,” Cambridge University Press, Cambridge, 2004.
- M. L. Schwartz, “Encyclopedia of Coastal Science,” Springer, Berlin, 2005.
- A. T. Ippen, “Estuary and Coastline Hydrodynamics,” McGraw-Hill Book Company, Inc., New York, 1966.
- J. D. C. Boon, “Secrets of the Tide: Tide and Tidal Current Analysis and Applications, Storm Surges and Sea Level Trends.” Horwood Publishing, Chichester, 2004.
- S. Canhanga and J. M. Dias, “Tidal Characteristics of Maputo Bay, Mozambique,” Journal of Marine Systems, Vol. 58, No. 3-4, 2005, pp. 83-97.
- Z. Ji, “Estuary Hydrodynamics and Water Quality: Modeling Rivers, Lakes, and Estuaries,” John Wiley & Sons, Inc., Hoboken, 2008.
- P. Wang, L. C. Linker, R. Batiuk and C. Cerco, “Surface Analysis of Chesapeake Bay Water Quality Response to Different Nutrient and Sediment Loads,” Journal of Environmental Engineering, Vol. 132, No. 3, 2006, pp. 377- 383.