Journal of Water Resource and Protection
Vol. 1 No. 5 (2009) , Article ID: 862 , 9 pages DOI:10.4236/jwarp.2009.15038
Watershed Characterization of Wadi Aurnah, Western Arabian Peninsula
Space Research Institute, King Abdel Aziz City for Science and Technology, King Abdel Aziz, Kingdom of Saudi Arabia
E-mail: geomm5.mashael@gmail.com
Received July 2, 2009; revised August 18, 2009; accepted August 27, 2009
Keywords: Watershed, Topographic Maps, ASTER, Arabian Peninsula
ABSTRACT
The Western part of Arabian Peninsula constitutes a shield-like mega-structure, in which mountain chains are oriented in the NW-SE direction. Along this mountainous region, surface runoff is almost diverted towards the Red Sea in the west. Thus, several catchment topographic units exist to capture rainfall water among them. Even tough, the precipitation rate in the Western part of Arabian Peninsula is low (i.e. <200mm), yet a number of drainage systems occur and reveal empirical stream networking. However, studies belong to the watersheds located in the Western part of Arabian Peninsula are still rare and sometimes they show erroneous morphological characterization, notably in the catchments delineation. This is attributed mainly to the complicated drainage pattern, which is structurally-controlled. Thus, related morphological and hydrological studied obtained on these drainage systems reveal discreditable results and measures. This study aims to characterize Wadi Aurnah Watershed (~3113 km2), which comprises a typical catchment in the Western part of Arabian Peninsula. In addition to topographic maps, remotely sensed data (ASTER and IKONOS satellite images) were utilized to delineate water divides with the most precision. Consequently, relevant morphological and hydrological characteristics of Aurnah watershed were obtained.
1. Introduction
The Arabian Peninsula, as a part of the Dead Sea Rift System, is a semi-island that surrounded by Red Sea, Arabian Sea and the Arabian Gulf from the west, south and east; respectively (Figure 1). Therefore, water from rainfall flows along the mountainous regions towards the sea. The intensity and continuity of runoff differ from one region to another depending on precipitation rate and behavior, as well as the geologic and geomorphic characteristics of terrain are influencing. However, the precipitation rate in the whole Peninsula is low enough to create continues run-off, and often flow of water from surrounding mountains does not even reach the sea. Moreover, indicators of climate change are obviously noted through the diversity in sediments sequence as well as from the frequent existence of paleo-drainges [1].
The Western part of Arabian Peninsula, where Wadi Aurnah is located, encompasses a steep sloping terrain (the so-called Hijaz Escarpment), notably along the mountain chains of the Arabian Shield. This Shield comprises a mega-structure that spread into the middle part of the Peninsula. Therefore, the area constitutes the most elevated crests in the region, thus peaks of more than 2000 m frequently exist. Hence, several valley systems (Wadis in Arabic) are detaching from these peaks towards the Red Sea.
Wadi Aurnah Watershed is located between the following geographic coordinates: 39° 12′ 00" E; 40° 18′ 00" E and 21° 01′ 30"N; 21° 35′ 30"N. It is one of the major five catchments in the central part of the Tihamah-Hijaz (middle part of the Arabian Shield) region. It is surrounded from the east by a number of mountain chains. These are: Jabal Twayriq (1872 m), Jabal Al Amid (2135 m) and Jabal Bared (2337 m), Al Tarykah (2402 m) and Jabal Al-Adim (2476 m). The catchment of this wadi comprises about 3113 km2. Within this catchment, the Holy Muslim city of Makka Al Mukaramah is located. This, in turn, increases the human activities, notably in Hajj pilgrimage.
The area of concern (Wadi Aurnah Watershed) is characterized by the Mediterranean climate in winter and of monsoonal rainfall during spring. However, Hijaz Escarpment serves as a climatic barrier that hinders air
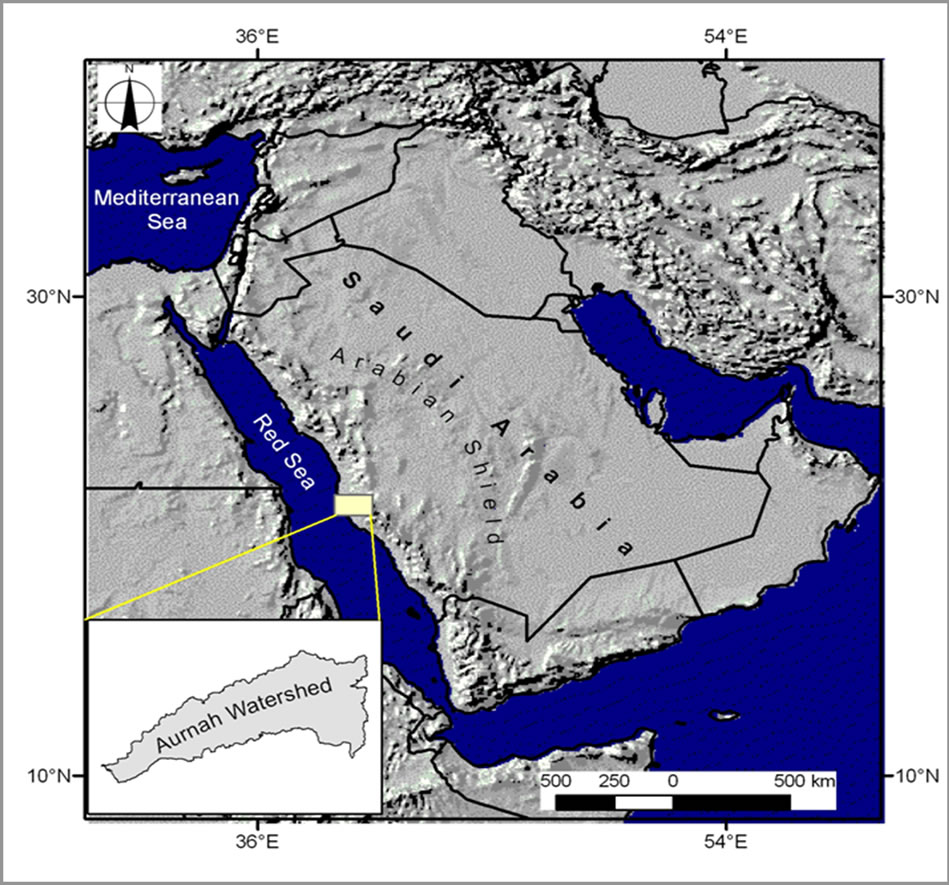
Figure 1. Location map of the study area.
masses derived from the west. Although some studies calculated the average rainfall in the area of concern as 350-400 mm such as in Italconsult [2] and [3], but recent records exhibit less amounts of annual rainfall. Thus, low rainfall rate dominates the area of concern, and it ranges between 50 and 200 mm a year. In addition, sand storms commonly exist, which makes the basin covered by about 880 km2 of sand desert (~28% of the whole area).
According to Moor and Al-Rehaili [4] and Sahl [5], the geology of the area is dominant by Late Precambrian and plutonic rocks. In addition, Tertiary sedimentary rocks occur in the fault-bounded troughs near the Red Sea coast. The Cenozoic lavas form extensive fields in the north part of the area. The Quaternary surficial deposits are widespread on different, but they are mainly concentrated in the coastal plain.
The geomorphological features and catchment characteristics of Wadi Aurnah were included in a number of studies, such as those done by Es-Saeed et al. [6]; Merza and Baroudi [7] and Aawari [8]. However, obvious contradictory exists in these studies, notably in the cartography of the catchment boundary. This contradictory is attributed mainly to the complicated geological setting of the area, which is reflected in extensive geological structures and geomorphologic features. This, in turn, results errors in delineating the exact limits of water divides. As well as the frequent intermittency in stream networks added another problem in tracing the drainage system. In this respect, the accuracy in watershed delineation is important, since the area and perimeter of a watershed are used in climate interpolation and run-off calculations.
This study aims to reach an accurate delineation of Wadi Aurnah catchment boundary. This enables consequently characterizing its geomorphic and hydrologic measures, and help in calculating the relevant numerical relations. This was achieved through a detailed tracing approaches from topographic maps (1:50000) as well as from satellite images with high resolution.
2. Materials and Method
Delineation of catchment boundary can be done manually or automated. However, there is still disagreement on the reliability of drainage extraction by automated methods, notably in areas dominant with complicated geology and rugged topography. Almost all workers in this concern pointed out that manual extraction of appropriate scale is more reliable than the automated ones [9−14].
In this study, manual delineation was primarily carried out from topographic maps. It was achieved by tracing the drainage networks and this includes all appeared streams and reaches on topographic maps. However, remote sensing and Geographic Information System, GIS techniques were utilized whenever erroneous and obscure drainage behaviour exists. For this purpose, 17 map-sheets (1:50000 scale) were used to trace the drainage system of the whole Arunah Watershed area. The sampling of streams and reaches involved drawing lines connecting the slope or ridge tops. Assuming the water will drain away from those points, the watershed is delineated by enclosing a polygon (Figure 2). This delineation was achieved digitally in GIS (Arc View) system, and the satellite images were subjected to several digital and optical advantages including: band combination, colour slicing, edge detection, filtering, in addition measuring tools were used to calculate different dimensions (e.g. total length, perimeter, number of reaches for each stream order, etc).
Several cartographic problems existed during the manual tracing of drainage network from topographic maps, since the available topographic maps revealed erroneous aspects of drainage behaviour, and more certainly in stream connectivity. Hence, in the available maps, streams sometime disappear, notably where Quaternary deposits exist. This phenomenon is dominant in the coastal plain of the study area and can be attributed mainly to:
1) Low rainfall rate that results slow run-off, and low-level stream water2) High evaporation rate, which reduces the water flux in channels3) The dominant Quaternary deposits (sand dunes, alluvial, aeolian sediments, etc) characterize the terrain by high porosity and permeability, thus streams easily enter into these deposits and disappear.
In order to avoid this problem, remotely sensed data was utilized. ASTER satellite images were processed using ERDAS Imagine software. These images are characterized by 15m resolution in visible bands and 90m in
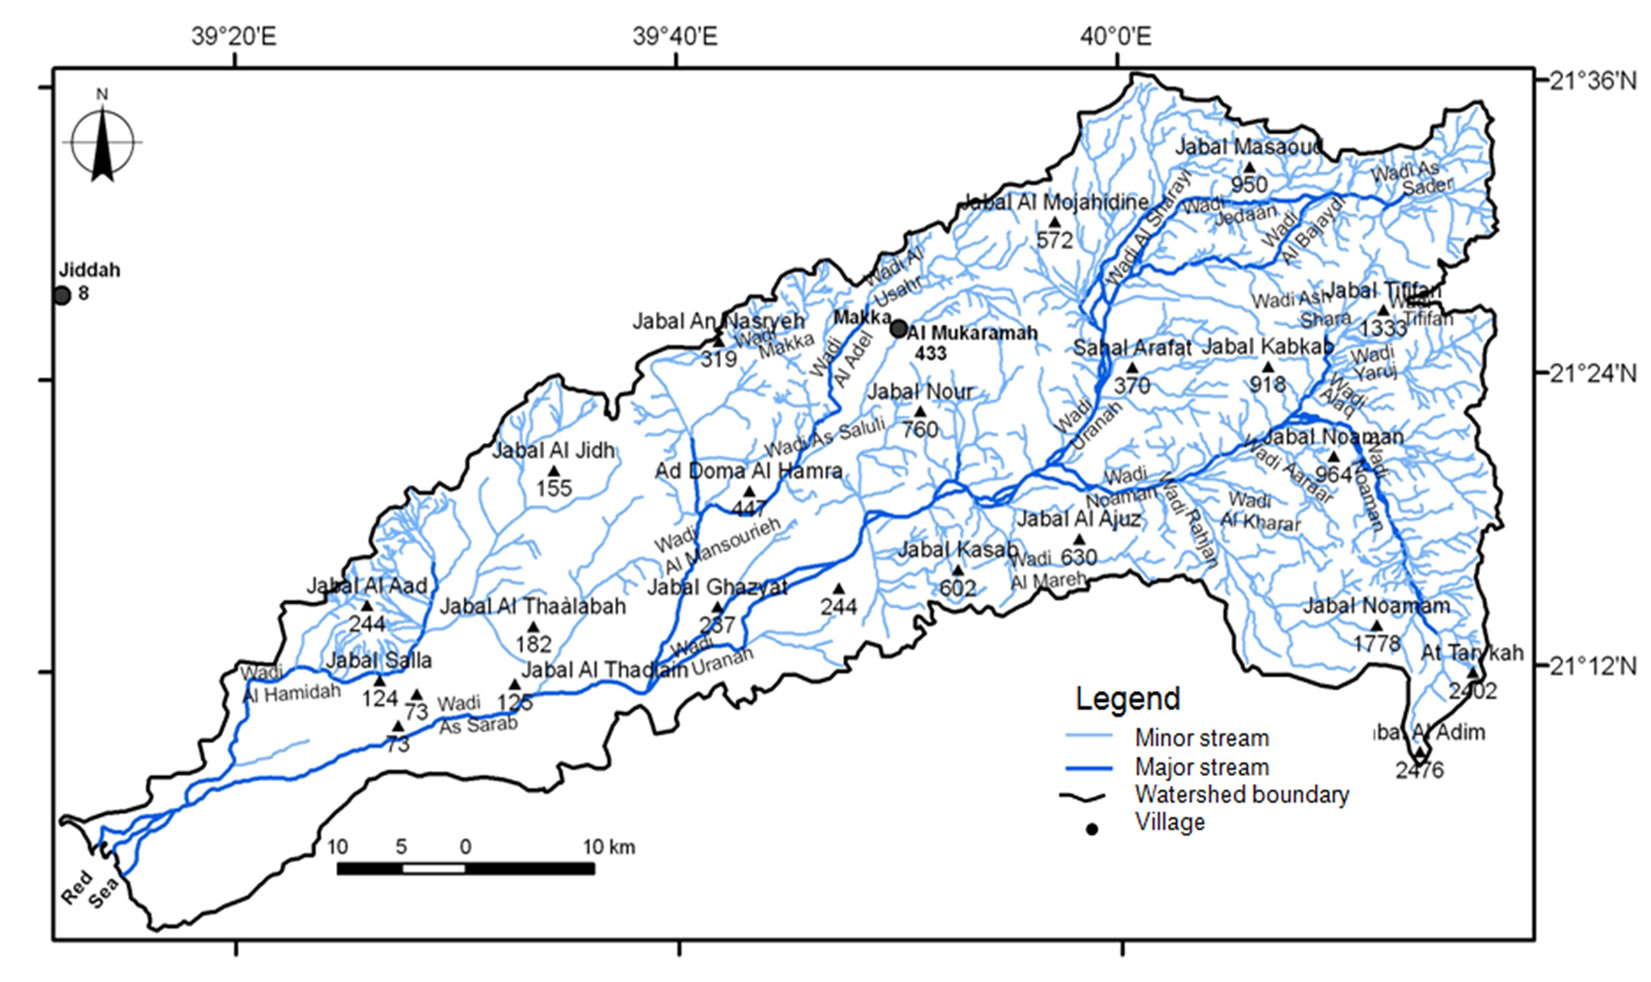
Figure 2. The catchment area of Wadi Aurnah.
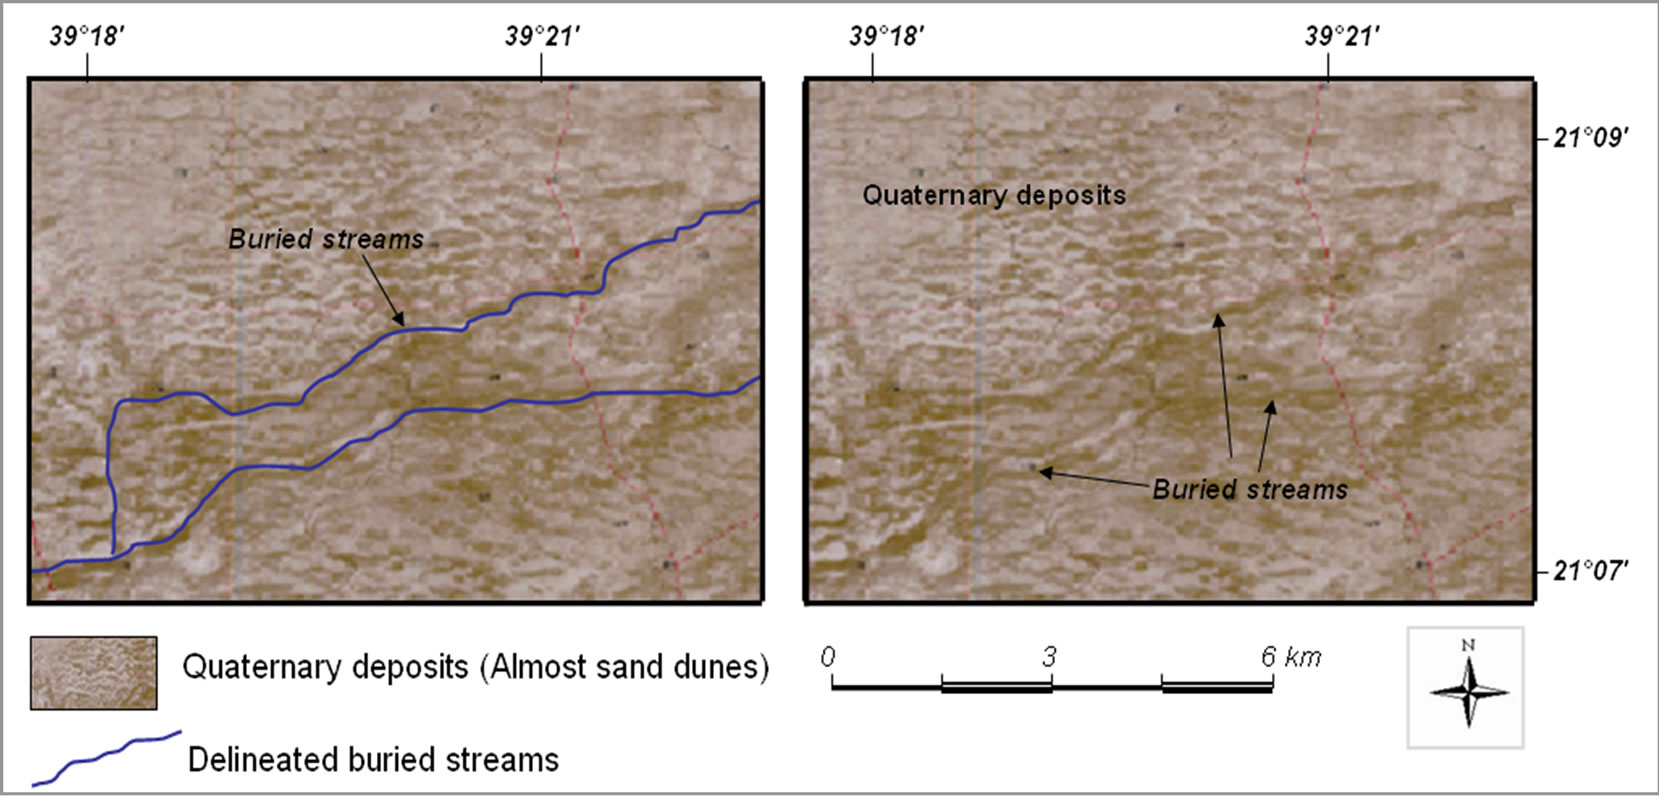
Figure 3. Example showing the tracing of buried streams in the coastal plain of Wadi Arunah, using thermal bands in ASTER images.
Thermal Infrared (TIR) bands. Accordingly, the thermal interpretation from the thermal bands was useful in this study. Bands 10-14 in ASTER images provided creditable information on porous sediments, which almost occupy wet horizons and buried streams. Figure 3 shows an example of using thermal bands in ASTER images to trace buried streams in the coastal plain of Wadi Arunah.
Another major problem existed during the delineation of stream network from the available maps is the connection between streams of opposite flow directions, which results errors in plotting water divides. This was common in the available maps, notably where terrain features overlap with stream routes, such as roads that exist among valleys. For this purpose, the available satellite images with high resolution (i.e. IKONOS, 1m resolution) were used. A clear example is shown in Figure 4.
3. Results and Data Analysis
More than 20 wadis exist in the studied catchment and compose complete network of drainage system. Ten of these wadis are major ones (i.e., cross-section area more than 40m2). Some of these wadis are joined with each other, such as Aurnah and Wadi As Sarab where both are
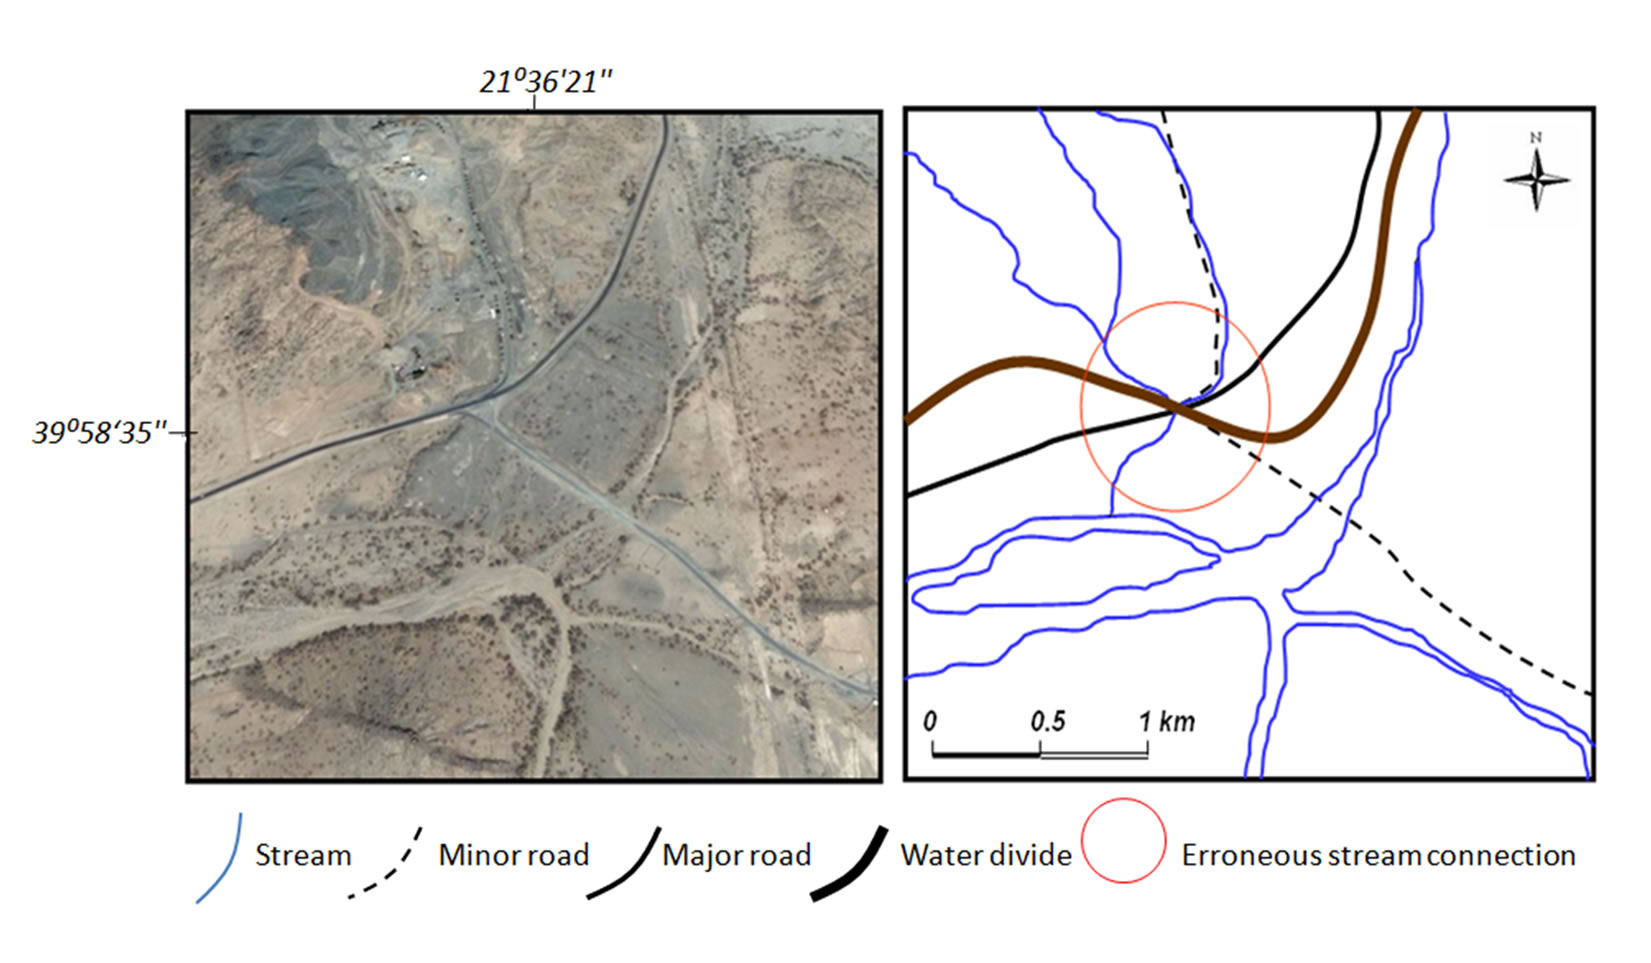
Figure 4. Example from the area of study showing the use of IKONOS images to discriminate the roads from streams, which observed in conflict behavior on topographic maps.
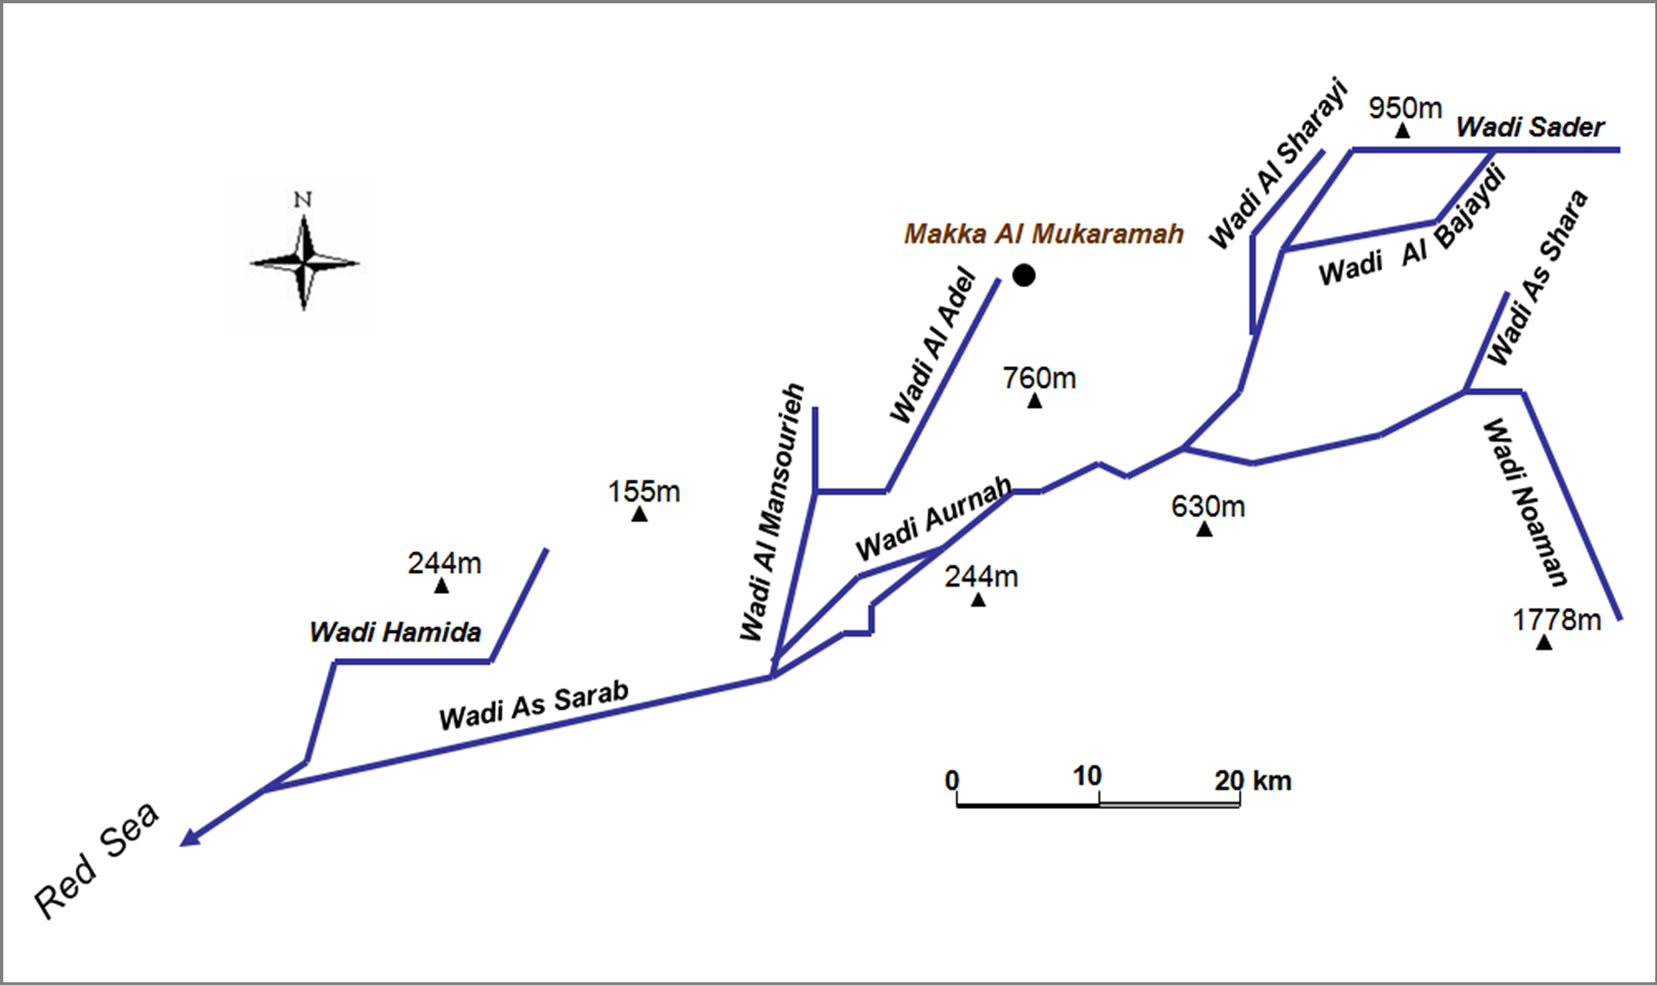
Figure 5. Schematic presentation of the major wadis in the Wadi Aurnah.
oriented in the NE-SW direction to compose one major wadi (Figure 5a). The resulting wadi is joined with another (unique) wadi from the south (i.e. Wadi Noaman). There are also other connecting wadis in the north. They appear in a parallelel to each other in the NE-SW direction with an angle of connection of about 30-40 degrees to the primary wadi (Figure 5b).
The accurate cartography of Wadi Aurnah Watershed (Figure 1) enables characterizing the relevant geomorphologic and hydrological measures. Usually, the selection of measures depends mainly on the purpose of the study (e.g., water harvesting, tanks construction, floodprone areas, etc).
The production of data digitally in a GIS system gives chance to manipulate different measures and calculations. In addition, modifications and corrections can be regularly applied in GIS system, especially those changes occurred with time (e.g., urban expansion on stream courses, excavation, etc). Therefore, the following are the obtained geomorphic and hydrologic measures on Wadi Aurnah Watershed.
3.1. Volume of Precipitated Water (P)
Usually, in watershed management studies, the volume of precipitated water (P) is primarily calculated. The main variables required for this volumetric measure are the area of the catchment (Ac) and the average precipitation rate (Pr).
According to Wadi Aurnah watershed, and since the determined area is 3113km2; therefore, the average precipitation rate remains the variable to be measured. However, in the lack of accurate and updated climatic records, remotely sensed data can be utilized. Hence, TRMM (Tropical Rainfall Mapping Mission) rainfall data was used in this study. It is a space technique introduced by NASA to produce daily records of rainfall data (Figure 6). Several studies, related to rainfall, were successfully obtained relying on TRMM products [15−17].
The estimated average precipitation rate for Wadi Aurnah watershed as obtained from TRMM, for the years between 2004 and 2007 is 145mm. Therefore, the volume of precipitated water (P) can be calculated as follows:
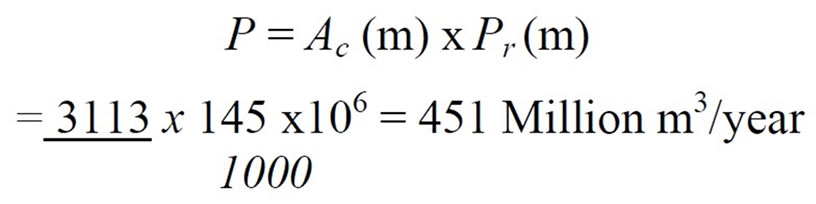
The calculated amount shows discrepancy with old measures, which were estimated as more than 900 Million m3/year.
3.2. Hypsometric Curve
It is an empirical cumulative function of elevations in a catchment that can be made by measuring the area lying between successive pairs of contours. The percentage of the total that each of these areas constitute are then computed, and the percentage of the total area lying above or below each different contour is obtained by summation.
For Wadi Auranah Watershed, the obtained elevation/area data is plotted in Table 1, and it was graphically expressed in Figure 7. This data was derived from topographic maps (1:50000) with 20-meter contour interval. Therefore, the contour map of the area was digitally made by using GIS (Arc view software).
The obtained hypsometric curve (Figure 7) shows that about 30% of the catchment is characterized by steep slope terrain. While about 48% of the catchment owns gentle sloping terrain, in which the elevation is less than

Figure 6. Example showing precipitation record from TRMM data for Wadi Aurnah watershed.
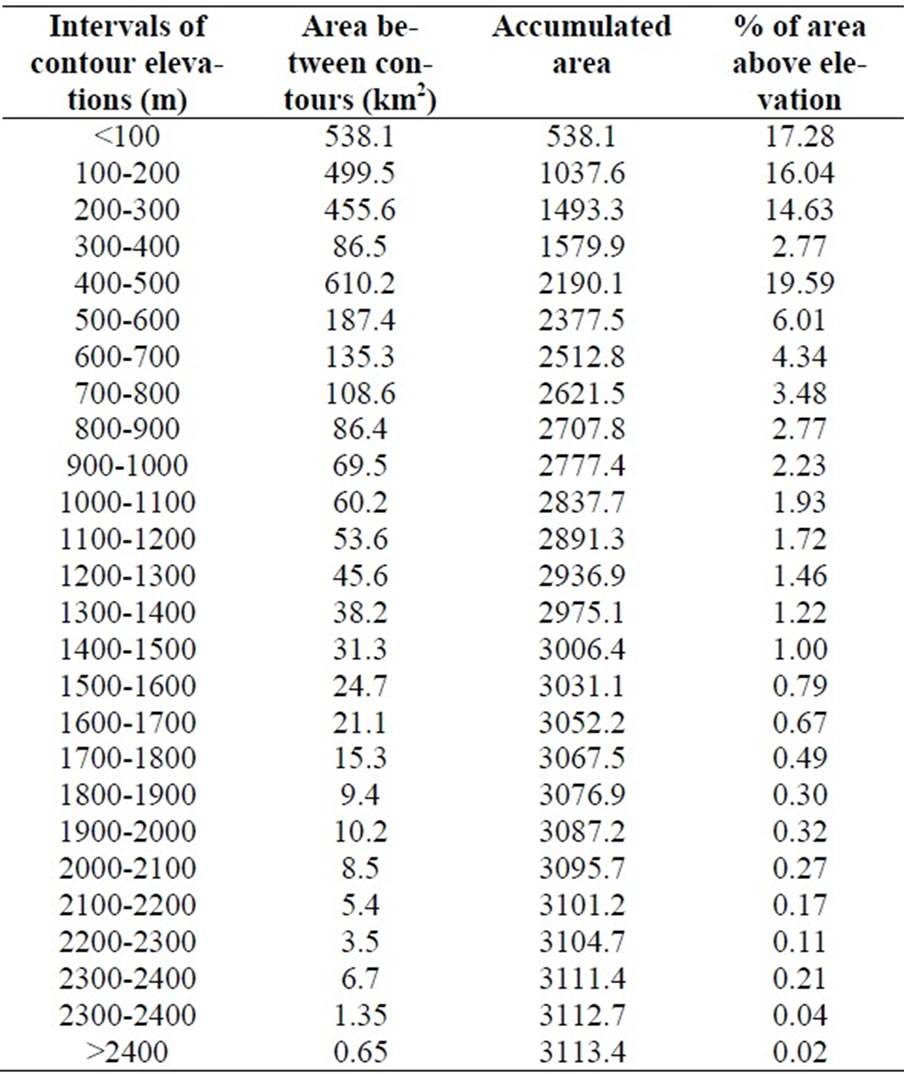
Table 1. Elevation/area measures of Wadi Aurnah Watershed.
1500m. In addition, the curve shows sharp signatures in elevation, which are attributed mainly to the existence of fault systems.
Accordingly, from the obtained data mean altitude (Ma) can be calculated in the following equation:
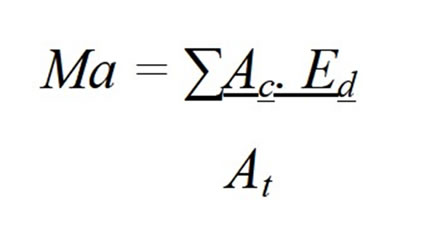
where Ac is the area between each two adjacent contours, Ed is the difference between these contours and At is the total area of the catchment. Therefore, the mean altitude in Wadi Aurnah is estimated at 452m.
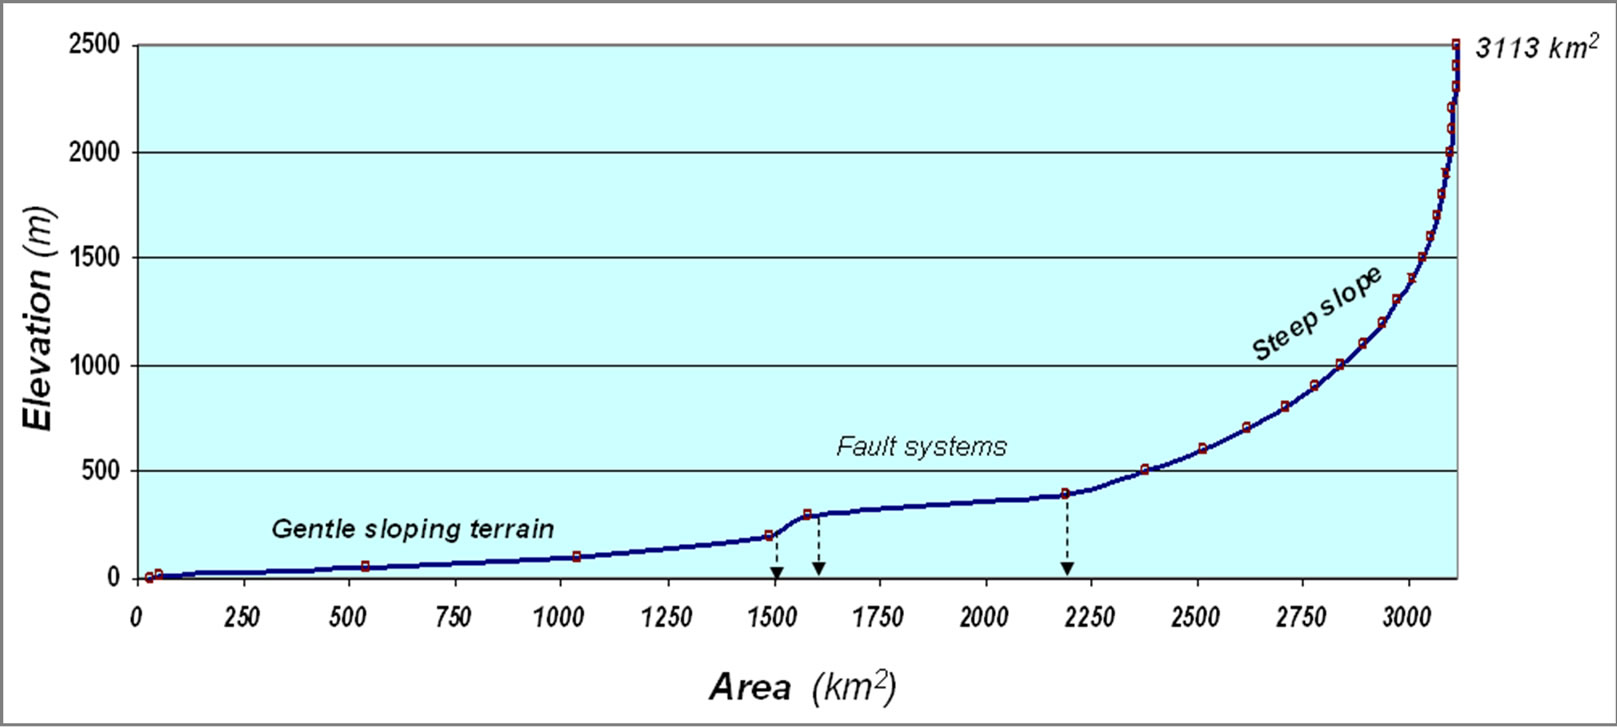
Figure 7. Hypsometric curve of Wadi Aurnah watershed.
3.3. Relief Ratio (Rr)
The relief ratio is a measure of basin average slope. It provides an approximate estimate on the topographic gradient affecting the lateral movement of groundwater in near-surface saturated areas on the scale of the entire basin. High values of Rr should be correlated with efficient lateral redistribution of moisture. It is also a function of infiltration, surface runoff, erosion and flow velocity [18]
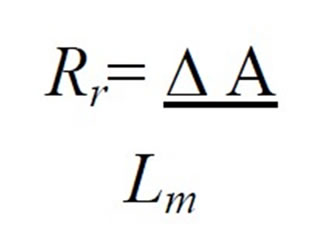
where ∆ A is the altitude difference and Lm is the maximum stream length.
For Wadi Aurnah catchment, Rr was calculated as follows:
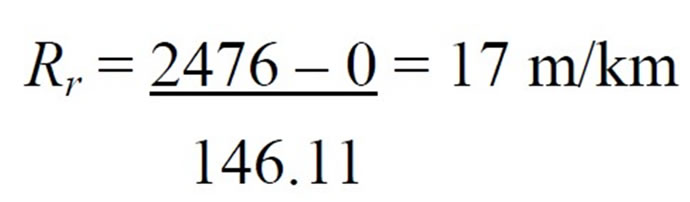
The resulting ratio indicates low to moderate relief slope, which hinders the erosional processes, except in they exist in torrential rainfall events.
3.4. Texture Topography (Tt)
This measure represents the degree of drainage dissection. It indicates the tendency of terrain to shrink water, which is influenced by lithology and structure as well. Accordingly, Smith [19] classified texture topography into three major classes. These are: soft, moderate and rough for the values < 4, 4-10 and > 10; respectively. The following equation expresses the texture topography:
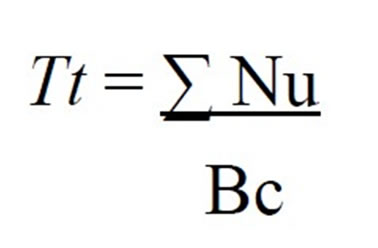
where Nu = number of tributaries (as obtained by digitally in GIS-Arc View), and Bc = basin perimeter.
For Wadi Aurnah catchment, the texture topography will be:
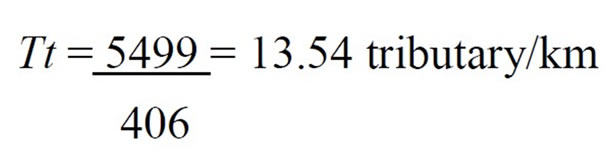
The resulting value of texture topography indicates the existence of rough topographic terrain, which often retards the energy of run-off process due to the existence irregular surface features (e.g., massive rock boulders, depressions, etc.).
3.5. Relief Gradient (Rg)
It represents landmass maturity; therefore, a region in youth stage shows frequency distribution skewed towards the lower elevation. Whilst, an old stage region, shows distribution skewed towards the high elevation. Pike and Wilson [20] have suggested that degree of dissection can be characterized by a relief gradient, which expresses the ratio of upland to lowland elevations within the catchment area, and expressed as:
Rg = Mean Elevation – Minimum Elevation Maximum Elevation – Minimum elevation Therefore, the relief gradient of Wadi Aurnah Watershed i:
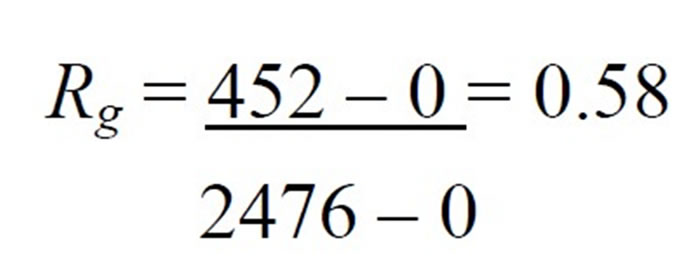
The resulting relief gradient exhibits low to moderate value, which indicates that Wadi Aurnah is still under a mature stage of development.
3.6. Mean Catchment Slope (Cs)
Mean catchment slope Cs is considered as an index to the general gradient of the catchment, which is tightly related to the geologic setting of the catchment. Thus, it influences the velocity of runoff and thus erosion processes. According to Gordon et al. [21], Cs is simply calculated by:
Cs = (Elevation at 0.85 L) – (Elevation at 0.10L)
Elevation at 0.75 L where L is the maximum length of the basin, and measurements are taken along this line (0.01 L near the lower part of the catchment and 0.85 L towards the upper end).
For Wadi Aurnah Watershed, the mean catchment slope is:
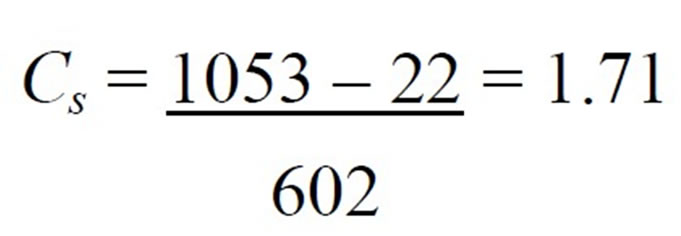
Likewise the indicative results in relief ratio and gradient, the mean catchment slope also shows a low to moderate terrain slope for the whole catchment area.
3.7. Shape
There are several shapes of catchments that are supposedly reflecting run-off “bunch up” at the outlet. Certainly, the ultimate concentration of its peak flow can be used to help in studying the effects of basin shape on the hydrograph and on stream behaviour [22] (Black, 1991).
For example, a circular catchment would result in run-off from various parts of the watershed reaching the outlet at the same time. While, an elliptical watershed having the outlet at one end of the major axis and having the same area as the circular watershed, would cause the runoff to be spread out over time, thus producing a smaller flood peak than that of the circular watershed.
A number of watershed properties have been developed to reflect basin shape. The following are the major properties:
3.7.1. Width/Length Ration (WL)
The ratio between width (W) and length (L) in a drainage basin is a function of time that runoff effectively reaches the major watercourse. The higher the WL ratio, the higher the runoff duration is (i.e., adequate time lag for infiltration process).
For the catchment of Wadi Aurnah, the maximum width is 56.79 km and the maximum length is 123.5 km; therefore, WL ration will be:
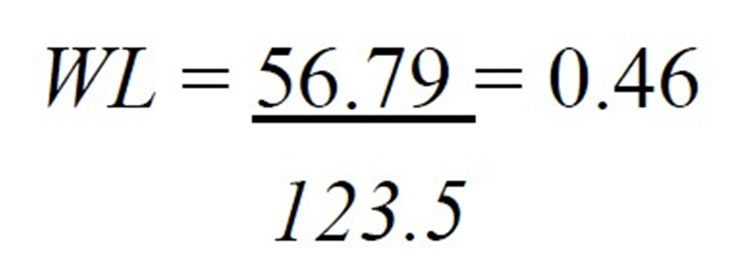
This indicates that WL ration of Wadi Aurnah is almost moderate, since it represents a 1:2 proportion between both dimensions. This doubled ratio reveals that the basin of Wadi Aurnah has a uniform catchment shape (Figure 2).
3.7.2. Length to the Center of Area (Lca)
It is the distance measured along the main channel from the basin outlet to the point on the main channel opposite the center of area as shown in Figure 8). Hence, it considers the distance between the threshold and outlet of a basin and its orientation and does not express its area. An example is shown in Figure 8 for two basins with equal area, but different orientation and thus unequal Lca.
The Lca for Wadi Aruanh Watershed is 64.88 km. Comparing Lca for the total length of the catchment (123.5km), thus, it is nearly equal to half of the total length. This indicates regular flow of surface water run-off within the basin.
Shape factor (L1)
L1 = (LLca) 0.3
where L is the maximum length of the watershed. Thus, the L1 for Wadi Aruanh Watershed will be:
L1 = (123.5 x 64.88) 0.3
= 14.83
3.7.3. Circularity Ration (Rc)
The circularity of shape measures the degree of similarity between the outer limits of the catchment with a circle [23]. According to Strahler [24] it can be expressed in the following equation:
Rc = A/A0
where A0 is the area of a circle having a perimeter equals to the perimeter of the basin. Since the perimeter of the area of Wadi Aurnah is known (406 km); thus to measure the area of the circle, the radius must be primarily calculated. Consequently, obtaining the perimeter/radius equation as follows:
P = 2 л r
406 = 2 x 3.14 r
r = 64.64
Having the radius enables calculating the area of the circle as follows:
A = 2л r2
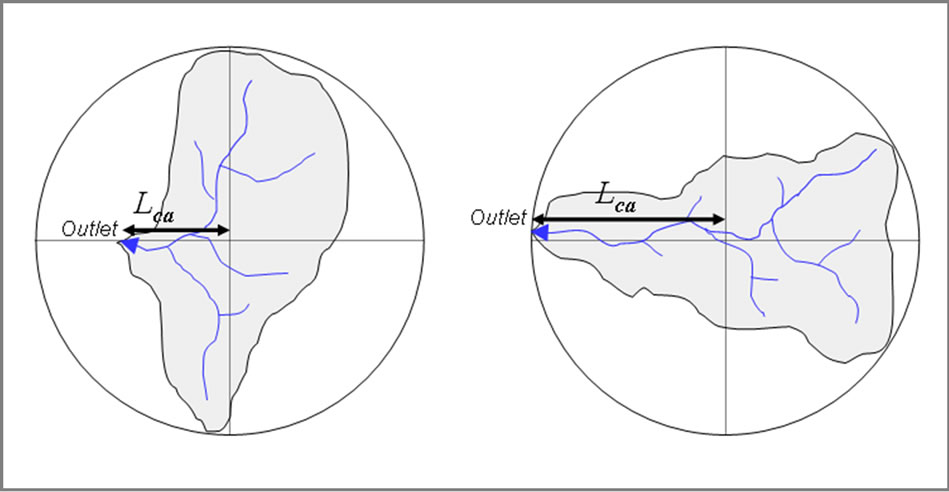
Figure 8. Example showing two basins with the same area, but different orientation, thus the influence of this shaping on water discharge.
A= 2 x 3.14 x 64.64 = 13124 km2
Therefore, the circularity ration will be:
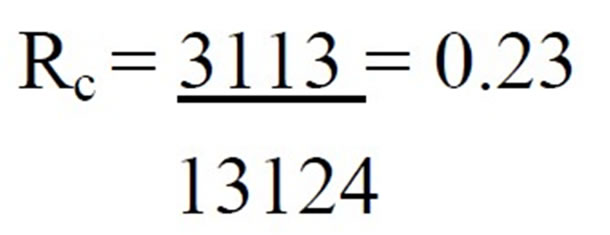
The circularity (Rc) of the studied basin is considered as moderate, and this confirms the previous resulting values of Lca and L1. Hence, regularity in discharge quite exists. This also indicates that the basin is in the mature stage of development.
3.7.4. Elongation Ration (Re)
The elongation ration describes the degree of catchment stretching with respect to its area. Thus, it equals 1 for a circle and 0 for a straight line. Figure 9 presents a schematic example of two basins with different elongation ratio; thus the behavior of discharge is almost unequal in both cases.
According to Schumm [25], the elongation ration is expressed as:
Re = 2/Lm (A/p) 0.5
where Lm is the maximum length of the catchment parallel to the principal drainage lines. Thus, the elongation ration for Wadi Aruanh Watershed is:
Re = 2/146.11 (3113/3.14) 0.5
= 0.166
The resulted elongation ration also points out to a typical catchment area, where surface water is uniformly fed from the existing streams and then discharge in the outlet. This, in turn coincided with the width/length ration.
The above measures of the catchment shape are of significant, because they represent hydraulic parameters, which are often utilized in watershed management approaches and land use planning [26]. They are also essential to calculate a number of hydraulic coefficients for engineering and hydrologic practices.
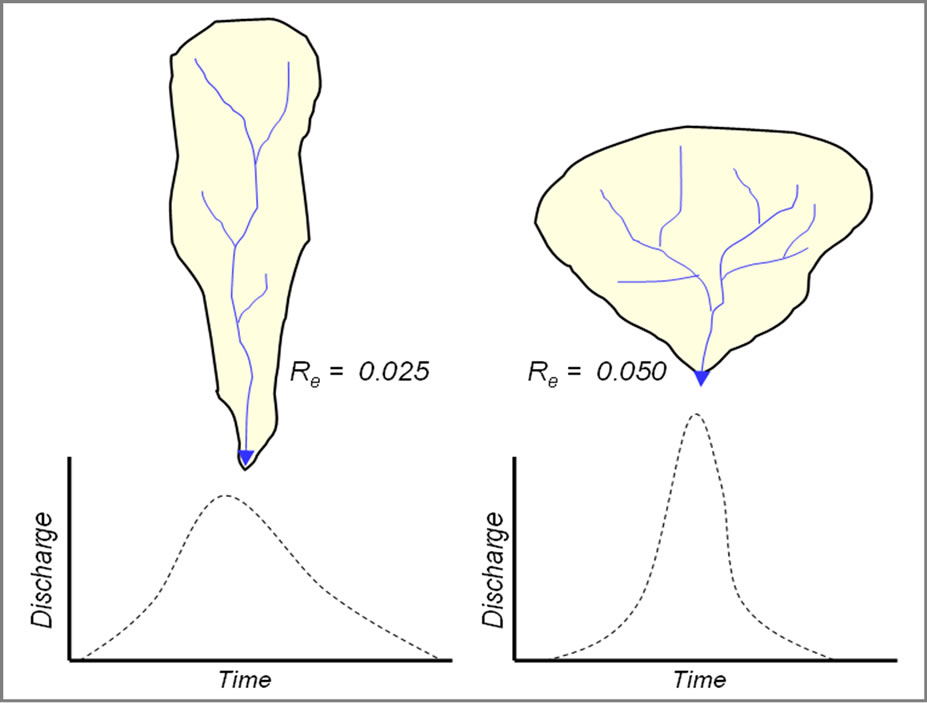
Figure 9. Example showing the relationship between basins of different elongation ratio and their discharges.
4. Discussions and Conclusions
The current study presents a method of watershed analysis for a typical catchment in the Western part of Arabian Peninsula. It provides detailed information on the geomorphologic setting of the catchment and its hydrologic characteristics.
The applied approach of catchment cartography was precisely implemented, not only by conventional method of drainage sampling, but also by using new techniques of remote sensing and GIS. This was a helpful tool to support the manual streams sampling directly from the topographic maps. Therefore, the obtained digital data set was the first of its type that made on Wadi Aurnah Watershed. If it would be utilized in hydrologic studies, then it can provide valuable information for watershed management and land use planning.
The fundamental output in this study is the new accurate approach of streams’ sampling and catchment delineation and thus calculating the exact area of the catchment, which owned discrepancy in different previous studies. Also, it helped calculating the amount of water received from rainfall, which can be included as a principal variable in assessing water budged for the basin. It was found that the catchment receives a very amount of water from rainfall, since only 145.000 m3 supplies each 1 km per year, which is not adequate to recharge the existing aquifers in the region.
The major hydrologic variables were calculated and their measures were obtained by the GIS system, which enables applying different measures and calculations in a simple approach of application. The established hypsometric curve was also essential to identify the elevation/area ratio. It was found that the average altitude in Aurnah catchment is 452 m, and only about 10% of the area extends above 1000m altitude, and around 50% of the area is located in altitude of less than 250m. In addition, a steep sloping terrain exists between the most elevated peaks (i.e. 2476m down to about 2200m) where gentle slopes occur. The later is interrupted by an acute regression trend, which is attributed to the existing fault blocks. These faults represent the transitional area between the elevated region and the coastal plain, and control the boundary of some sub-basins exists in the area.
The overall relief of the studied catchment is low to moderate as it was identified from the relief ratio (Rr), relief gradient ((Rg) and mean catchment slope (Cs), which were estimated as 17 m/km, 0.58 and 1.71 for each of them; respectively. This creates slow run-off with sufficient time lag for evaporation and infiltration as well. Moreover, the low-moderate relief reduces the impact of erosional processes, notably the channel erosion. Added to this, the effective relief properties, the rough texture topography, which may retard surface run-off, thus creates non-uniform flow regime and, likewise that in the relief properties, it helps giving enough time for evaporation and infiltration rates, besides low effective erosion.
The shape characteristics of Wadi Aurnah exhibit typical shape type. It is a funnel-like shape with a uniform width/length ration. This ration (i.e., 0.46 or ~1: 2) helps an equal distribution of stream flow from mountain ranges towards the outlet into the primary watercourse. This fact was also supported by the resulting value of length to the center of the area (Lca), which is almost half of the total stream length. In the other hand, the applied shape parameters (L1, Rc and Re) all are coincided and indicate that the overall shape of the catchment is regular with uniform boundary distribution. This is definitely considers the catchment shape, whilst other physical and anthropogenic factors (faults, land use.etc) may interfere and create irregular flow regime.
The above measures, in combination with site investigation, often are used by hydrologists and engineers, especially in constructing dams, water tanks, lakes, etc. Thus, combination of obtained measures would provide a comprehensive figure on the catchment characteristics, which can be used mainly in optimum watershed management approaches.
REFERENCES
- M. Al Saud, “Using satellite imageries to study drainage pattern anomalies in Saudi Arabia,” Environmental Hydrology Journal, Vol. 15, No. 30, pp. 1−15, 2007.
- Italconsult, “Water supply survey for Yeddah–Makkah −Taif area,” Special Report, Geological Investigation, Ministry of Agriculture and Water, No. 3, 1967.
- M. Merza and A. Youssef, “Climate conditions in winter in Makka Al Mukaramah,” Kuwait Geography Society, Vol. 253, 2001.
- A. Moor and M. Al-Rehaili, “Geological map of Makka Quadrangle sheet 21D,” Kingdom of Saudi Arabia, Unpublished M.A. Thesis, University of Eastern Michigan, 1989.
- M. Sahl, “Geology of Makka Al Mukaramah City area,” Saudi Arabian Deputy Ministry for Mineral Resources, Report DGMR, pp. 238, 1987.
- M. Es-Saeed, Z. Sen, A. Basamad, A. Dahlawi, and W. Al-Bardi, “Strategic groundwater storage in Wadi Naá- man, Makka region, Saudi Arabia,” Technical Report (in Arabic), Saudi Geological Survey-TR-2004-1, pp. 32, 2004.
- M. Merza and M. Baroudi, “Geological and geomorphological principles of Makka Al Mukaramah and their role in terrain topography,” Unpublished Technical Report (in Arabic), pp. 102, 2005.
- I. Aawari, “Vegetation cover in Wadi Noaman with special emphasis on its tributary: Wadi El Majayrish,” Unpublished MSc thesis (in Arabic), Department of Geography, Faculty of Arts, Jiddah, KSA, pp. 473, 2005.
- D. Mark. “Relations between field-surveyed channel networks and map-based geomorphometric measures,” Inez, Kentucky, Ann. Assoc. Am. Geogr., Vol. 73, No. 30, pp. 358−372, 1983.
- J. O’Callagham and D. Mark, The extraction of drainage networks from digital elevation data,” Computer Vision, Graphics Image Processing, Vol. 28, pp. 323−344, 1984.
- S. Jenson and J. Domingue, “Extracting topographic structure from digital elevation data for geographic information system analysis,” Photogram. Eng. Sens., Vol. 54, No. 1, pp. 1593−1600, 1988.
- A. Tribe, “Automated recognition of valley heads from digital elevation models,” Earth Surface Processes Landforms, Vol. 16, pp. 33−49, 1991.
- A. Ichoku, A. Meisels, and J. Chorowicz, “Detection of drainage channel networks on digital satellite images,” International Journal of Remote Sensing, Vol. 17, pp. 1659−1678, 1996.
- J. Martinez-Casasnovas and H. Stuiver, “Automated delineation of drainage networks and elementary catchments from digital elevation models,” ITC Journal, Vol. 3, pp. 198−208, 1998.
- Y. Ohsaki, A. Numata and T. Higashinwaatoko, Validation of rain/no-rain discrimination in the standard TRMM data products 1B21 and 1C21, IEEE., Vol. 2, pp. 875−877, 2000.
- L. Chiu, G. Serafino and W, Terg, “Applications of Tropical Rainfall Measuring Mission (TRMM) data,” IEEE, Vol. 5, pp. 2118−2120, 2002.
- C. Scott, C. Thomas and L. Scott, “A comparison of TRMM to other basin-scale estimates of rainfall during the 1999 Hurricane Floyd flood,” Natural Hazards, Accepted online, 2009.
- R. Chorley, S. Schumm, D. Sugden, and D. Geomorphology, Methuen, London, pp. 607, 1984.
- K. Smith, “Standards for grading texture of erosional topography,” American Journal of Science, Vol. 248, pp. 655‑668, 1950.
- R. Pike, S. Wilson, and S. Elevation-relief ratio, “Hypsometric integral and geomorphic area-altitude analysis,” GSA Bull., Vol. 82, pp. 1079−1084, 1971.
- D. Gorden, A. McMahon, and L. Finalson, “Stream hydrology: John Wiley & Sons Ltd,” Chichester, England, pp. 523, 1992.
- P. Black, Watershed Hydrology, Prentice Hall Advanced Reference Series, NJ, pp. 324, 1991.
- V. Miller, “A quantitive geomorphic study for drainage basin characteristics in the Clinch Mountain area,” Virginia and Tennessee, Technical Report, Geology Depart., Colombia University, I-30, N6 ONR 271-30, No. 3, 1953.
- A. Strahler, “Dimensional analysis applied to fluvial eroded landforms,” Geol.Soc.America. Bull., Vol. 69, pp. 279−300, 1958.
- S. Schumm, “The elevation of drainage systems and slopes in badlands at Perth Amboy,” Geol. Soc. Amer. Bull., New Jersey, Vol. 67, pp. 597−646, 1956.
- M. Jane, “Geomorphological & land use planning for Dana watershed. GIS Development,” 2008. Available on: http://www.gisdevelopment.net/application/nrm/water/watershed/watws0008pf.htm.