Journal of Software Engineering and Applications
Vol.07 No.12(2014), Article ID:51394,15 pages
10.4236/jsea.2014.712086
Detecting Design Patterns in Object-Oriented Program Source Code by Using Metrics and Machine Learning
Satoru Uchiyama, Atsuto Kubo, Hironori Washizaki, Yoshiaki Fukazawa
Department of Computer Science and Engineering, Waseda University, Tokyo, Japan
Email: s.uchiyama1104@toki.waseda.jp, kubo@nii.ac.jp, washizaki@waseda.jp, fukazawa@waseda.jp
Copyright © 2014 by authors and Scientific Research Publishing Inc.
This work is licensed under the Creative Commons Attribution International License (CC BY).
http://creativecommons.org/licenses/by/4.0/


Received 11 August 2014; revised 10 September 2014; accepted 5 October 2014
ABSTRACT
Detecting well-known design patterns in object-oriented program source code can help maintain- ers understand the design of a program. Through the detection, the understandability, maintaina- bility, and reusability of object-oriented programs can be improved. There are automated detec- tion techniques; however, many existing techniques are based on static analysis and use strict conditions composed on class structure data. Hence, it is difficult for them to detect and distin- guish design patterns in which the class structures are similar. Moreover, it is difficult for them to deal with diversity in design pattern applications. To solve these problems in existing techniques, we propose a design pattern detection technique using source code metrics and machine learning. Our technique judges candidates for the roles that compose design patterns by using machine learning and measurements of several metrics, and it detects design patterns by analyzing the re- lations between candidates. It suppresses false negatives and distinguishes patterns in which the class structures are similar. As a result of experimental evaluations with a set of programs, we confirmed that our technique is more accurate than two conventional techniques.
Keywords:
Design Patterns, Software Metrics, Machine Learning, Object-Oriented Programming, Software Maintenance

1. Introduction
A design pattern is an abstracted repeatable solution to a commonly occurring software design problem under a certain context. Among the large number of reported design patterns extracted from well-designed software, the 23 Gang-of-Four (GoF) design patterns [1] are particularly known and used in object-oriented design.
Design patterns targeting object-oriented design are usually defined as partial designs composed of classes that describe the roles and abilities of objects. For example, Figure 1 shows a GoF pattern named the State pat- tern [1] . This pattern is composed of roles named Context, State, and ConcreteState.
Existing programs implemented by a third party and open source software may take a lot of time to under- stand, and patterns may be applied without explicit class names, comments, or attached documents. Pattern de- tection is expected to improve the understandability of programs; however, manually detecting patterns in exist- ing programs is inefficient, and patterns may be overlooked.
Many researches on pattern detection to solve the above problems have used static features of patterns. How- ever, such static analysis has difficulty in identifying patterns in which class structures are similar. In addition, there is still a possibility that software developers might overlook variations of patterns if they use a technique utilizing predefined strict conditions of patterns from the viewpoint of structure; patterns which are sometimes applied slightly vary from the predefined conditions.
We propose a pattern detection technique that uses source code metrics (hereafter, metrics) and machine learning for detecting firstly roles and secondly patterns as structure of those roles1. Although our technique can be classified as a type of static analysis, unlike conventional detection techniques it detects patterns by identify- ing characteristics of roles derived by machine learning based on the measurement of metrics without using strict condition descriptions (class structural data, etc.). A metric is a quantitative measure of a software property that can be used to evaluate software development. For example, one such metric, number of methods (NOM), refers to the number of methods in a class [2] . Moreover, using machine learning, we can in some cases obtain previously unknown characteristics of roles for identification by combinations of various metrics. To cover a diverse range of pattern applications, our method uses a variety of learning data because the results of our tech- nique may depend on the type and number of learning data used during the machine learning process. Finally, we conducted experiments comparing our technique with two conventional techniques and found that our ap- proach was the most accurate of the three for small-scale programs and large-scale ones used in the experiments (Figure 2).
2. Conventional Techniques and Their Problems
Most of the existing detection techniques are based on static analysis [4] [5] . These techniques chiefly analyze information such as class structures that satisfy certain conditions. If they vary even slightly from the intended strict conditions, or two or more roles are assigned in a class, there is a possibility that these techniques might overlook patterns. For example, many of the conventional techniques based on static technique can detect the Singleton pattern [1] in the typical implementations shown in Figure 3. However, regarding specialized imple- mentation using a boolean variable, as shown in Figure 4, the Singleton pattern cannot be detected by the con- ventional techniques based on static analysis. On the other hand, our technique successfully detect the Singleton pattern for both implementations due to the flexible nature in the machine learning of metric measurements for identifying roles and the entire process composed of multiple steps including judging candidate roles and de- tecting patterns.
Distinguishing the State pattern (shown in Figure 1) from the Strategy pattern (shown in Figure 2) is also difficult for conventional techniques based on static analysis because their class structures are similar. Unlike these techniques based on static analysis, we distinguish patterns for which the structure is similar by firstly identifying the roles using various metrics and their machine learning and secondly detecting patterns as struc- ture of those roles.
There is another static analysis technique that detects patterns based on the degrees of similarity between graphs of the pattern structure and graphs of the programs to be detected [3] . This technique is available to the public. However, this technique has the difficulty in distinguishing patterns that have similar structure as men- tioned above.
There is also a technique that outputs candidate patterns based on features derived from metric measurements [6] . However, it requires manual confirmation; this technique can roughly identify candidate patterns, but the final choice depends on the developer’s skill. Our technique detects patterns without manual filtering using me- trics and machine learning based on class structure analysis. Moreover, this technique uses general metrics con-

Figure 1. State pattern.

Figure 2. Strategy pattern.

Figure 3. Example of typical implementation of Singleton pattern in Java.

Figure 4. Example of specialized implementation of Singleton pattern in Java.
cerning an object-oriented system without using metrics for each role. Our technique uses metrics that specialize in each role.
Another existing technique improves precision by filtering out false hits from pattern detection results ob- tained by existing static analysis approach [7] . Although this technique is similar to our technique since both techniques utilize machine learning and require some heuristics in determining parameters such as thresholds in machine learning, the designs of entire detection processes are quite different. This technique utilizes the ma- chine learning only for filtering results obtained by another technique so that its final recall cannot exceed that of the original obtained results. On the other hand, our technique utilizes the machine learning not for filtering but for detecting patterns. Therefore, there is a possibility that our technique is superior to this technique in terms of discriminating similar patterns and detecting variety of pattern applications, as mentioned above; or at least, this technique and our technique are expected to pose different detection results.
One previous technique analyzes programs both before and after patterns are applied [8] . This method re- quires a revision history of the programs used. In contrast our technique in this paper detects patterns by analyz- ing only the current programs.
Yet another approach detects patterns from the class structure and behavior of a system after classifying its patterns [9] [10] . It is difficult to use, however, when multiple patterns are applied to a same location and when pattern application is diverse. In contrast, our technique copes well with both of these challenges.
Other detection techniques use dynamic analysis. These methods identify patterns by referring to the execu- tion path information of programs [11] [12] . However, it is difficult to analyze the entire execution path and use fragmentary class sets in an analysis. Additionally, the results of dynamic analysis depend on the representa- tiveness of the execution sequences.
Some detection techniques use a multilayered (multiphase) approach [13] [14] . Lucia et al. use a two-phase, static analysis approach [13] . This method has difficulty, however, in detecting creational and behavioral pat- terns because it analyzes pattern structures and source code level conditions. Guéhéneuc and Antoniol use DeMIMA, an approach that consists of three layers: two layers to recover an abstract model of the source code, in- cluding binary class relationships, and a third layer to identify patterns in the abstract model [14] . However, dis- tinguishing the State pattern from the Strategy pattern is difficult because their structures are almost identical. Our technique can detect patterns in all categories and distinguish the State pattern from the Strategy pattern us- ing metrics and machine learning.
Finally, one existing technique detects patterns using formal OWL (Web Ontology Language) definitions [15] . However, false negatives arise because this technique does not accommodate the diversity in pattern applications. This technique [15] is available to the public via the web as an Eclipse plug-in.
We suppress false negatives by using metrics and machine learning to accommodate diverse pattern applica- tions and to distinguish patterns in which the class structures are similar. Note that only the techniques in [3] and [15] out of those discussed above have been released as publicly accessible tools. Table 1 shows details of these publicly available tools.
3. Machine-Learning-Based Detection
The process of our technique is composed of the following five steps classified into two phases as shown in Figure 5: A learning phase and a detection phase. Each process is described below, with pattern specialists and developers included as the parties concerned. Pattern specialists are people with knowledge about the patterns. Developers are people who maintain the object-oriented software. Our technique currently uses Java as the tar- get program language.
The learning phase consists of the following steps:
・ P1. Define Patterns: Pattern specialists determine the detectable patterns and define the structures and roles composing these patterns.
・ P2. Decide Metrics: Pattern specialists determine useful metrics to judge the roles defined in P1 using the Goal Question Metric method.
・ P3. Machine Learning: Pattern specialists input programs containing patterns into the metric measurement system and obtain measurements for each role. They also input these measurements into the machine learn- ing simulator to learn. After machine learning, they verify the judgment for each role, and if the verification results are unsatisfactory, they return to P2 and revise the metrics.
The detection phase consists of the following steps:
・ P4. Candidate Role Judgment: Developers input programs to be detected into the metric measurement sys- tem and obtain measurements for each class. They then input these measurements into the machine learning simulator. The machine learning simulator identifies candidate roles.

Table 1. Details of publicly available detection tools.

Figure 5. Process of our technique.
・ P5. Pattern Detection: Developers input the candidate roles judged in P4 into the pattern detection system using the pattern structure definitions defined in P1. This system detects patterns automatically.
In the following subsections, we will explain these phases in detail.
3.1. Learning Phase
3.1.1. P1. Define Patterns
23 GoF patterns have been originally classified into three types: creational, structural and behavioral [1] . To cla- rify the usefulness of our technique for each type, we choose at least one pattern from each type: Singleton from the creational patterns, Adapter from the structural one, and, Template Method, State and Strategy from the be- havioral ones. Currently, our technique considers these five patterns and 12 roles.
3.1.2. P2. Decide Metrics
Pattern specialists decide on useful metrics to judge roles using the Goal Question Metric method [16] (hereafter, GQM). With our technique, the pattern specialists set the accurate judgment of each role as a goal. To achieve this goal they define a set of questions to be evaluated. Next, they decide on useful metrics to help answer the questions they have established. They can decide questions by paying attention to the attributes and operations of the roles by reading the description of the pattern definition.
A lack of questions might occur because GQM is qualitative. Therefore, if the machine learning results are unsatisfactory owing to the diverse values of metric measurements, it is preferable to back to P2 in order to re- consider metrics also concerning behavior. Currently such returning path is not systematically supported in our technique; in the future we will consider supporting the path by such as indicating inappropriate goals, questions and/or metrics according to the machine learning result.
For example, Figure 6 illustrates the goal of making a judgment about the AbstractClass role in the Template Method pattern. AbstractClass roles have abstract methods or methods using written logic that use abstract me- thods as shown in Figure 7. The AbstractClass role can be distinguished by the ratio of the number of abstract methods (NOAM) to the number of concrete methods (NOM) because for this role the former is supposed to exceed the latter. Therefore, NOAM and NOM are useful metrics for judging this role. All of the metrics identi- fied by using GQM for detecting roles are described in detail in Table 2 in Subsection 4.1.
3.1.3. P3. Machine Learning
Machine learning is a technique that analyzes sample data by computer and acquires useful rules with which to make forecasts about unknown data. We used machine learning so as to be able to evaluate patterns with a va- riety of application forms. Machine learning is expected to suppress false negatives and achieves extensive de- tection.
Our technique uses a neural network [17] algorithm because it outputs the values to all roles, taking into con- sideration the interdependence among the different metrics. Therefore, it can deal with cases in which one class has two or more roles.

Figure 6. Example of GQM application result (Ab- stractClass role).

Figure 7. Example of source code (AbstractClass role).
Table 2. Chosen metrics.
A neural network is composed of an input layer, hidden layers, and an output layer, as shown in Figure 8, and each layer is composed of elements called units. Values are given a weight when they move from unit to unit, and a judgment rule is acquired by changing the weights. A typical algorithm for adjusting weights is back propagation. Back propagation calculates the error margin between the output result y and the correct answer T, and it sequentially adjusts weights from the layer nearest the output to the input layer, as shown in Figure 9. These weights are adjusted until the output error margin of the network reaches a certain value.
Our technique uses a hierarchical neural network simulator [18] . This simulator uses back propagation. The hierarchy number in the neural network is set to three, the number of units in the input layer is set to the number of decided metrics, and the number of units of the output layer is set to the number of roles being judged. Re- garding the hidden layer, at this time we tentatively set the same number as that of the input layer for the sim- plicity of entire structure of the network and low memory consumptions in repeatedly conducted experiments described in the later Section 4. In the future, we will consider optimizing the number of units of the hidden layer using various information criteria [19] .
As the transfer function in the neural network, we use the sigmoid function instead of a step function since the sigmoid function is a widely accepted choice for computing continuous output in a multi-layer neural network [17] [18] .
The input consists of the metric measurements of each role in a program to which patterns have already been applied, and the output is the expected role. Pattern specialists obtain measurements for each role using the me- tric measurement system, and they input these measurements into the machine learning simulator to learn. The
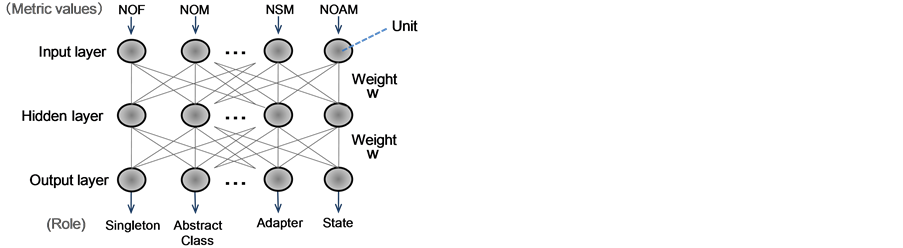
Figure 8. Overview of the neural network.

Figure 9. Back propagation.
repetition of learning ceases when the error margin curve of the simulator converges. At present, specialists ve- rify the convergence of the error margin curve manually. After machine learning they verify the judgment for each role, and if the verification results are unsatisfactory, they return to P2 and revise the metrics.
3.2. Detection Phase
3.2.1. P4. Candidate Role Judgment
Developers input programs to be detected into the metric measurement system and obtain measurements for each class, and then they input these measurements into the machine learning simulator. This simulator outputs values between 0 and 1 for all roles to be judged. The output values fare normalized such that the sum of all values becomes 1 since the sum of the output values could be different for each input in the neural network; by this normalization a common threshold can be used for comparison. The normalized output values are called role agreement values. A larger role agreement value means that the candidate role is more likely to be correct. The reciprocal of the number of roles to be detected is set as a threshold; the role agreement values that are higher than the threshold are taken to be candidate roles. The threshold is 1/12 (i.e., 0.0834) because we treat 12 roles at present.
For example, Figure 10 shows the candidate role judgment results for a class that has the following metric measurement values: NOM is 3, NOAM is 2, and other measurement values are 0. In Figure 10, the output value of AbstractClass is highest. By normalizing the values in Figure 10, the candidate roles of the class are judged as AbstractClass and Target.
3.2.2. P5. Pattern Detection
Developers input the candidate roles judged in P4 into the pattern detection system using the pattern structure definitions defined in P1. This system detects patterns by matching the direction of the relations between candi- date roles in the programs and the roles of patterns. The matching moves sequentially from the candidate role with the highest role agreement value to that with the lowest value; the system searches all combinations of can- didate roles that are in agreement with the pattern structures. And if the directions of relations between candidate

Figure 10. Example of machine learning output.
roles are in agreement with the pattern structure and when the candidate roles are in agreement with the roles at both ends of the relations, the system detects the pattern.
Currently, our method deals with inheritance, interface implementation, and aggregation relations. To clarify the difference of these relation types, we introduce the relation agreement value reflecting the difference. The relation agreement value is 1.0 when the type and direction of the target relation agrees with the relation of the pattern, and is 0.5 when only the direction agrees2. If the direction does not agree, the relation agreement value becomes 0.
The pattern agreement value is calculated from the role agreement values and relation agreement values. The pattern to be detected is denoted as P, the role set that composes the pattern is denoted as R, and the relation set is denoted as E. Moreover, the program that is the target of detection is denoted as P', the set of classes com- prising the candidate roles is R', and the set of relations between the elements of R' is denoted as E'. The role agreement value is denoted as Role, and the relation agreement is denoted as Rel. Role refers to the function into which the element of R and the one of R' are input. Rel refers to the function into which the element of E and the one of E' are input. The product of the average of the two roles at both ends of the relation and Rel is denoted as Com, and the average of Com is denoted as Pat. Pat and Role take normalized values from 0 to 1. These values are defined and calculated as follows.
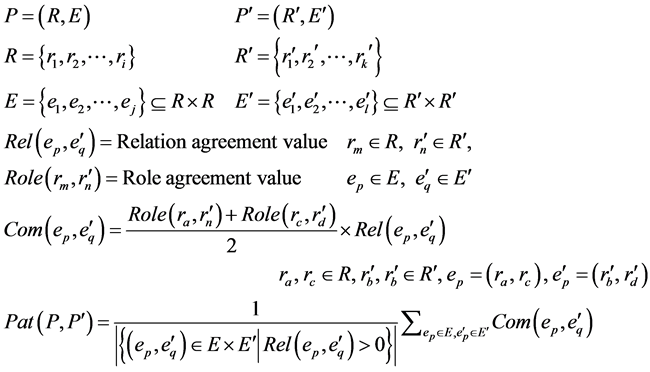
Figure 11 shows an example of detecting the Template Method pattern. It is assumed that class SampleA has the highest role agreement value for AbstractClass. The pattern agreement value between the program samples and the Template Method pattern is calculated as follows.

Figure 11. Example of detecting Template Method pattern.

In this example, the pattern agreement value of the Template Method pattern was calculated to be 0.492. Our technique uses the same threshold of pattern agreement value as that of the role agreement value because the pattern agreement value is basically calculated by summarizing the role agreement values. Finally, classes with a pattern agreement value that exceeds the threshold are output as the detection result.
In Figure 11, the pair SampleA and SampleB, and another pair SampleA and SampleC can be considered to match the Template Method pattern. In this case, the relation “SampleA  SampleB” is more similar to the Template Method pattern than the relation “SampleA
  SampleC” because the relation agreement value of the former pair is 0.635 while that of the latter pair is only 0.348.
4. Evaluation and Discussion
We evaluated the detection accuracy of our technique by using many programs where patterns have been ap- plied. Moreover, we compared our technique with two conventional techniques. Through these experiments we confirmed that our technique is superior in terms of detecting patterns with similar structures and diverse pat- terns.
4.1. Verification of Candidate Role Judgment
We conducted cross-validation to verify the accuracy of the candidate role judgment. In cross-validation, data are divided into n groups, and a test to verify a candidate role judgment is executed such that the testing data are one data group and the learning data are n-1 data groups. We executed the test five times by dividing the data into five groups.
In this paper, programs such as those in Reference [20] are called small-scale programs, whereas programs in practical use are called large-scale programs. We used a set of programs where patterns are applied in small- scale programs (60 pattern instances in total) [20] [21] and large-scale programs (158 in total from Java library 1.6.0_13 [22] , JUnit 4.5 [23] , and Spring Framework 2.5 RC2 [24] ) as experimental data. We manually and qua- litatively judged whether the patterns were appropriately applied in this set of programs.
Table 2 shows the metrics that were chosen for the small-scale programs. We used the same set of metrics for the large-scale programs without NMGI. It is because NMGI is expected to be suitable for identifying the typi- cal implementation of ConcreteState role in the State pattern that generates other ConcreteState roles; however, in real (non-sample) large scale programs, applications of the State pattern are more complex so that NMGI could introduce negative effects regarding State pattern detection.

We focused our attention on recall because the purpose of our technique was detection covering diverse pat- tern applications. Recall indicates the degree to which detection results are free of leakage, whereas precision shows how free of disagreement these results are. The data in Table 3 were used to calculate recall. wr, xr, yr, and zr are numbers of roles, and wp, xp, yp, and zp are numbers of patterns. Recall was calculated from the data in Table 3 using the following expression.
Table 3. Intersection procession.
Recall of candidate role judgment:

Table 4 shows the average recall for each role. Regarding the State pattern and Strategy pattern, we evaluate that our technique successfully judges candidate roles if the role agreement value is above the threshold and the both patterns are distinguished in judgment results; regarding the patterns other than the State pattern and Strate- gy pattern, we simply evaluate that our technique successfully judges candidate roles if the role agreement value is above the threshold.
As shown in Table 4, the recalls for the large-scale programs are lower than those for the small-scale pro- grams. Accurate judgment of large-scale programs is more difficult because these programs contain attributes and operations that are not related to pattern application. Therefore, it will be necessary to collect a significant amount of learning data to adequately cover a variety of large-scale programs.
In Table 4, regarding the State pattern for large-scale programs, the Context role has high recall although the State and ConcreteState roles have very low recalls. Therefore, the State pattern can be distinguished from the Strategy pattern by initiating searching from the Context role in P5.
4.2. Pattern Detection Results
We evaluated the detection accuracy of our technique by detecting patterns using test data in both the small- scale and large-scale programs. We used 40 sets of pattern instances (i.e. pattern application parts) in small-scale programs (out of 60 mentioned in Subsection 4.1) and 126 sets of pattern instances in large-scale programs (out of 158) as learning data. After the machine learning, we tried to detect patterns from the rest of the small-scale programs containing 20 pattern instances and the large-scale programs containing 32 pattern instances.
We manually and qualitatively judged whether the patterns were appropriately applied in the detection results. Table 5 shows the precision and recall of the detected patterns. Precision and recall were calculated from the data in Table 3 by the following expressions:
Table 5 shows holistically that our technique suppresses false negatives because the recall is high.
Targeting Singleton, State, and Strategy patterns, small-scale and large-scale programs shared a common fea- ture in that they both had recalls that were higher than precisions; recall was 100% for the small-scale programs, but it dropped to as low as around 80% - 100% for the large-scale programs. It is mainly due to the fact that the
Table 4. Recall of candidate role judgment (average).
Table 5. Precision and recall of pattern detection.
recall of the candidate role judgment for the large-scale programs is low; the final accuracy of pattern detection in our technique depends on the accuracy of role judgment.
Recalls of the State pattern and the Strategy pattern are higher than recalls of the candidate role judgment of these patterns’ roles. It is because in Table 4 we evaluate that our technique successfully judges candidate roles if the role agreement value is above the threshold and the both patterns are distinguished in judgment results (as mentioned in 4.1). Therefore targeting a same class, a role assignment value for the State (or Strategy) pattern could be higher than the threshold even if the value is lower than a role assignment value for the Strategy (or State) pattern. In that case the State (or Strategy) pattern might be detected in a structure containing that class.
The large-scale programs resulted in low recall especially for the Templated Method and Adapter patterns. Table 4 shows the reason: The recalls of the candidate role judgment for these patterns were low.
4.3. Comparison with Conventional Detection Techniques
Under the same setting of Subsection 4.2, we experimentally compared our technique with conventional detec- tion techniques [4] [15] . These conventional techniques have been publicly released, and they consider three or more patterns addressed by our technique. Both target Java programs, as does our technique. The technique proposed by Tsantalis et al. [4] (hereafter, TSAN) has four patterns in common with our technique (Singleton, Template Method, Adapter, and State/Strategy). Because TSAN cannot distinguish the State pattern from the Strategy pattern, State and Strategy are detected as the same pattern. Dietrich and Elgar’s technique [15] (he- reafter, DIET) has three patterns in common (Singleton, Template Method, and Adapter) with our technique. TSAN detects patterns based on the degree of similarity between the graphs of the pattern structure and those of the programs to be detected, whereas DIET detects patterns by using formal OWL definitions.
Based on the machine learning using the 126 (or 40) sets of pattern instances in the large-scale programs (or in the small-scale programs), our technique detected a number of patterns from the test data consisting of 32 (or 20) pattern instances; the detection results can be ranked in order of their pattern agreement values shown in Table 6. In Table 6, we manually and qualitatively judged whether each detected result is really an application result of the corresponding pattern, denoted as “Correct”.
On the other hand, TSAN and DIET detect patterns without any indication of accuracy or certainty for each detection result. Therefore when plotting results in the form of precision-recall graph, we alternately plotted re- sults because these conventional detection techniques do not output a value that can be ranked; we assumed that false negatives would appear fairly from the begging like shown in Table 7.
Figure 12 shows the recall-precision graphs for our technique and TSAN, and Figure 13 shows the corres- ponding graphs for our technique and DIET. We ranked the detection results of our technique with the pattern agreement values. Next, we calculated recall and precision according to the ranking and plotted them. Recall and precision were calculated from the data in Table 3 using the expressions in Subsection 4.2. In the recall and pre- cision graphs, higher values are better.
In Figure 12 and Figure 13, many of techniques except for DIET show better recall and precision when the small-scale programs are examined than the large-scale programs. This is because small-scale programs do not include unnecessary attributes and operations in the composition of patterns.
Our technique is superior to conventional techniques because the curves in Figure 12 and Figure 13 for our technique are above those for the conventional techniques.
Table 6. Ranked detection results for large-scale programs by our technique (excerpt).
Table 7. Detection results for large-scale programs by TSAN (excerpt).

Figure 12. Recall-precision graph (vs. TSAN).
Table 8 and Table 9 respectively show the average of the F measure for each plot in Figure 12 and Figure 13. The F measure is calculated from the recall and precision as follows.


Figure 13. Recall-precision graph (vs. DIET).
Table 8. Average of F measure (vs. TSAN).
Table 9. Average of F measure (vs. DIET).
A large F measure means higher accuracy, and these tables show that our technique gives a larger F measure than the conventional techniques.
In the following, we discuss in detail the usefulness of our technique compared with conventional techniques in detail by considering two cases: (c1) and (c2).
(c1) Distinction between State pattern and Strategy pattern:
Our technique distinguished the State pattern from the Strategy pattern. Table 10 is an excerpt of the metric measurements for the Context role in the State pattern and Strategy pattern regarding large-scale programs in which the both patterns were distinguished by the experiment. The State pattern treats the states in a State role and treats the actions of the states in the Context role. The Strategy pattern encapsulates the processing of each algorithm into a Strategy role, and the Context processing becomes simpler compared with that of the State pattern.
Table 10 shows 45 fields and 204 methods as the largest measurement values for the Context roles of State
Table 10. Metric measurements for the Context roles.
pattern (18 and 31 respectively for the Context roles of Strategy pattern). Therefore, the complexity of the Con- text role of both patterns appears in the number of fields (NOF) and the number of methods (NOM), and these are distinguishing elements. This observation seems to be reasonable since NOM and NOF are found to be im- portant metrics in Table 10. Figure 12 shows that our technique is particularly good because the State pattern and Strategy pattern could not be distinguished with TSAN.
(c2) Detection of variations of patterns:
Figure 13 shows that the recall of DIET is low for large-scale programs because DIET does not accommodate sufficient diversity in pattern applications; large-scale programs tend to contain many attributes and operations that are not directly connected to pattern roles.
Our technique detected variations (i.e. subspecies) of patterns. For example, the conventional techniques and our technique can detect the Singleton pattern in the general implementations shown in Figure 3.
However, regarding specialized implementation using a boolean variable, as shown in Figure 4, the Singleton pattern was not detected by TSAN or DIET. On the other hand, our technique successfully detected the Single- ton pattern for the same target. Unlike the conventional techniques, our technique is affected by false positives because it involves a gradual detection using metrics and machine learning instead of strict conditions; however, false positives of the Singleton pattern particularly stood out because the Singleton pattern is composed of only one role. It will be necessary to use metrics that are specialized to one or a few roles to make judgments about patterns composed of one role such as the Singleton pattern (P4).
5. Evaluation and Discussion
We devised a pattern detection technique using metrics and machine learning. Candidate roles are judged using machine learning that relies on measured metrics, and patterns are detected from the relations between classes. We worked on problems associated with overlooking patterns and distinguishing patterns in which the class structures are similar. We demonstrated that our technique was superior to two conventional detection techniques by experimentally distinguishing patterns in which the class structures are similar. Moreover, variations of patterns were detected, enabling us to deal with a very diverse set of pattern applications. However, our tech- nique was more susceptible to false positives because it does not use strict conditions such as those used by the conventional techniques.
As our future work, we plan to add more patterns that can be detected. Our technique can currently cope with five patterns. However, we predict it will be possible to detect other patterns if we can decide upon metrics to identify them. It is also necessary to collect more learning data to cover the diversity in pattern applications. Moreover, we plan to more narrowly adapt the metrics to each role by returning to step P2 because results might depend on the data. This process would lead to enhanced recall and precision. In relation to that, we also plan to prove the validity of the expressions and the parameters of agreement values and thresholds. We consider that it is possible to reduce the false positive rate by deciding on the optimum thresholds for role agreement values and pattern agreement values.
References
- Gamma, E., Helm, R., Johnson, R. and Vlissides, J. (1994) Design Patterns: Elements of Reusable Object-Oriented Software. Addison-Wesley, Boston.
- Lorenz, M. and Kidd, J. (1994) Object-Oriented Software Metrics. Prentice Hall, Upper Saddle River.
- Uchiyama, S., Kubo, A., Washizaki, H. and Fukazawa, Y. (2011) Design Pattern Detection Using Software Metrics and Machine Learning. Proceedings of the 5th International Workshop on Software Quality and Maintainability, Ol- denburg, 1 March 2011, 38-47.
- Tsantalis, N., Chatzigeorgiou, A., Stephanides, G. and Halkidis, S. (2006) Design Pattern Detection Using Similarity Scoring. IEEE Transactions on Software Engineering, 32, 896-909. http://dx.doi.org/10.1109/TSE.2006.112
- Blewitt, A., Bundy, A. and Stark, L. (2005) Automatic Verification of Design Patterns in Java. Proceedings of the 20th International Conference on Automated Software Engineering, Long Beach, 7-11 November 2005, 224-232.
- Kim, H. and Boldyreff, C. (2000) A Method to Recover Design Patterns Using Software Product Metrics. In: Proceedings of the 6th International Conference on Software Reuse: Advances in Software Reusability, Vienna, 27-29 June 2000, 318-335.
- Ferenc, R., Beszedes, A., Fulop, L. and Lele, J. (2005) Design Pattern Mining Enhanced by Machine Learning. Proceedings of the 21st IEEE International Conference on Software Maintenance, Budapest, 26-29 September 2005, 295- 304. http://dx.doi.org/10.1109/ICSM.2005.40
- Washizaki, H., Fukaya, K., Kubo, A. and Fukazawa, Y. (2009) Detecting Design Patterns Using Source Code of before Applying Design Patterns. In: Proceedings of the 8th IEEE/ACIS International Conference on Computer and Informa- tion Science, Shanghai, 1-3 June 2009, 933-938.
- Shi, N. and Olsson, R.A. (2006) Reverse Engineering of Design Patterns from Java Source Code. In: Proceedings of the 21st IEEE/ACM International Conference on Automated Software Engineering, Tokyo, 18-22 September 2006, 123-134. http://dx.doi.org/10.1109/ASE.2006.57
- Lee, H., Youn, H. and Lee, S. (2007) Automatic Detection of Design Pattern for Reverse Engineering. In: Proceedings of the 5th ACIS International Conference on Software Engineering Research, Management and Applications, Busan, 20-22 August 2007, 577-583.
- Wendehals, L. and Orso, A. (2006) Recognizing Behavioral Patterns at Runtime Using Finite Automata. Proceedings of the 4th ICSE 2006 Workshop on Dynamic Analysis, Shanghai, 26 May 2006, 33-40. http://dx.doi.org/10.1145/1138912.1138920
- Hayashi, S., Katada, J., Sakamoto, R., Kobayashi, T. and Saeki, M. (2008) Design Pattern Detection by Using Meta Patterns. IEICE Transactions on Information and Systems, 91-D, 933-944. http://dx.doi.org/10.1093/ietisy/e91-d.4.933
- Lucia, A., Deufemia, V., Gravino, C. and Risi, M. (2009) Design Pattern Recovery through Visual Language Parsing and Source Code Analysis. Journal of Systems and Software, 82, 1177-1193. http://dx.doi.org/10.1016/j.jss.2009.02.012
- Guéhéneuc, Y. and Antoniol, G. (2008) DeMIMA: A Multilayered Approach for Design Pattern Identification. IEEE Transactions on Software Engineering, 34, 667-684. http://dx.doi.org/10.1109/TSE.2008.48
- Dietrich, J. and Elgar, C. (2007) Towards a Web of Patterns. Journal of Web Semantics, 5, 108-116. http://dx.doi.org/10.1016/j.websem.2006.11.007
- Basili, V.R. and Weiss, D.M. (1984) A Methodology for Collecting Valid Software Engineering Data. IEEE Transactions on Software Engineering, 10, 728-738. http://dx.doi.org/10.1109/TSE.1984.5010301
- Segaran, T. (2007) Programming Collective Intelligence. O’Reilly, Sebastopol.
- Hirano, H. (2008) Neural Network Implemented with C++ and Java. Personal Media, Tokyo.
- Kurita, T. (1990) Deciding Unit Number of Hidden Layer in Three-Layer-Neural Network by Using Information Crite- ria. IEICE Transactions on Information and Systems, 73, 1872-1878.
- Yuki, H. (2014) An Introduction to Design Patterns to Study by Java. http://www.hyuki.com/dp/
- Tanaka, H. (2010) Hello World with Java! http://web.archive.org/web/20100808072152/
- Oracle. Oracle Technology Network for Java Developers. http://www.oracle.com/technetwork/java/index.html
- JUnit.org. Resources for Test Driven Development. http://www.junit.org/
- SpringSource.org. Spring Source. http://www.springsource.org/
NOTES

1Preliminary result of our technique was reported in [3] .

2If we use 0 as the relation agreement value when the direction agrees but the type of relation does not agree, the pattern agreement value might become 0; these classes will not be detected as patterns. In such cases, a problem similar to those in conventional techniques utilizing strict conditions will occur because the difference in the type of relation is not recognized.