Journal of Software Engineering and Applications
Vol.6 No.4(2013), Article ID:30235,6 pages DOI:10.4236/jsea.2013.64021
Jpowder Version 2: For the Display and Examination of Powder Diffraction Data Using Stack Plot
![]()
1Faculty of Computer and Technology, Kasem Bundit University, Bangkok, Thailand; 2City University of London, London, UK; 3STFC Rutherford Appleton Laboratory, Didcot, UK.
Email: Kreecha_pu@yahoo.com, anders.markvardsen@stfc.ac.uk
Copyright © 2013 Kreecha Puphaiboon et al. This is an open access article distributed under the Creative Commons Attribution License, which permits unrestricted use, distribution, and reproduction in any medium, provided the original work is properly cited.
Received January 19th, 2013; revised February 22nd, 2013; accepted March 2nd, 2013
Keywords: Powder Diffraction Data; Java; Open Source
ABSTRACT
The ability to display and inspect powder diffraction data quickly and efficiently is a central part of the data analysis process. Whilst many computer programs are capable of displaying powder data, their focus is typically on structure solution. The research proposes a lightweight powder diffraction visualization program with the capability of fast rendering to compare powder data sets. Based on the success of the earlier version and user requests, Jpowder has been extended to display powder diffraction datasets using stack plot, which options to use meta-data for crystallographic powder diffraction data in XML format. Such stack plots allows crystallographers to identify phase transitions in materials.
1. Introduction
Crystallography is applied in all areas of material science, including metals, ceramics, polymers and drug design. It is vital to progress in fundamental physics and chemistry to understand the dynamics and processes of living systems. “Crystallography can be regarded as a small dukedom primarily engaged in the analysis of crystal structures (atomic, magnetic, nuclear) and their dependence on external parameters such as temperature, pressure, composition, electric and magnetic fields” [1]. Analysis of two and three dimensional crystal structures is a source of difficulty for many scientists in Crystallography. Physical models and analysis of crystal structures have been used to help scientists better visualize the complex arrangements of atoms within materials [2]. With the advanced of newer computational and graphics technology, researchers believe that the full potential of crystal structure databases and visualization software for enhancing the analysis of Crystallography is required [3]. Mostly, existing software for plotting Crystallography data has been lacked of interactive display for straightforward visualization and comparison of powder diffraction data sets [4].
In addition, the capability to plot series of powder datasets using stack plot (with additional informationmetadata) to enhance the visualization techniques has been requested by researchers [5]. The benefits of adding and manipulating with additional data (metadata) to datasets can enhance scientists to perform faster comparison of powder diffraction data sets.
This paper presents a simple, lightweight, easy-to-access program (Jpowder) for fast visualization and the largest task has been to extend Jpowder to plot stack plot with metadata. Jpowder stack plot uses Java technology to run on all platforms without the need to go through complicated operating system installation procedures. The application has been implemented together with new tools for manipulation such charts using stack graph and XML file format. The free Java libraries, which are used by Jpowder stack plot are the open source libraries JFreeChart [6], JXLayer [7] and iText [8]. The software was specifically developed to solve the problems that exist in Crystallography data where specific tool and hardware required by researchers who merely want to analyse plain crystallographic information.
2. Related Work
Many computer programs are capable of displaying powder diffraction data, often as the logical outcome of an analysis step such as a Rietveld refinement. Such programs include, for examples, TOPAS [9], FOX [10], HighScore [11], Endeavour [3], DASH [12], FullProf_ Suite [13], GSAS [14], EXPO2009 [15], JANA2006 [16], EVA [17], PowderX [18] and Powderstack plot [19]. However, such software packages are designed mainly for analysis of diffraction data (e.g. structure solution, quantitative phase analysis and indexing). In previous paper [4], Jpowder exhibits a simple, lightweight, easy-toaccess program for straightforward visualization and comparison of powder diffraction data sets. Jpowder supports drag and drop feature which has helps users to plot quickly: multiple files from multiple folders can be selected simultaneously and plot at once.
The data are visualized in multiple modal windows, also referred to as plot windows. Plots may be manipulated using the mouse. For example, by moving, rescaling and changing the appearance of plots. Charts can be exported in various ways, including using the “PDF for publication” option. Jpowder also includes tools for basic data analysis tasks, including, for example, selecting peaks to a peak list, which can subsequently be exported to an indexing program such as DICVOL [20], and a tool for switching X axes between 2θ and d spacing to aid comparison of data sets collected at different wavelengths. This feature can be used to publish powder data not only as static images but also as interactive applications that offer the same manipulation options as a Jpowder chart; see, for example, http://www.jpowder.org/JpowderApplet.html.
However, stack plot visualization handling was requested by users [5] to extend new options to improve Crystallography by providing meta-data for powder diffraction data in XML format so that the user can easily edit data in a text editor of their choice. Moreover, color scale representations were requested to highlight different intensity of wavelength which will be discussed in the next section.
3. Stack Plot
3.1. Jpowder Stack Plot: Metadata and Its XML
In the plotting area of Jpowder two tabs have been added as highlighted in Figure 1: 2D and 3D tabs.
Clicking on the 2D Plots tab keeps the functionality for plotting data 2D as was presented with the release of Jpowder Version 1 [4]. Selecting the 3D Plots (stack plot) tab allows the user to plot data from multiple files. Stack plot with metadata (additional information) could be the temperature and pressure or the time at which data were collected and specified by users. This can be saved in the data file upon the user. The scientific case for allowing stack plot plotting and specific data type are: 1) to enable a series of powder diffraction datasets with different meta information to be plotted such that changes in the
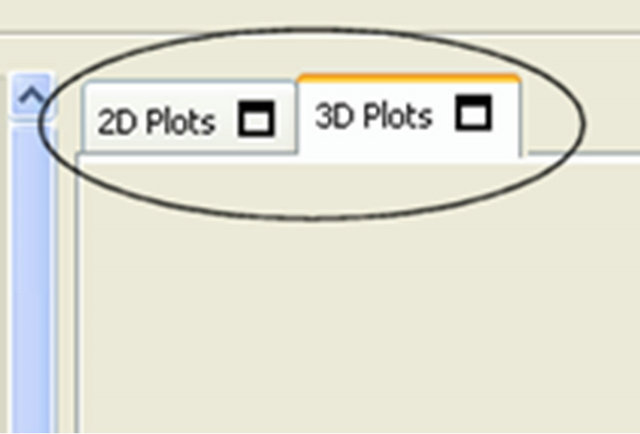
Figure 1. 2D and stack plot tabs.
datasets can be visually easily identified; and 2) to enhance data type safe for correctness and efficiency of the program [21].
To initiate the generation of a stack plot, the user can drag and drop files from a file explorer of the operating system, or from the file explorer build into Jpowder, into the stack plot area. This will open a window entitled “Prepare stack Plot”, which allows the user to adjust the order of datasets listed in the log table, and add meta data information and select the meta data to plot the datasets as an output.
The default option is to plot the datasets as a function of “name”, that is the filename of the individual datasets will be displayed on the Y axis. This generates a stack plot where the datasets are stacked on top of each other as demonstrated in Figure 2 where the bottom horizontal gradient color strip plots the first dataset at the top depending on the sorting preference user selected. Lines and colors relationships portray the different temperatures of each datasets.
Metadata can be added by clicking on the “Add Column” button, which will pop up a small window where the user can specify the name of the meta data, for example, temperature or the date-and-time when datasets were collected, and a new column is added where either numbers or labels (strings) can be entered. Figure 3 demonstrates an example where two such columns have been added.
If any of fields of a column contain a string, as for example for the pressure column in Figure 3, then all entries in the column are treated as labels and values are displayed on the Y axis (see Figure 4).
To avoid having the user having to retype metadata the “Prepare stack Plot” input dialog (Figure 3) has two buttons “Load Meta File” and “Save Meta File”. An example of a XML meta file output is shown below:
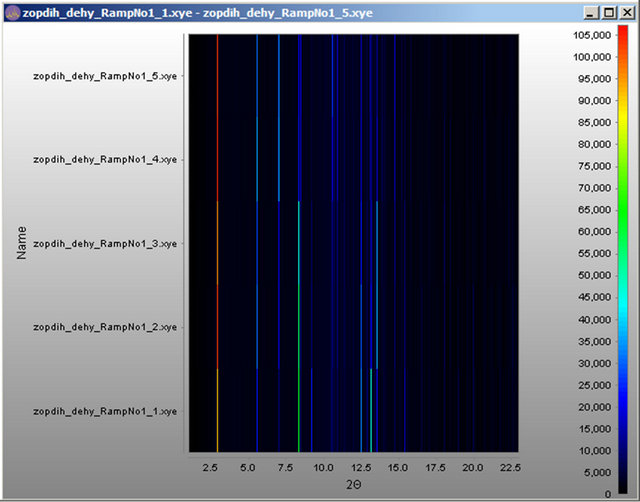
Figure 2. Name plot.
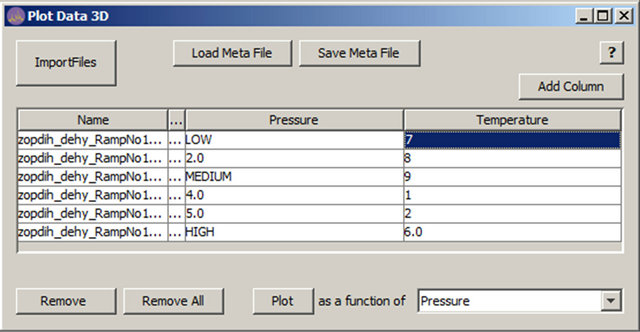
Figure 3. Plot metadata input.
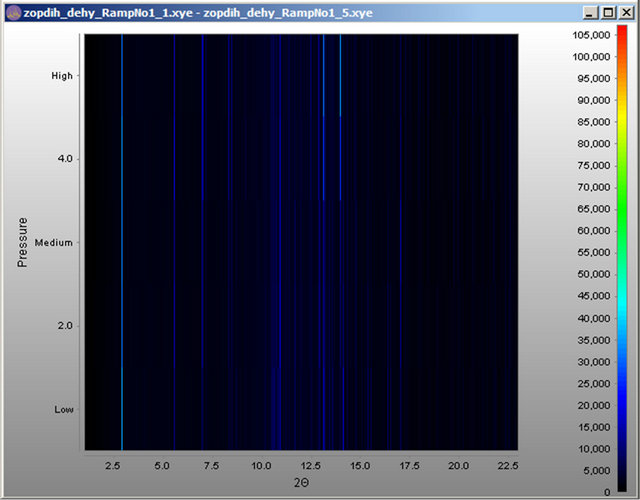
Figure 4. Plot metadata.
This is our default XML metadata format which users even can modify and adjust details later. The changes of the XML will not impact the original powder file. In addition, the application has provided the ability to output all visible atoms to a XML file. Hence, Jpowder also accepts the following metadata format:
Name Temparature Pressure Path
Data1.xye 10 50 C:\AA...
Data2.xye 20 40 C:\AA...
Data3.xye 40 10 C:\AA...
Data4.xye 100 1 C:\AA...
Moreover, an advantage of using XML is that a user may insert anywhere comments in the file using the notation . Jpowder looks to see if the following XML tags are present:
Note dragging a XML meta file directly into Jpowder will generate a stack plot as specified in the meta file.
3.2. The XML Format Holds Metadata for a Collection of Powder Diffraction Files, Which Collectively Tells a Story about how a Material(s) Have Changed with Changes in Metadata Information. The Proposed XML Formats Hold This Key Information in a Compact, Adjustable and Easily Displayable Way. Jpowder Other Tools
In association with allowing stack plot plotting, Jpowder, has been fitted with a new set of tools for manipulating such stack plot. Firstly, grey scale and colour bars, which allow users to select different plotting colours and orientations to help visualising datasets and see intesity levels of datasets. Secondly, Y axis displays the temperature of each datasets using the plot. It plots each dataset on top of each other regardless of their Y axis values. Thirdly, smoothing allows users to emphasize the largest peaks features and transition of peak points to appear clearly when needed. Fourthly, transform X axis tool uses supplied wavelength information to convert 2D into spacing and vice versa. It assumes that the data were collected at constant wavelength and therefore currently does not support time-of-flight data. Fifthly, annotation allows the users to comment or remark on particular dataset and point. Lastly, binning helps to reduce the large amount of data and plotting without losing important information.
The above features are added as part of improve visualization when comparing powder datasets and allow adjustments prior to presentations in other media.
3.3. Supported File Formats
The file formats which are supported for this version of Jpowder are:
• XY-format (.xy): Two-column ASCII format, where the data in the 1st column are assumed to be the diffraction angle in 2θ and those in the 2nd column are X-ray or neutron counts.
• XYE-format (.xye): As for XY-format, but with an additional column listing the estimated standard deviations for the counts. This format also supports the use of a single real number, specifying a wavelength, as the first line of the file.
• CIF-format. The Crystallographic Information File format is described in detail at www.iucr.org/resources/cif.
• ISIS GSAS-format: At the STFC ISIS Facility, GSAS is frequently used to refine structures against time-offlight neutron powder data. The current version of Jpowder requires such data to be in what the GSAS manual refers to as “RALF/FXYE format”. When reading such a time-of-flight. gss file, the X-values are assumed to be in given in units of micro-seconds.
Jpowder attempts to read files with extensions. gss and. cif as ISIS GSAS-format and CIF-format files respectively. For files with any other extension, Jpowder will attempt to read the file in XYor XYE-format. All data are assumed to be constant wavelength data with the exception of data using the ISIS GSAS-format. The Jpowder code is Open Source and structured in such a way that it is straightforward for anyone used to Java programming to extend the list of supported file types.
4. Software and Hardware Environment
One of the important features is the platform independence of Java programs, because it allows the exchange of software between several research groups very easily [22]. Jpowder will run on any PC that supports a Java Runtime Environment (JRE). Specifically, version 1.6 or higher is required for the version of JPowder described in this paper; however, if a JRE version older than 1.6 (i.e. older than Dec. 11th, 2006) is installed on the local machine, the user is directed to the JRE update web page.
5. Discussion and Conclusion
In this work, we provide stack plot visualization features focusing on the ability to display and inspect powder diffraction data quickly and efficiently. Manipulation of data gives the researcher a clearer understanding to the nature of the data. Plotting multiple datasets at once provides the convenient and time-saving to scientists. Metadata manipulation without impacting original Crystallography file can be used for visualising Crystallography data via XML file. The final objective was to have a very easy-to-use application, available freely to all Crystallography researchers. Jpowder allows the user to choose multiple Crystallography file types and what to plot for both 2D and stack plot. The user can also easily zoom in different regions of the plot, change axis or transform datasets with metadata. The production of graphs and surface rendering were not our priority, as other tools. However, improving the quality, performance and create new options to manipulate the aspect of datasets via visual representation is a prominent direction for future improvement of Jpowder.
6. Documentation and Availability
The code is licensed under the GNU General Public License v3.
Jpowder stack plot is downloadable from: http://code.google.com/p/jpowder/downloads/list. Bugs can be reported via http://code.google.com/p/jpowder/issues. The Jpowder discussion group at: http://groups.google.com/group/jpowder provides a forum for the discussion of Jpowder-related issues, such as feature requests.
Developers can download code to help developing Jpowder via:
http://code.google.com/p/jpowder/wiki/ForDevelopers.
7. Acknowledgements
KP gratefully acknowledges the support of Department of Computer Science at Kasem Bandit University. The authors are very grateful to Tom & Hannah Griffin for continued support of this project. In the early code design discussion of adding the stack plot plotting we will like to acknowledge the input of Kenneth Shankland and Sri Kanth Nagella. We also acknowledge Bill David, Matt Tucker and Stephen Hall (and others) for independently, during the testing of the first release of Jpowder, suggest the usefulness of adding stack plot plotting into Jpowder.
REFERENCES
- K. Yvon, “Personal Opinions,” Zeitschrift Fur Kristallographie, Vol. 217, No. 7-8, 2002, pp. 380-382. doi:10.1524/zkri.217.7.380.23670
- C. Bajaj and P. Djeu, “Texmol: Interactive Visual Exploration of Large Flexible Multi-Component Molecular Complexes,” In: Proceedings of the Conference on Visualization ’04, IEEE Computer Society Press, Texas, 2004, pp. 243-250.
- H. Putz, J. C. Schön and M. Jansen, “Combined Method for ab Initio Structure Solution from Powder Diffraction Data,” Journal of Applied Crystallography, Vol. 32, 1999, pp. 864-870. doi:10.1107/S0021889899006615
- A. J. Markvardsen, K. Puphaiboon, M. Arjeneh, K. Shankland, H. L. Guest, T. A. N. Griffin, D. R. Badham and D. W. Flannery, “Jpowder: A Java-Based Program for the Display and Examination of Powder Diffraction Data,” Journal of Applied Crystallography, Vol. 43, 2010, pp. 1532-1534. doi:10.1107/S0021889810041543
- Jpowder, 2012. http://code.google.com/p/jpowder/issues/list
- http://www.jfree.org/jfreechart
- http://jxlayer.dev.java.net
- http://itextpdf.com
- A. Coelho, “TOPAS User Manual,” Version 3.1., Bruker AXS GmbH, Karlsruhe, 2003.
- V. Favre-Nicolin and R. Cerný, “FOX, Free Objects for Crystallography’: A Modular Approach to ab Initio Structure Determination from Powder Diffraction,” Journal of Applied Crystallography, Vol. 35, 2002, pp. 734- 743. doi:10.1107/S0021889802015236
- Highscore, 2010. http://www.panalytical.com
- W. David, K. Shankland, J. van de Streek, E. Pidcock, W. Motherwell and J. Cole, “DASH: A Program for Crystal Structure Determination from Powder Diffraction Data,” Journal of Applied Crystallography, Vol. 39, 2006, pp. 910-915. doi:10.1107/S0021889806042117
- J. Rodriguez-Carvajal, “Recent Advances in Magnetic Structure Determination by Neutron Powder Diffraction,” Physica B, Vol. 192, No. 1-2, 1993, pp. 55-69. doi:10.1016/0921-4526(93)90108-I
- C. Larson and B. Von Dreele, “GSAS,” Report LAUR, Los Alamos National Laboratory, New Mexico, 1994, pp. 786-748.
- A. Altomare, M. Camalli, C. Cuocci, C. Giacovazzo, A. Moliterni and R. Rizzi, “EXPO2009: Structure Solution by Powder Data in Direct and Reciprocal Space,” Journal of Applied Crystallography, Vol. 42, 2009, pp. 1197-1202. doi:10.1107/S0021889809042915
- V. Petricek, M. Dusek and L. Palatinus, “The Crystallographic Computing System,” Institute of Physics, Praha, 2006.
- EVA, 2013. http://www.bruker.com/en/products/x-ray-diffraction-and-elemental-analysis/x-ray-diffraction/xrd-software/applications/xrd-software-applications/eva.htm.
- C. Dong, “PowderX: Windows-95-Based Program for Powder X-Ray Diffraction Data Processing,” Journal of Applied Crystallography, Vol. 32, 1999, p. 838. doi:10.1107/S0021889899003039
- Powderstack Plot, 2013. http://www2.fkf.mpg.de/xray/html/powderstack plot.html
- A. Boultif and D. Louer, “Powder Pattern Indexing with the Dichotomy Method,” Journal of Applied Crystallography, Vol. 37, 2004, pp. 724-731. doi:10.1107/S0021889804014876
- B. Strousrup, “Software Development for Infrastructure,” Computer, Vol. 45, No. 1, 2012, pp. 47-58. doi:10.1109/MC.2011.353
- P. Knoll and S. Mirzaei, “Scientific Computing with Java,” Computer Applications in Engineering Education, Vol. 18, No. 3, 2010, pp. 495-501.