Journal of Biomedical Science and Engineering
Vol.10 No.05(2017), Article ID:76217,13 pages
10.4236/jbise.2017.105017
Microfluidic Extreme PCR: <1 Minute DNA Amplification in a Thin Film Disposable
James M. Trauba, Carl T. Wittwer
Department of Pathology, University of Utah School of Medicine, Salt Lake City, UT, USA

Copyright © 2017 by authors and Scientific Research Publishing Inc.
This work is licensed under the Creative Commons Attribution International License (CC BY 4.0).
http://creativecommons.org/licenses/by/4.0/


Received: March 25, 2017; Accepted: May 15, 2017; Published: May 18, 2017
ABSTRACT
Point-of-care diagnostic testing using PCR requires a device that is fast, economical, and practical. Sub-minute amplification has been demonstrated using high concentrations of primers and polymerase in glass capillaries, but its platform is limited to research use. A system using heated copper blocks to clamp a microfluidic flow-through PCR card fabricated from thin film polycarbonate was modeled, fabricated, and tested. Models show that fluid flowing through a thin-film device clamped between temperature-controlled copper blocks equilibrates to a temperature change in 250 milliseconds. A 2-step, 35 cycle PCR with 1.06 second cycles specifically amplified a 69-base pair fragment from a 450-base pair synthetic DNA template of random sequence with the same performance as the glass capillary system. This system demonstrates the feasibility of <1 minute PCR in an inexpensive, disposable sample container.
Keywords:
PCR, Microfluidics, Diagnostics, Point-of-Care

1. Introduction
Polymerase Chain Reaction (PCR), an inexpensive and robust technique for amplifying specific segments of DNA [1] , is already central to molecular diagnostics and will continue to play a role in up-and-coming fields such as precision medicine and point-of-care (POC) testing. Commercial use of PCR in these fields will hinge upon the convenience of using the instrumentation, time to result, and other factors.
How fast PCR can be performed is largely determined by the time required to cycle through three temperature-sensitive steps: DNA denaturation, primer annealing, and polymerase extension. Much has been done to reduce PCR cycle time. Recently, extreme speeds (0.4 to 2.0 seconds per cycle) were demonstrated using high primer and polymerase concentration reactions contained in thin glass capillary tubes that were alternately submerged in temperature-controlled water baths [2] . PCR on this system amplified segments of DNA with greater than 90% efficiency and without loss in product specificity. Total reaction times ranged from 14.7 seconds to approximately 1.25 minutes.
Capillary tubes excel at rapid heat transfer due to their large surface area to volume ratio but break too frequently to be of practical use outside of the laboratory. Open air, heated water baths are also limited to research use. POC instrumentation and sample container design must be reliable and consider factors such as contamination prevention, manufacturability, and ease-of-use. Plastics are commonly used for disposable medical devices because they meet these criteria; however, they have poor heat transfer characteristics and generally slow PCR temperature cycling.
While-you-wait, POC, sample-to-answer diagnostic tests are feasible considering the extent of control over fluid flow, temperature, chemistry, etc. offered and demonstrated by microfluidic devices. An abundance of microfluidic PCR solutions has been explored [3] [4] [5] . Of particular interest is the flow- through PCR strategy, where a channel repeatedly guides fluid back and forth between static temperature zones, eliminating the need for dynamic, closed- loop temperature control. Microfluidic flow-through PCR has been demonstrated with three distinct temperature zones [6] , temperature gradients [7] , serpentine and spiral channel geometries [8] , real-time fluorescence monitoring [9] , and in conjunction with upstream/downstream processes such as sample preparation and reverse transcription [10] . It was reasoned that the reaction conditions in the water bath system could be used to execute extreme PCR in a microfluidic device.
A plastic thin-film microfluidic card and instrument were designed to reproduce the rapid heat transfer achieved in the water bath system while giving consideration to the practical requirements of a POC device. The system consists of a flow-through PCR card clamped between copper blocks heated to PCR temperatures. The surface area to volume ratio in microfluidic flow enables rapid heat transfer to the sample, and the thin film allows for a bendable sample container while mitigating poor conductivity of the plastic. Copper has excellent thermal conductivity and heat capacity, so it serves well to maintain and deliver heat to the microfluidic card at the controlled temperatures. Reagent concentrations were similar to those from the extreme PCR water bath system.
2. Methods and Materials
The microfluidic card is fabricated from multiple layers of thin film plastic (see Figure 1). Channel dimensions are determined by film thickness and patterns cut out of the internal layers via the process of xurography, a low-cost and rapid approach to creating microstructures [11] [12] .
Thin films down to thicknesses of 12.5 micrometers are readily available, so devices of four to eight layers can be easily kept below a half millimeter in thickness. The thin film is clamped by heated copper blocks, so heat transfers through both surfaces of the device, which roughly doubles the heat flux compared to one-sided heating (see Figure 2). For simplicity, the instrument is designed for

Figure 1. Microfluidic card design. a) Image and sketch of the card with significant features labelled. The length of the fluid plug is shown in green; b) Sketch of a cross section of the inlet components. The connector and backing plate squeeze an o-ring against the card surface to seal the inlet. A pipet tip loads into the connector; c) Design of the microfluidic card shown layer-by-layer. The lowest pictured layer is the top layer of the device; d) Channel dimensions in the temperature cycling zone.

Figure 2. Instrument design. a) Upper and lower halves of the fixture separated to show copper blocks; b) Image of the interface between the instrument and the card inlets and outlets. Locating pins align the card geometry to the temperature zones and the pneumatic head. A hole in the pneumatic head guides the pipet tip into place; c) A view of the pneumatic head with the Tygon tubing that connects to the pressure supply. d) A view of the assembled, unclamped fixture. Cartridge heaters and RTD probes install into holes in the copper blocks. The card slides between the blocks before clamping. There is a 1 millimeter gap between temperature zones
two step PCR, i.e. it only has two temperature zones, one for denaturation and one for primer annealing and extension. The reaction mix is pneumatically pushed through the card as a plug. The PCR cycle time is governed by the inlet/ outlet pressure, plug volume, and channel dimensions, i.e. its hydraulic resistance.
2.1. Heat Transfer Analysis and Modeling
Theoretical performance of thin films was compared against conventional microfluidic devices using a comparison of material properties and a numerical model [13] . All of the analysis was done based on a simplified, one dimensional scenario in which heat transfers from copper to water (used to represent the reaction fluid) through a layer of polycarbonate.
Copper and other metals are much better at transferring heat and maintaining temperature than plastics and water. See Table 1 for a list of material thermal properties. It is helpful to examine the differences in materials’ thermal diffusivities and thermal effusivities to predict their thermal behavior when assembled together in a system. Thermal diffusivity is the ratio of a material’s thermal conductivity to its volumetric heat capacity; it represents how well a material can transfer heat, or equilibrate temperature internally [13] .
 (1)
(1)
Thermal effusivity is the square root of the product of a material’s thermal conductivity and its volumetric heat capacity; it represents how well a material can maintain temperature and transfer heat to its surroundings. When materials of differing temperature contact, comparing their thermal effusivity will reveal which material’s temperature will dominate at the interface.
 (2)
(2)
Copper has a thermal diffusivity roughly 800 times larger than water and polycarbonate. Its thermal effusivity is roughly 65 times larger than polycarbonate and 23 times larger than water.
The gross difference between copper and the other materials’ thermal properties justifies the assumption that it can supply or absorb a large amount of heat from the materials without changing temperature, i.e. it approximates an isothermal heat source. The ratios for water to polycarbonate are 1.1 for thermal diffusivity and 2.8 for thermal effusivity. Contact between these two materials will lead to temperature gradients near their surfaces.

Table 1. Material Thermal Properties.
The thermal diffusivity of a material can also be used to quantify the time scale required for heat to pass through it. If a uniform-temperature body of material experiences a step change in temperature at its surface, similar to plastic or water coming into contact with copper, a thermal wave will develop and penetrate into the material over time (see Figure 3). The penetration depth, or depth at which the material begins to increase in temperature, can be estimated as
 (3)
(3)
Solving for time, the penetration time for a material of thickness L is characterized by
 (4)
(4)
For thicker dimensions, heat must transfer through a longer distance and raise the temperature of a greater length of material in order to penetrate to the far side. For 75 micrometer polycarbonate film, the characteristic time is 0.010 seconds. For 1 millimeter, the time is 1.89 seconds, nearly 200 times greater.
A numerical model was developed to predict the time-dependent temperature distributions that occur in the fluid, polycarbonate, and copper when the fluid switches temperature zones. Since flow is laminar in a microfluidic channel, heat transfer within the fluid is largely due to conduction. As such, the system was modeled as 1-D conduction of a cold body of water equilibrating temperature with a layer of hot polycarbonate and hot copper. For simplicity, a symmetric half model was created by applying an adiabatic boundary condition to the centerline of the fluid (see Figure 4).
The simulation parameters were set to mimic the thin film PCR device. The fluid channel half-depth was set to 40 micrometers, the polycarbonate thickness to 75 micrometers, and the copper to 50 micrometers. The simulation shows that in the first 5 milliseconds, the polycarbonate-water interface temperature drops to 70 degrees Celsius (see Figure 5). This agrees with the prediction that there will be a temperature gradient between the two materials and that the in-

Figure 3. Thermal wave due to step change in surface temperature. When the surface of a material initially at Tc is raised to Th, a time-dependent thermal wave develops. As time increases from t0 to t3, the thermal wave advances to a deeper penetration depth, δt..

Figure 4. Numerical simulation conditions. For boundary conditions, the surface Temperature of the copper is fixed at the hot temperature and heat flux is set to zero at the microchannel centerline. For initial conditions, the copper and Polycarbonate temperatures are uniform at Th and the water temperature is uniform at Tc. The simulation tracks how the temperature distribution changes with time within each material given their thickness, denoted th.

Figure 5. Numerical simulation results for the thin film sample container. The water initially lowers the Temperature of the polycarbonate, then the system equilibrates to the copper temperature. 95% equilibrium is reached in approximately 250 milliseconds.
terface temperature will be closer to that of the water. After the initial drop, temperature equilibrates with the copper block. The temperature change in the copper block is negligible, as predicted.
The simulation was run again with the wall thickness of the polycarbonate increased from 75 micrometers to 1 millimeter to compare thin film performance against a bulk sample container. The results reveal that significant temperature gradients linger in the sample container beyond the time scale required for extreme speeds (see Figure 6). Qualitatively, the plastic cannot store and deliver enough heat to the water, and its thickness impedes heat transfer from the copper block.
The microchannel centerline is the furthest location from the copper block and therefore has the slowest temperature response. The temperature at the centerline vs. time was plotted and compared for both simulations (see Figure 7). The 95% response time of the thin film was roughly 250 milliseconds, while that of the 1 millimeter container was approximately 5 seconds, or 20 times slower.
This analysis shows that success of the described system depends primarily on minimizing the distance between the PCR sample and the temperature source. Contact between sample fluid and a plastic container results in temperature gradients, and those gradients must be eliminated and equilibrated quickly in order to achieve extreme-speed temperature cycling.
2.2. Microfluidic Card Design
The microfluidic card is designed to accept fluid from a pipet tip, carry out 35 temperature cycles, and then dispense the product into a microfuge tube for off-

Figure 6. Numerical simulation results for 1 millimeter thick sample container. The water initially lowers the temperature of the polycarbonate. The thermal wave takes roughly 500 milliseconds to reach the copper, at which point heat transfers from the copper to the polycarbonate and water. The system reaches 95% equilibrium after approximately 5 seconds.

Figure 7. Numerical simulation results. Comparison of Microchannel Temperature vs. time in a thin film and the Bulk sample Container.
card analysis. The inlet connector seals on the face of the card via an O-ring, squeezed and held in place by a backing plate (see Figure 1). Fluid enters the card and undergoes 6 turns before entering the temperature zones to ensure constant flow rate and cycle time. Channel segments alternate between layers at turning points and during long segments, which prevents failures and channel inconsistency due to misalignment and cutting errors. The microchannel is 0.5 millimeters wide and traverses 20 millimeters across the temperature zones with 1.5 millimeter spacing between adjacent channel centerlines. The depth is 75 micrometers except for where the channels overlap, where it is 150 micrometers. After cycling, the fluid is returned to the front of the card and dispensed for off- card analysis.
2.3. Card Fabrication
The microfluidic consumable is a card made from 4 layers of 75 micrometer thick polycarbonate, one side polished, one side matte (Lexan FR83 3 mil, Sabic Polymershapes). The film is placed on a sticky board (StandardGrip 12 × 24 in, Cricut) with the polished side down. A roller is then used to push out air bubbles. Each layer is designed in a 2D CAD program and subsequently cut from the film using a cutting plotter (CE6000-40, Graphtec). Tweezers are used to peel the cut layers and to weed out hanging scraps. The layer designs include holes which are then used to align the layers on an aluminum pegboard. To preserve the alignment during thermal bonding, the layers are tacked together at the outside corners by melting with a soldering iron. The tacked assembly is then placed between two layers of Mylar for protection and thermally bonded at 175 degrees Celsius for 125 seconds using a heat press (TransPro 15 × 15, Pro World). The interface between each layer consists of a polished finish and a matte finish, which allows for air to escape during bonding to prevent bubbles from forming. Post bonding, bumps from the soldering iron are removed with scissors to ensure uniform flatness. Lastly, a polystyrene connector designed to accept a pipet tip is assembled at the inlet with an O-ring and backing plate.
2.4. Instrument
The instrument consists of 4 copper blocks (two for each temperature zone) and a pneumatic head used to push reaction mix through the microfluidic card (see Figure 2). Each copper block has holes drilled for 2 AC-powered cartridge heaters (EM25-3, Hotwatt) and an RTD probe (PR-20-2-100-1/8-2-E-T, Omega). The RTD signal is read by a PID temperature controller (CN32PT-440, Omega) which controls the heaters’ power via a solid state relay (D2425, Crydom).
The blocks are mounted onto upper and lower halves of a clamping fixture. The fixture design includes alignment holes that guide the copper blocks, microfluidic card, pneumatic head, and each fixture half into proper position. There is a 1 millimeter air gap between the block pairs of different temperatures. When clamped, the copper blocks hold the microfluidic card in place and establish the hot and cold PCR zones. The pneumatic head interfaces with the top of the pipet tip with a gasket. A diaphragm vacuum pump (Pilot3000, The Lab Depot, Inc.) and mechanical pressure regulator (43275K16, McMaster-Carr) were connected to the pressure head via Tygon tubing.
2.5. PCR
Amplification was performed on a 69 base pair target within a 450 base pair template of random sequence, synthetic DNA (Integrated DNA Technologies). Forward and Reverse primer lengths were 20 bases. To minimize primer-dimer formation prior to running PCR, the reaction was first prepared into a separate polymerase mix and a DNA/primer mix, both at double the final PCR concentration. The DNA/primer mix contained only the template and primers and the polymerase mix contained the remaining components. Prior to thermal cycling, 10 microliters of each were combined in a microfuge tube, and then 15 microliters were pipetted from the tube and run through the card, corresponding to a total template copy number of 31,500. Final reaction concentrations are shown in Table 2.
The copper block pairs were set to temperatures of 90 and 65 degrees Celsius for the denaturation and annealing/extension temperature zones, respectively. The pressure regulator was set to 20.7 kilopascal (3 psi). An on-off valve was used to block pressure while the card was clamped into the instrument. The 15 microliter reaction mix was aspirated into a 20 microliter pipet tip, and then the tip, still containing liquid, was ejected into the card connector. After clamping the card, the valve was opened to begin thermal cycling.
Three negative controls with no template DNA and two positive controls were run on the instrument. Completed reactions were collected into the cap of a ca-
Table 2. Final PCR Concentrations.
pillary tube (LightCycler Capillary, Roche Diagnostics), spun down, and high resolution melting was performed (HR-1, Biofire Diagnostics). For comparison, an identical reaction and negative control were run in parallel on the water bath system with the cycle time set to 1.2 seconds. A conventional PCR was also performed using polymerase and primer concentrations of 0.06 micromolar and 0.5 micromolar, respectively, with a cycle time of 15 seconds (Light Cycler, Roche Diagnostics).
3. Results
The total surface area of the internal card channel is roughly 22.5 square centimeters, corresponding to 1.5 square centimeters per microliter for a 15 microliter reaction. To quantify the amount of surface adsorption experienced by the reaction while flowing through the card, a melting mix (see Table 3) was prepared and then pushed through the card 15 microliters at a time for a total of 120 microliters. Melting curves were recorded for each 15 microliter increment and then plotted against a control sample that did not pass through the card (see Figure 8). The melting curves show that the mix experienced significant adsorption for the first 60 microliters. Beyond 60 microliters there was little difference compared to the control sample, indicating that the channel was no longer altering the reaction chemistry. These results led to the adoption of a passivation procedure. Prior to all PCR runs, 100 microliters of reaction mix minus polymerase and DNA template was run through the card at a pressure of 82.7 kilopascals (12 psi).
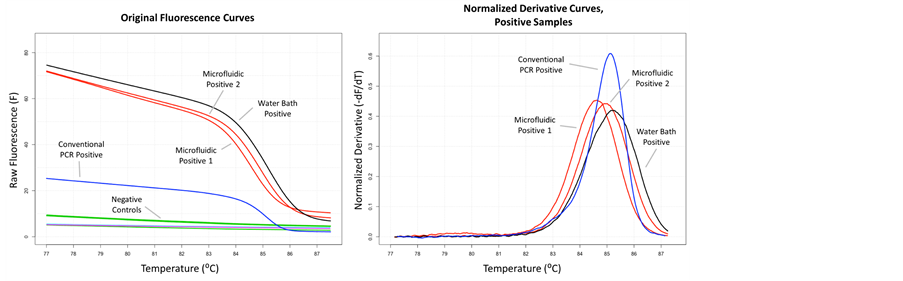
The system successfully amplified a 69-bp fragment of a 450-bp synthetic, random sequence dsDNA template. The fluid spent a total of approximately 52 seconds in the 35 cycle card including fluid entry and collection. The cycle time averaged 1.06 seconds (see Figure 9). The original fluorescence melting curves show no amplification in the negative controls (see Figure 10). The melting
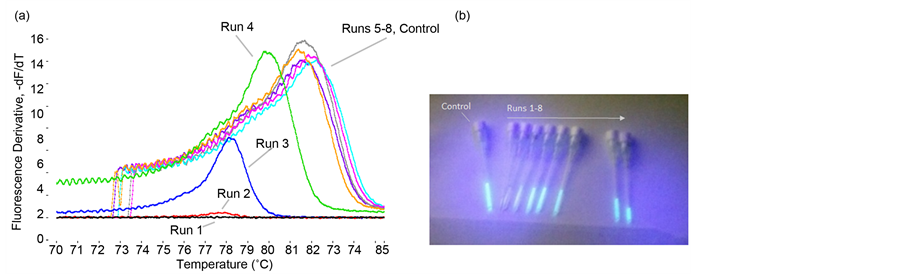
Figure 8. Microchannel adsorption test results. a) Melting curves of successive 15 microliter samples run through card. Significant adsorption occurs in the first 60 microliters (runs 1 - 4). After 60 microliters, there is no difference from the control; b) Image of the 8 runs and control sample under excitation light. The increasing visibility of the fluorescence from runs 1 to 8 matches the pattern seen in the melting curves.

Figure 9. PCR Cycle time. Time was measured for the 15 microliter fluid plug to pass through three different cards under 20.7 kilopasal (3 psi) of pressure. Average flow speed through the card and PCR cycle time were calculated from the respective channel length. The average cycle time was 1.06 seconds. Individual cycle time values for cards 1, 2, and 3 are plotted. A random horizontal jitter is applied so data points don’t obscure each other.
Table 3. DNA Melting Mix
curves of the positive controls and the water bath sample are similar in magnitude, indicating that the product concentration is similar. The normalized, negative derivative plot of the melting curves show that the melting temperatures
 (a) (b)
Figure 10. Melting curves. a) Melting curves show that no DNA was amplified in negative controls and that the magnitude of DNA amplified in the microfluidic card and water bath system were similar; b) Normalized derivative plots of the melting curves show that product melting temperatures from the microfluidic card runs match the water bath system and conventional PCR to within 1 degree Celsius.
Table 4. DNA and Primer Sequences
a. Sequences for all double stranded and single stranded DNA referenced in this paper. Forward and reverse primer sequences are highlighted on the template molecule.
match between all positive runs to within 1 degree Celsius, indicating that the specific DNA fragment was amplified. The size of the product was confirmed to be correct using an agarose gel.
4. Discussion
The results from these experiments and analysis show that flow-through PCR on a thin-film disposable is a feasible solution for POC diagnostics. Thin films provide the type of flexible, disposable, and inexpensive container necessary for commercial use without greatly impeding heat transfer to the internal fluid. As demonstrated, passive contact with copper is effective enough to execute PCR with 1.1 second cycle times. As for the instrument, pressure and temperature control is static and can be achieved with off-the-shelf components. No custom programming is required.
Most flow-through devices and other microfluidic devices have cycle times ranging from 8 seconds to 40 seconds. Some systems succeeded at running cycle times as low as 3 seconds but resulted in poor amplification efficiency. The presented system is the first microfluidic card to achieve robust amplification in less than 1 minute.
The design flexibility of microfluidics will give additional functionality to future iterations of the instrument. Coordinated patterning of microchannels and temperature zones will allow for features such as hot reagent mixing to limit non-specific amplification, three-step PCR with separate annealing and extension temperatures, and temperature dwell time optimization for amplification of longer products. These improvements along with on-card melting analysis will be used to further explore its detection capabilities in terms of amplification from genomic targets, shorter cycle times, and starting template copy number.
Cite this paper
Trauba, J.M. and Wittwer, C.T. (2017) Microfluidic Extreme PCR: <1 Minute DNA Amplification in a Thin Film Disposable. J. Biomedical Science and Engineering, 10, 219-231. https://doi.org/10.4236/jbise.2017.105017
References
- 1. Mullis, K.F.F. and Gibbs, R. (1994) The Polymerase Chain Reaction. Birkhauser, Boston.
https://doi.org/10.1007/978-1-4612-0257-8 - 2. Farrar, J.S. and Wittwer, C.T. (2015) Extreme PCR: Efficient and Specific DNA Amplification in 15-60 Seconds. Clinical Chemistry, 61, 145-153.
https://doi.org/10.1373/clinchem.2014.228304 - 3. Ahrberg, C.D., Manz, A. and Chung, B.G. (2016) Polymerase Chain Reaction in Microfluidic Devices. Lab on a Chip, 16, 3866-3884.
https://doi.org/10.1039/C6LC00984K - 4. Zhang, Y. and Ozdemir, P. (2009) Microfluidic DNA Amplification—A Review. Analytica Chimica Acta, 638, 115-125.
- 5. Zhang, C., et al. (2006) PCR Microfluidic Devices for DNA Amplification. Biotechnology Advances, 24, 243-284.
- 6. Kopp, M.U., Mello, A.J.D. and Manz, A. (1998) Chemical Amplification: Continuous-Flow PCR on a Chip. Science, 280, 4.
https://doi.org/10.1126/science.280.5366.1046 - 7. Crews, N., Wittwer, C. and Gale, B. (2008) Continuous-Flow Thermal Gradient PCR. Biomedical Microdevices, 10, 187-195.
https://doi.org/10.1007/s10544-007-9124-9 - 8. Lee, N.Y. (2013) Recent Progress in Lab-on-a-Chip Technology and Its Potential Application to Clinical Diagnoses. International Neurourology Journal, 17, 2-10.
https://doi.org/10.5213/inj.2013.17.1.2 - 9. Crews, N., et al. (2008) Product Differentiation during Continuous-Flow Thermal Gradient PCR. Lab on a Chip, 8, 919-924.
https://doi.org/10.1039/b716437h - 10. Cao, Q., et al. (2012) Microfluidic Chip for Molecular Amplification of Influenza A RNA in Human Respiratory Specimens. PLoS ONE, 7, e33176.
https://doi.org/10.1371/journal.pone.0033176 - 11. Bartholomeusz, D.A., Boutte, R.W. and Andrade, J.D. (2005) Xurography: Rapid Prototyping of Microstructures Using a Cutting Plotter. Journal of Microelectromechanical Systems, 14, 1364-1374.
https://doi.org/10.1109/JMEMS.2005.859087 - 12. Focke, M., et al. (2010) Lab-on-a-Foil: Microfluidics on Thin and Flexible Films. Lab on a Chip, 10, 1365-1386.
https://doi.org/10.1039/c001195a - 13. Nellis, G.K.S. (2009) Heat Transfer. Cambridge, New York.