Journal of Biomedical Science and Engineering
Vol.6 No.3A(2013), Article ID:29479,5 pages DOI:10.4236/jbise.2013.63A040
Cross-modal connectivity of the secondary auditory cortex with higher visual area in the congenitally deaf—A case study
![]()
Kansei Fukushi Research Institute, Tohoku Fukushi University, Sendai, Japan
Email: sung@tfu-mail.tfu.ac.jp
Received 16 January 2013; revised 24 February 2013; accepted 5 March 2013
Keywords: Deaf; Visual Language Processing; Functional MRI; Fusiform Gyrus; Auditory Cortical Areas
ABSTRACT
It is well known that auditory cortical areas are activated by visual stimulation in the deaf. However, it is not known whether the information enters from the primary visual area or high-level visual areas. In this study, we used visual language stimulation to examine visual-auditory functional connectivity. For this, we used functional magnetic resonance imaging (fMRI) in a congenitally deaf subject to localize areas in the auditory cortex that showed cross-modal reorganization for the processing of visual language inputs and estimate areas in the visual ventral stream, from which language signal inputs enter the auditory areas in the congenitally deaf. We found that the anterior region of the secondary auditory cortex in the superior temporal gyrus showed language-specific activation and that the visual inputs into the area were from the fusiform gyrus, which is a high-level visual area.
1. INTRODUCTION
Numerous studies have reported auditory-visual crossmodal reorganization in deaf [1-12]. Furthermore, changes in auditory-visual connections and cortical responses to visual stimuli such as the neonatal diversion of retinal axons to the auditory thalamus (cross-modal reorganization) results in the development of a primary auditory cortex that resembles visual cortex in its response properties and topography [1]. The reorganization of callosal connections in the auditory cortex by early visual inputs to the auditory thalamus, and the activation in a region of the right auditory cortex corresponds to Brodmann areas (BA) 42 and 22 as well as area 41 (primary auditory cortex) in the deaf [2].
Auditory cortical areas in the superior temporal gyrus are dedicated to mainly processing speech/language. The cross-modal reorganization of retinal axons to the auditory thalamus in the deaf may provide visual language information directly to the primary auditory cortex. However, visual language information is processed in the ventral visual stream, and there may be functional connectivity between auditory areas and high-level visual areas.
Although auditory cortical areas in the deaf are known to be activated by visual stimulation, it is not yet known at what visual stage does visual language information enters the auditory areas.
In this study, we used functional magnetic resonance imaging (fMRI) to identify areas that show cross-modal plasticity in auditory cortices for the processing of visual language inputs and the visual stage where signal inputs enter these areas in the congenitally deaf.
2. MATERIALS AND METHODS
2.1. Subjects
One congenitally deaf subject (left-handed) and four normal hearing subjects, each two leftand right-handed, were participated. The deaf subject was female and a 20-year-old college student. She could hear sound with a hearing aid but could not understand the meaning. The normal subjects were all female and college students of age 20 - 22. After the subjects were given a complete description of the study, written informed consent was obtained in accordance with the Declaration of Helsinki. This study was approved by the Institutional Review Board of Tohoku Fukushi University. MRI scan was performed twice with one year interval for the deaf subject and once for the hearing subjects.
2.2. MRI Data Acquisition
All MRI experiments were performed using a Verio system (Siemens, Germany) with a standard, 12-channel head matrix coil operating at 3 Tesla. After initial localizing images were obtained, T1-weighted anatomical images were obtained with an inverted recoveryand magnetization-prepared rapid acquisition using a gradient echo with a matrix size of 256 ´ 256 mm over 256 mm field of view and 1 mm slice thickness. For functional imaging, single-shot, gradient-echo, planar imaging was used with a 1000 milliseconds repetition time, 25 milliseconds echo time, 90 degree flip angle, 220 mm field of view, 64 ´ 64 mm matrix size, and 3.4 mm slice thickness with no gap. Eighteen slices parallel to the AC-PC were acquired for each volume. For resting-state imaging with 2000 milliseconds repetition time and thirty slices were used with other parameters the same as the functional imaging.
2.3. Stimulation Procedure
Face, building, mouth (shape of sound) and two-lettersword (GANA) pictures were used as visual stimuli (Figure 1) because visual word, face and building pictures activate the visual word form area, the face fusiform area and parahippocampal place area respectively that are located nearly at the middle of the posterior-to-anterior line on the ventral visual stream. Mouth pictures were used as a visual language condition.
Stimulus pictures were presented at the center of the visual field. The experimental runs consisted of four stimulus conditions, i.e., face, building, mouth and word conditions. Stimulation during one experimental run con-

Figure 1. Sample pictures for visual stimulation. (a) Face; (b) Building; (c) Mouth shape; and (d) Word. (a) and (b) are nonlanguage conditions and (c) and (d) are language conditions.
sisted of 8 stimulus blocks, with two blocks for each condition. The total time of the experimental run was 240 s, including pre-, post-, and inter-stimulus rest periods of 18 s, and a stimulation period of 16 s. Each stimulation block had 8 stimulus trials, which comprised 1.5 s on and 0.5 s off periods. Two stimulus blocks were randomly repeated for each stimulus condition. Two experimental runs were performed for each subject. During scanning, subjects were instructed to focus on the crosshair at the center of the screen and did one-back task for stimulus pictures. Another experimental run was for resting-state experiment. For this one run of 300 s was performed while subjects closed their eyes.
2.4. Visual Stimulation
Visual stimuli were presented using a projector (Panasonic Corporation, Osaka, Japan; spatial resolution 1024 ´ 768 pixels; refresh rate, 60 Hz) onto a mirror mounted onto a head coil. All pictures were grayscale images, and the background was gray.
2.5. Image Processing
The image data obtained from fMRI were processed using Brain Voyager QX (Brain Innovation B.V., Postbus, The Netherlands) software. All image data from the functional session for each subject were preprocessed with Brain Voyager QX and motion correction, scan time correction, and high-pass filtering with a cut-off frequency of 0.005 Hz. In each functional run, the first 10 volumes were discarded to ensure that a steady state was reached. 2D-data from the functional session was converted into 3D-data via trilinear interpolation and transformed into Talairach space using BrainVoyager QX. For multi-subject analysis, 3D Gaussian spatial smoothing (full width at half maximum 5 mm) was applied to the data sets. Statistical analysis was performed by a procedure based on general linear modeling using Brain Voyager QX. Each experimental condition (except for the control) was defined as a separate predictor. The reference time-course used as the predictor was the twogamma hemodynamic response function. This analysis was performed independently for the time-course of each individual voxel for each subject. To complete this analysis, the time series of the images obtained from each subject were converted into Talairach space and z-normalized.
2.6. Analysis Procedure
Analyses were performed as follows: comparison of language conditions (mouth and word) and non-language conditions (face and building) was performed for identifying regions recruited for visual language in auditory cortex. After identification of the areas functional connectivity was investigated by a correlation analysis with the identified region as a seed in resting-state data.
3. RESULTS
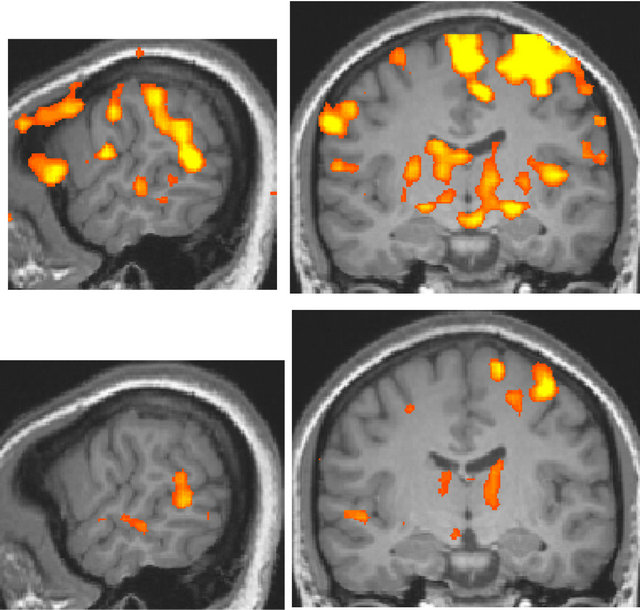
For the deaf subject, the superior temporal gyrus was activated more broadly and strongly by visual stimulation compared to that of normal-hearing subjects, irrespective of handedness (Figure 2).
By comparing the language conditions and non-language conditions, the anterior region of the superior temporal gyrus, BA 22, was identified in the right hemisphere, and it corresponded to the anterior region of the secondary auditory cortex (Figure 3).
In the left hemisphere, a region was identified at superior/middle temporal gyrus and the location of the region was lower than in the right hemisphere, and this area corresponded to the secondary/auditory association cortices. The identified area was used as a basis for correlation analysis of the data that were acquired in the resting-state. The fusiform gyrus in the ventral visual pathway was identified only in the right hemisphere (Figure 4).
The same area was identified by the correlation analysis when the left secondary auditory area was used as a basis for correlation analysis. There was not found any area showing correlation with the secondary auditory cortex in the ventral visual pathway of the left hemisphere at the same threshold. The two experiments for deaf subject through the period of one year showed almost similar results. In contrast, for normal-hearing subjects, only small activations in the superior temporal gyrus were found by visual stimulation. The comparison of the language and non-language conditions did not identify any region of activation. Furthermore, no significant difference was observed in normal-hearing subjects based on handedness.
4. DISCUSSION
The activation of the secondary auditory cortex in the anterior region of the superior temporal gyrus indicates that the area was reorganized for visual language information processing in deaf subject because the corresponding area in normal-hearing subjects did not show any significant activation. The functional connectivity at the resting-state between the secondary auditory cortex and the right fusiform gyrus suggests that visual inputs into the auditory cortex were not only through the reorganization of retinal axons to the auditory thalamus or from the primary visual cortex through the angular gyrus but also from a higher visual level [13]. Although a previous study reported that normal-hearing subjects showed activation in the middle temporal gyrus in a task involving lip reading [14], the activation of the secondary
 (a)
(a)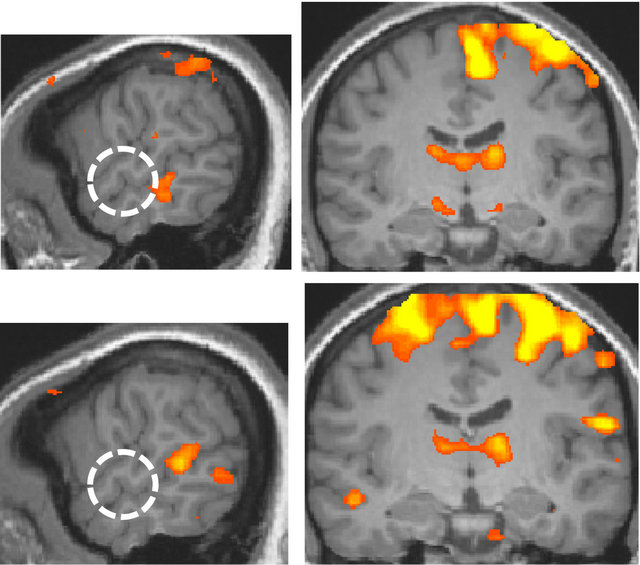 (b)
(b)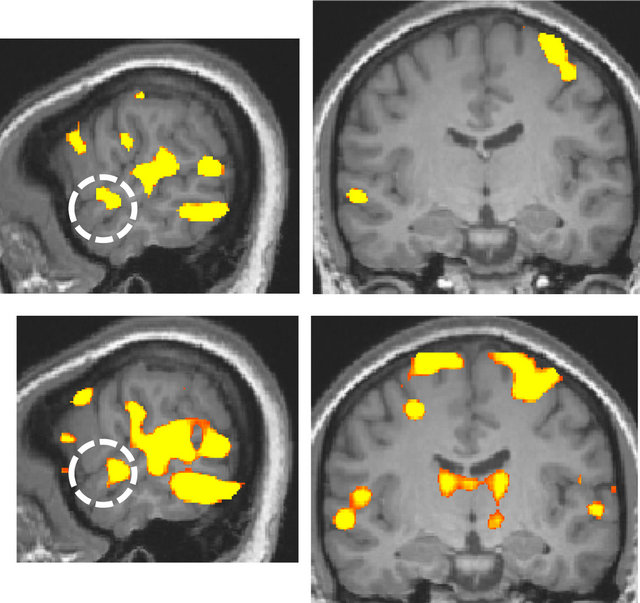 (c)
(c)
Figure 2. Activation maps for all stimulus conditions (x = 60, y = −13 at Talairach coordinates, p < 0.00001, uncorrected). (a) Two right-handed normal-hearing subjects (top and bottom panels); (b) Two left-handed normal-hearing subjects (top and bottom panels); (c) The deaf subject, two different magnetic resonance imaging (MRI) scans with a one-year interval (top and bottom panels).
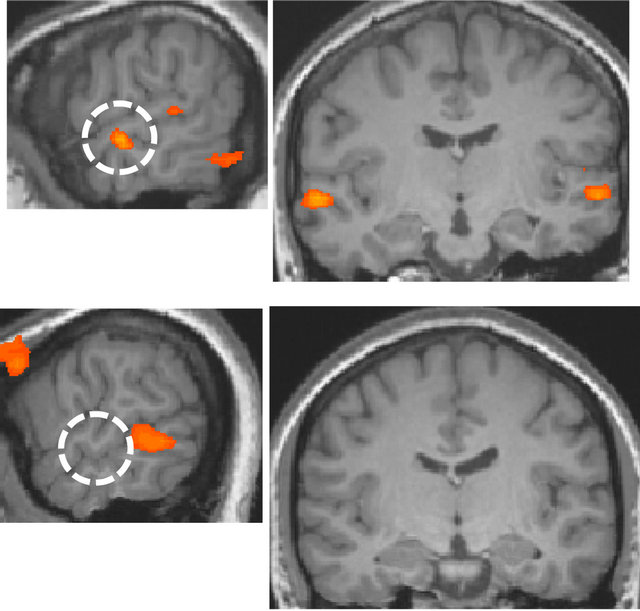
Figure 3. Areas of larger response to the language condition than to the non-language condition (p < 0.002, uncorrected; x = 60 and y = −13 at Talairach coordinates). The white dotted circle corresponds to the anterior region of the right secondary auditory cortex. Top panel: the deaf. Bottom panel: the normal-hearing.
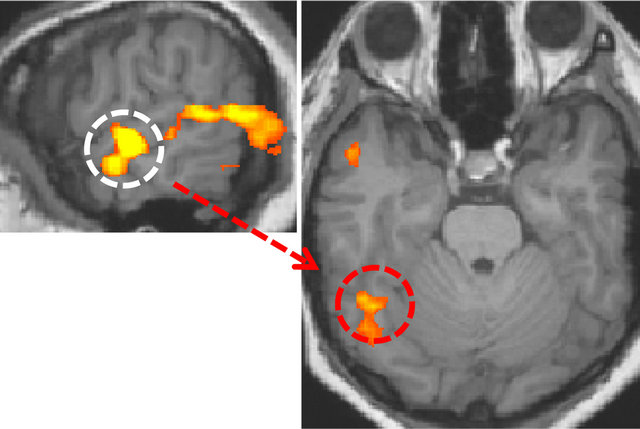
Figure 4. Visual area having functional connectivity with the secondary auditory cortex (r > 0.8, p < 10−9). The white dotted circle is the secondary auditory cortex. The red dotted circle is the right fusiform gyrus.
auditory cortex in the present experiment indicates that the secondary auditory cortex in the deaf received more language information than the cortex in normal-hearing subjects, which is reasonable when we consider that the ventral visual region processes visual words [15,16].
It is known that language information is processed dominantly in the left hemisphere but the present data shows that only the fusiform gyrus in the right hemisphere has functional correlation with the secondary auditory cortex. Though future studies are needed for clarifying the right hemisphere dominance, one of the reasons for the right hemisphere dominant correlation may be due to the left handedness of the deaf subject because of about 20 percent of left-handed people having righthemisphere dominance in language processing [17].
5. CONCLUSION
The present data show that the auditory cortical areas in the congenitally deaf were reorganized in order to receive visual language inputs, especially at higher level above the primary auditory cortex, and visual inputs into the reorganized areas were from the fusiform gyrus, which is a high-level visual area. Knowing what roles the auditory cortical areas receiving visual signals play is necessary in understanding language processing mechanism of deaf people, which will help us make more effective programs for their language learning as well as understand brain plasticity.
6. ACKNOWLEDGEMENTS
This study was supported by a Program of Funding Basic Res. Ctr. in Private Univ. (MEXT) to the Kansei Fukushi Res. Ctr., Tohoku Fukushi Univ. (2008-2012).
REFERENCES
- Pallas, S.L., Littman, T. and Moore, D.R. (1999) Crossmodal reorganization of callosal connectivity without altering thalamocortical projections. Proceedings of the National Academy of Sciences of USA, 96, 8751-8756. doi:10.1073/pnas.96.15.8751
- Finney, E.M., Fine, I. and Dobkins, K.R. (2001) Visual stimuli activate auditory cortex in the deaf. Nature Neuroscience, 4, 1171-1173. doi:10.1038/nn763
- Finney, E.M., Clementz, B.A., Hickok, G. and Dobkins, K.R. (2003) Visual stimuli activate auditory cortex in deaf subjects: Evidence from MEG. Neuroreport, 14, 1425- 1427. doi:10.1097/00001756-200308060-00004
- Lee, H.J., Truy, E., Mamou, G., Sappey-Marinier, D. and Giraud, A.L. (2007) Visual speech circuits in profound acquired deafness: A possible role for latent multimodal connectivity. Brain, 130, 2929-2941. doi:10.1093/brain/awm230
- Lomber, S.G., Meredith, M.A. and Kral, A. (2010) Crossmodal plasticity in specific auditory cortices underlies visual compensations in the deaf. Nature Neuroscience, 13, 1421-1427. doi:10.1038/nn.2653
- Meredith, M.A., Kryklywy, J., McMillan, A.J., Malhotra, S., Lum-Tai, R. and Lomber, S.G. (2011) Crossmodal reorganization in the early deaf switches sensory, but not behavioral roles of auditory cortex. Proceedings of the National Academy of Sciences of USA, 108, 8856-8861. doi:10.1073/pnas.1018519108
- Lomber, S.G., Meredith, M.A. and Kral, A. (2011) Adaptive crossmodal plasticity in deaf auditory cortex: Areal and laminar contributions to supranormal vision in the deaf. Progress in Brain Research, 191, 251-270. doi:10.1016/B978-0-444-53752-2.00001-1
- Weisberg, J., Koo, D.S., Crain, K.L. and Eden, G.F. (2012) Cortical plasticity for visuospatial processing and object recognition in deaf and hearing signers. Neuroimage, 60, 661-672. doi:10.1016/j.neuroimage.2011.12.031
- Meredith, M.A., Keniston, L.P. and Allman, B.L. (2012) Multisensory dysfunction accompanies crossmodal plasticity following adult hearing impairment. Neuroscience, 214, 136-148. doi:10.1016/j.neuroscience.2012.04.001
- Karns, C.M., Dow, M.W. and Neville, H.J. (2012) Altered cross-modal processing in the primary auditory cortex of congenitally deaf adults: A visual-somatosensory fMRI study with a double-flash illusion. Journal of Neuroscience, 32, 9626-9638. doi:10.1523/JNEUROSCI.6488-11.2012
- Li, Y., Booth, J.R., Peng, D., Zang, Y., Li, J., Yan, C. and Ding, G. (in press) Altered intraand inter-regional synchronization of superior temporal cortex in deaf people. Cerebral Cortex.
- Husain, F.T., Patkin, D.J., Kim, J., Braun, A.R. and Horwitz, B. (2012) Dissociating neural correlates of meaningful emblems from meaningless gestures in deaf signers and hearing non-signers. Brain Research, 1478, 24-35. doi:10.1016/j.brainres.2012.08.029
- Bear, M.F., Connors, B.W. and Pradiso, M.A. (1996) Neuroscience: Exploring the brain. Willams & Wilkins Ltd., Baltimore.
- Berstein L.E., Auer, E.T., Moore, J.K., Ponton, C.W., Don, M. and Singh M. (2002) Visual speech perception without primary auditory cortex activation. Neuroreport, 13, 311-315. doi:10.1097/00001756-200203040-00013
- McCandliss, B.D., Cohen, L. and Dehaene, S. (2003) The visual word form area: Expertise for reading in fusiform gyrus. Trends in Cognitive Sciences, 7, 293-299. doi:10.1016/S1364-6613(03)00134-7
- Buchweitz, A., Mason, R.A., Tomitch, L.M.B. and Just, M.A. (2009) Brain activation for reading and listening comprehension: An fMRI study of modality effects and individual differences in language comprehension. Psychology Neuroscience, 2, 111-123.
- Taylor, I. and Taylor, M.M. (1990) Psycholinguistics: Learning and using languages. Prentice-Hall Inc., Englewood Cliffs.