Journal of Biomedical Science and Engineering
Vol.6 No.5(2013), Article ID:31512,9 pages DOI:10.4236/jbise.2013.65066
The value of magnetic resonance spectroscopy and diffusion tensor imaging in characterization of gliomas growth patterns and treatment efficiency

1Department of Radiology, Riga Stradins University, Riga, Latvia
2Department of Radiology, Riga East Clinical University Hospital, Riga, Latvia
Email: anvita@inbox.lv
Copyright © 2013 Anvita Bieza, Gaida Krumina. This is an open access article distributed under the Creative Commons Attribution License, which permits unrestricted use, distribution, and reproduction in any medium, provided the original work is properly cited.
Received 10 February 2013; revised 25 March 2013; accepted 30 April 2013
Keywords: Glioma; Perifocal Zone; Treatment; Fractional Anisotropy; Magnetic Resonance Spectroscopy
ABSTRACT
The objective of the study was to assess the usefulness of magnetic resonance spectroscopy (MRS) and diffusion tensor imaging (DTI) in detection of vital tumor cell infiltration presence in peritumoral brain areas and determination of biochemical changes in the brain parenchyma after received treatment. 73 patients with present, morphologically conformed brain gliomas and 77 gliomas patients in remission stage after combined therapy underwent magnetic resonance imaging (MRI) including MRS and DTI. Fractional anisotropy (FA) and metabolite ratios—choline/creatine (Cho/Cr), myoinositol/creatine (MI/Cr), lactate-lipid/creatine (LL/Cr), N-acetyl aspartate/creatine (NAA/Cr)—were measured in the tumor, perifocal edema zone, distant and contra-lateral normal appearing white matter. We observed gradual reduction of Cho/Cr, MI/Cr, LL/Cr mean ratios and step-by-step increase of NAA/Cr, FA mean values in the direction from the tumor to the distant and contra-lateral normal-appearing white matter. LL/Cr ratios within distal normal appearing white matter decreased in patients after radiotherapy/chemotherapy. Our study suggests that MRS and DTI in combination with structural MRI sequences enhance vital glial tumor cells areas and possible infiltration border. MRS and DTI quantitative measurements in the glioma peritumoral area reveal pathological changes, despite the normal signal intensity in structural MRI. We suggest that increased LL/Cr ratios and decreased FA values may have the superior implications in the detecting of glial tumors extent along the white matter tracts. NAA/Cr reduction and Cho/Cr increase may provide additional diagnostic value. LL/Cr ratio in distal normal signal intensity area could be used as radiation/chemotherapy effectiveness criteria, as this will reduce after the received treatment and in remission period.
1. INTRODUCTION
Glioma is the most common primary malignant brain tumor [1]. Despite the development of modern surgical techniques, focused radiotherapy and new chemotherapy schemes, the majority of glial brain tumors recur due to invasive growth [1-4]. Preoperative recognition of gliomas invasion border is a one of the most relevant clinical problem. The usefulness of conventional structural MRI sequences is limited because of their insensitivity for detection of tumor cells outside the visible tumor border. In this regard, new, advanced imaging techniques providing the physiological and metabolic characteristics of the tumor and surrounding brain tissue could be perspective [5]. DTI with FA quantitative characteristics is a noninvasive approaches for brain white matter study and particularly, in patients with glial cerebral tumors because values of FA reflect the integrity state of white matter tracts [6]. MRS is a technique for noninvasive in vivo assessment of brain metabolites concentration [7-9]. Metabolites that are observed and well tested in the brain include choline (Cho), creatine (Cr), N-acetylaspartate (NAA), myoinositol (MI), lactate and lipids (LL). NAA is regarded as a marker for neuronal function [5,10]. Cr is a marker of cellular energy metabolism. Cr is considered the most stable brain metabolite [8]. Cho is a marker of cell membrane [5,11]. MI is a marker of glial cells [12]. Lipids are brain destruction products. Lactate is a product of anaerobic glycolysis [5].
Recently many studies analyzed the role of MRS and DTI in differentiation of glial tumor as well as evaluation of the treatment toxic effects. Less research has been devoted to determining the effectiveness of therapy in the peritumoral normal signal intensity area. Most studies typically compared two groups—patients with recurrent malignant lesions and those without recurrent lesions [13]. We have analyzed the neuronal markers and diffusion anisotropy parameters in glioma and definite peritumoral areas to detect vital cell infiltration in normal appearing brain areas. To evaluate the effect of nonsurgical therapy on vital tumor cells, we analyzed separately DTI and MRS parameters alterations in two subgroups: 1) patients before radiation/chemotherapy; 2) patients after radiation/chemotherapy with present residual tumor, and compared results with patients in remission period.
The objective of the study was to assess the usefulness of MRS and DTI in detection of vital tumor cell infiltration in peritumoral brain areas and determine the biochemical changes in the brain after received treatment.
Our hypothesis was that glial brain tumor and its perifocal areas are characterized by different values of neuronal markers and diffusion anisotropy parameters; that tumor grows from peripheral area where vital tumor cells have a higher concentration, and in this area the metabolic changes are expected after effective therapy.
2. MATERIALS AND METHODS
2.1. Patients
73 patients (40 women and 33 men, mean age 48 years, range, 14 - 78 years) with brain gliomas and were studied retrospectively. This group included both primary diagnosed glial tumors before treatment and recurrent or residual tumor after treatment. The tumor diagnosis was determined based on morphological and immunohistochemical confirmation. Histological type was classified according to the World Health Organization brain tumor classification [14] and consisted of 44 glioblastomas, 9 anaplastic oligoastrocytomas, 12 anaplastic astrocytomas, 3 oligoastrocytomas, 3 astrocytomas, 1 anaplastic oligodendroglioma and 1 oligodendroglioma. Depending on previous treatment two subgroups were divided: glial tumor patients before radiotherapy/chemotherapy (n = 24) and patients after radiotherapy/chemotherapy with residual tumor (n = 49).
Control group consisted of 77 patients (50 women and 27 men, mean age 48 years, range, 19 - 72 years) in a radiological and clinical remission period with possible treatment induced changes in the brain. Radiological remission was diagnosed, based on structural MRI findings in control examination using the following criteria: long-term stability of the structural MRI or spontaneous regression of lesion [15,16]. Clinical symptoms and the objective test results obtained from the medical records supplemented the radiological diagnosis [16,17]. The approvals of local Institutional Review Board of the Riga East Clinical University Hospital and the Ethics Committee of Riga Stradins University before study initiation were obtained.
2.2. MRI Acquisition
MRI was performed on a 1.5-T General Electric Signa EXCITE MR unit with 8-channel head coil. Standard conventional brain MRI protocol (T2-weighted, FLAIR, diffusion weighted images, un-enhanced and gadolinium-enhanced T1-weighted images) was supplemented with MRS ((8ch) PROBE-2DSI PRESS 144TE) and DTI (TENSOR 25 directions 1000b) (Figure 1). MRS was performed with multi-voxel technique prior to contrast administration. The volume of interest for MRS was determined by using T2-weighted or FLAIR images in axial plane and it was defined including the pathological signal intensity area as well as normal appearing brain tissue. The row data of DTI were obtained using the axial commissural plane.
2.3. MRI Data Post-Processing and Image Analysis
Post-processing of MRS and DTI images was performed on a MR GELS (General Electric) workstation. Quantitative measurements of DTI and MRS were made in four regions of interest (ROIs):
• Tumor—clearly visible solid component, contrast enhancement, abnormal signal intensity in T2, FLAIR images;
• Perifocal edema—an area of increased signal intensity in T2 and FLAIR images, without contrast enhancement, within 1 cm from the tumor solid parts;
• Distant normal-appearing white matter—up to 1 cm from the abnormal signal intensity area;
• Contra-lateral normal-appearing white matter—normal signal intensity area in all structural MR sequences.
Placement of ROI was based on previously published recommendations [9,18,19].
We calculated metabolite ratios using the Cr signal as a reference (NAA/Cr, Cho/Cr, LL/Cr and MI/Cr). The axial T2 or FLAIR images were used to manually place defined ROIs in spectroscopic matrix.
After the visual evaluation of color-coded FA maps, round-shaped, uniform sized (30 pixels) ROI for quantitative parameter of DTI (FA) measuring was placed in the identical brain areas on gray-scale DTI axial images.
2.4. Statistical Analysis
Statistical analyses were performed using the Statistical

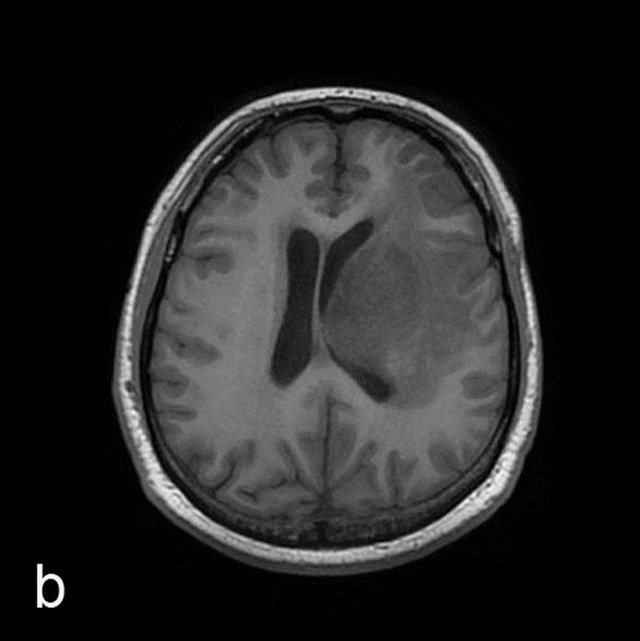

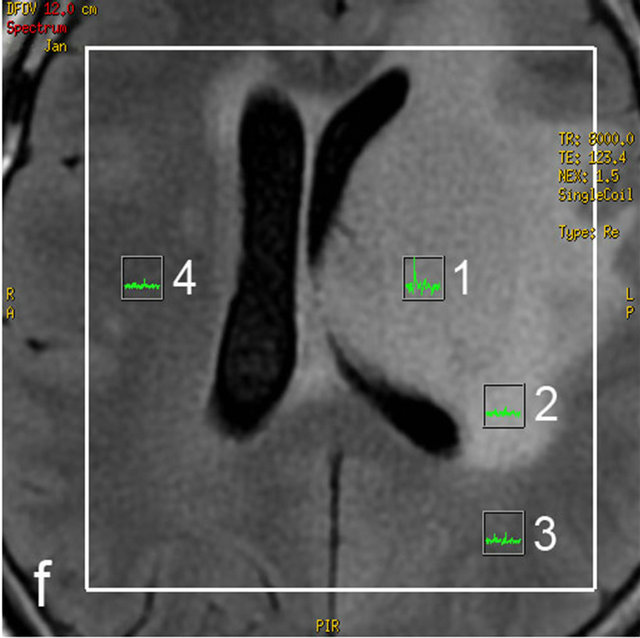
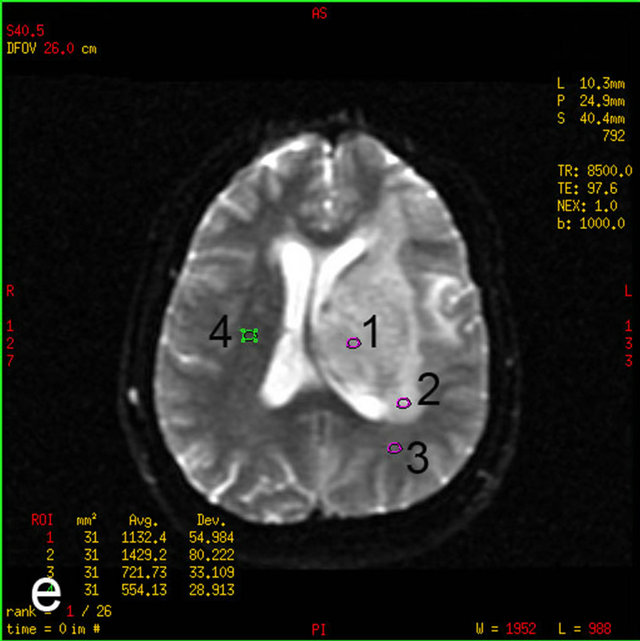
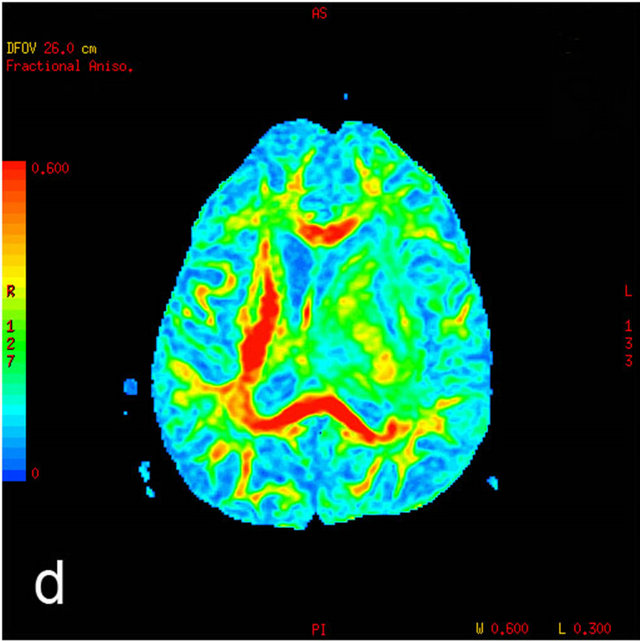
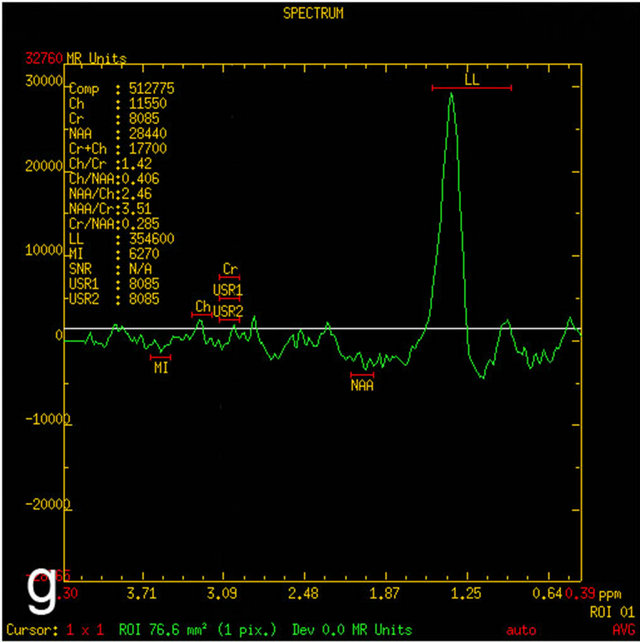

Figure 1. MRI in a 45-year-old man with morphologically and immunohistochemically confirmed recurrent anaplastic oligoastrocytoma: (a) Axial T2 FLAIR MRI shows an infiltrative left frontal lobe white matter mass; (b) Axial T1 MRI shows a hypointense infiltrative mass; (c) Axial T1 post-contrast MRI shows a heterogeneously enhancing mass in the left frontal lobe. Surrounding hypointensity represents edema and/or tumor cells; (d) Color-coded FA map on which regions of high anisotropy are shown in red, and regions of low anisotropy are shown in blue. The map shows reduced FA in left internal capsule; (e) Four ROIs placements are shown on the gray-scale diffusion tensor map for the determination of the FA values. ROIs were placed in the tumor [1], the perifocal edema [2], the distant normal-appearing white matter [3] and the contra-lateral normal-appearing white matter [4]; (f) Identical four ROIs for metabolites measurements is placed in the spectroscopic matrix on axial FLAIR image; (g) Proton MRI spectra from selected region in the tumor shows high LL peak and reduced NAA peak; (h) MR spectrum in the contra-lateral normal-appearing white matter shows high NAA peak. The LL peak is not visible.
Package for Social Sciences software (SPSS) version 20. We used descriptive statistics to calculate means and standard deviations of measurements. The KolmogorovSmirnov test was used to determine if the data were normally distributed. If the data were normally distributed (p > 0.05), the paired samples t-test was used for testing hypothesis on median between variables. If the variables in paired samples did not meet the normal distribution (p < 0.05), the nonparametric related samples Wilcoxon signed rank test was used to compare pairs. P values less than 0.05 were considered statistically significant.
3. RESULTS
We calculated Cho/Cr, NAA/Cr, MI/Cr, LL/Cr ratios, FA mean values and standard deviations in each area of interest using descriptive statistics method. There were gradual reduction of Cho/Cr, MI/Cr, LL/Cr mean ratios and gradual increase of NAA/Cr, FA mean values in the direction from the tumor to the distant and contra-lateral normal-appearing white matter. The mean values (and standard deviations) of the Cho/Cr, MI/Cr, LL/Cr, NAA/ Cr ratios and FA are summarized in Table 1.
Variables in each group (tumor, perifocal edema, distant and contra-lateral normal-appearing white matter) were examined for their compliance with normal distribution by means of Kolmogorov-Smirnov test. In the tumor Cho/Cr, MI/Cr, FA values did not conform to normal distribution (p < 0.05), therefore the nonparametric Wilcoxon signed-rank test was used to compare paired samples. In the tumor NAA/Cr, LL/Cr values demonstrated normal distribution (p > 0.05), therefore the Student’s t-test for paired samples was used. In the perifocal edema Cho/Cr, MI/Cr did not conform to normal distribution (p < 0.05), NAA/Cr, LL/Cr, FA demonstrated normal distribution (p > 0.05). In the distant normal-appearing white matter Cho/Cr, MI/Cr, LL/Cr did not conform to normal distribution (p < 0.05), NAA/Cr, FA demonstrated normal distribution (p > 0.05). In the contra-lateral normal-appearing white matter Cho/Cr, NAA/Cr, MI/Cr, FA did not conform to normal distribution (p < 0.05), LL/Cr demonstrated normal distribution (p > 0.05).
Comparing data in paired samples between tumor and perifocal edema, statistically significant differences were observed between the Cho/Cr mean values (p < 0.001Wilcoxon test), between the NAA/Cr mean values (p = 0.009, t-test), between the LL/Cr mean values (p < 0.001, t-test), between the FA mean values (p < 0.001, Wilcoxon test), but MI/Cr did not show statistically significant difference (p = 0.647, Wilcoxon test).
Comparing data in paired samples between tumor and distant normal-appearing white matter, statistically significant differences were observed between the Cho/Cr mean values (p < 0.001, Wilcoxon test), between the NAA/Cr mean values (p < 0.001, t-test), between the MI/Cr mean values (p < 0.001, Wilcoxon test), between the LL/Cr mean values (p < 0.001, Wilcoxon test), between the FA mean values (p < 0.001, Wilcoxon test).
Comparing data between tumor and contra-lateral normal-appearing white matter, statistically significant differences were observed between the Cho/Cr mean values (p < 0.001, Wilcoxon test), between the NAA/Cr mean values (p < 0.001, Wilcoxon test), between the MI/Cr mean values (p < 0.001, Wilcoxon test), between the LL/Cr mean values (p < 0.001, t-test), between the FA mean values (p < 0.001, Wilcoxon test).
Comparing data between perifocal edema and distant normal-appearing white matter, statistically significant differences were observed between the Cho/Cr mean values (p = 0.034, Wilcoxon test), between the NAA/Cr mean values (p = 0.010, t-test), between the MI/Cr mean values (p = 0.002, Wilcoxon test), between the LL/Cr mean values (p < 0.001, Wilcoxon test), between the FA mean values (p < 0.001, t-tests).
Comparing data between perifocal edema and contra-lateral normal-appearing white matter, statistically significant differences were observed between the Cho/ Cr mean values (p < 0.001, Wilcoxon test), between the NAA/Cr mean values (p < 0.001, Wilcoxon test), between the MI/Cr mean values (p < 0.001, Wilcoxon test), between the LL/Cr mean values (p < 0.001, t-test), between the FA mean values (p < 0.001, Wilcoxon test).
Comparing data between distant and contra-lateral normal-appearing white matter, statistically significant differences were observed between the Cho/Cr mean values (p = 0.002, Wilcoxon test), between the NAA/Cr mean values (p < 0.001, Wilcoxon test), between the
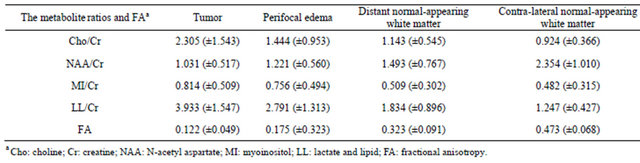
Table 1. The metabolite ratios and FA measurements results (mean ± standard deviation) in patients with glial brain tumors.
a Cho: choline; Cr: creatine; NAA: N-acetyl aspartate; MI: myoinositol; LL: lactate and lipid; FA: fractional anisotropy.
LL/Cr mean values (p < 0.001, Wilcoxon test), between the FA mean values (p < 0.001, Wilcoxon test), but MI/Cr did not show statistically significant difference (p = 0.365, Wilcoxon test).
To determine whether the received radiation/chemotherapy affected neuronal markers and diffusion anisotropy parameters, we compared the measurements in two subgroups of patients—before radiotherapy/chemotherapy (n = 24) and after radiotherapy/chemotherapy (n = 49) by the Wilcoxon test. Comparing measurements in the tumor, Cho/Cr mean values of the first group 1.935 and second group 2.486 did not show statistically significant difference (p = 0.145); NAA/Cr mean values respectively 0.918 and 1.086 did not show statistically significant difference (p = 0.070); MI/Cr mean values 0.815 un 0.813 did not show statistically significant difference (p = 0.753); LL/Cr mean values 4.255 un 3.776 did not show statistically significant difference (p = 0.304); FA mean values 0.108 un 0.128 did not show statistically significant difference (p = 0.831). Comparing measurements in the perifocal edema, Cho/Cr mean values before radiotherapy/chemotherapy 1.187 and after radiotherapy/chemotherapy 1.566 did not show statisticcally significant difference (p = 0.126); NAA/Cr mean values respectively 1.054 and 1.300 did not show statistically significant difference (p = 0.615); MI/Cr mean values 0.690 and 0.787 did not show statistically significant difference (p = 0.872); LL/Cr mean values 2.717 and 2.826 did not show statistically significant difference (p = 0.421); FA mean values 0.173 and 0.176 did not show statistically significant difference (p = 0.629). Comparing measurements in the distant normal-appearing white matter, Cho/Cr mean values before radiotherapy/chemotherapy 1.340 and after radiotherapy/chemotherapy 1.047 did not show statistically significant difference (p = 0.179); NAA/Cr mean values respectively 1.526 and 1.476 did not show statistically significant difference (p = 0.710); MI/Cr mean values 0.563 and 0.484 did not show statistically significant difference (p = 0.841); LL/Cr mean values 2.267 and 1.622 showed statistically significant difference (p = 0.013); FA mean values 0.313 and 0.327 did not show statistically significant difference (p = 0.513). Comparing measurements in the contra-lateral normal-appearing white matter, Cho/Cr mean values before radiotherapy/chemotherapy and after radiotherapy/chemotherapy 0.844 and 0.964 did not show statistically significant difference (p = 0.265); NAA/ Cr mean values respectively 2.279 and 2.391 did not show statistically significant difference (p = 0.607); MI/ Cr mean values 0.532 and 0.456 did not show statistically significant difference (p = 0.738); LL/Cr mean values 1.335 and 1.204 did not show statistically significant difference (p = 0.407); FA mean values 0.480 and 0.469 did not show statistically significant difference (p = 0.523).
Since only the LL/Cr measurements in the distant normal-appearing white matter showed statistically significant difference in patients before and after radiotherapy/chemotherapy, we compared this measurement between patients in clinical and radiological remission period (1.377) and patients after received combination therapy with a residual tumor tissue (1.622). The measurements did not show statistically significant difference (p = 0.193).
4. DISCUSSION
Our research is devoted to the one of the most topical, yet insufficiently explored glial tumors problem—glioma cell invasion real border in vivo. It is believed that at the time of diagnosis the glioblastoma cells have invaded brain tissue 2 - 3 cm away from the tumor core [20,21]. The exact demarcation of the tumor is essential, because the main objective in the current oncological neurosurgery is to maximize tumor resection while preserving the surrounding functioning brain tissue [22].
We analyzed the structural and functional MRI examinations in patients with histologically proven glial brain tumors. We combined diffusion anisotropy parameter (FA) and MRS quantitative measurements to determine whether such a multimodal approach provides additional meaningful information in determining glial tumor infiltration in peritumoral area that appears a normal on structural MRI.
We observed a progressive increase of NAA/Cr ratio from the tumor to the distal and contra-lateral normal-appearing white matter. In all measurement zones the NAA/Cr values were statistically significantly different. This finding is very important in the assessment of the distal normal signal intensity area, because this area appears normal in structural MRI and visually does not differ from the contra-lateral normal appearing white matter. The NAA/Cr ratio difference between these zones was significant (p < 0.001). MRS findings suggest that the neuronal function and integrity disorder is observed in the normal signal intensity white matter zones close to the tumor area, which are presumably related to an individual tumor cell infiltration into peritumoral area. NAA/Cr alterations in brain areas close to the tumor were less specific—characteristic differences between tumor and edema zone, between the edema and distant normal appearing white matter were lower (p-values were, respectively, 0.009 and 0.01). These observations suggest that the NAA/Cr ratio is more specific for possible determination of tumor cell infiltration in the normal signal intensity of white matter, but less specific in differentiating between tumor and perifocal edema where the integrity of neuronal damage is more pronounced both due to high concentration of tumor cells and edema.
We observed a gradual increase of FA values in the direction from the tumor to the distant and contra-lateral normal appearing white matter. Between all measurement areas the differences of FA values were significant (p < 0.001). Conceptually, this finding was expected, because the FA is associated with alteration in neuronal integrity, decreasing closer to the tumor area. This finding is consistent with the previous data published by other authors [6,23]. Previous studies have also shown that FA decreases closer to the tumor, but it remains unclear whether these changes associated with edema or tumor cell infiltration and whether the FA decrease reflects a decrease of axonal amount [23]. Published morphological studies show that the perifocal area around glial tumors contains not only water molecules, but also invasive tumor cells [18], microglial cells and reactive astrocytes [24]. We observed that in the distant brain areas FA values returned to normal, suggesting that the majority of invasive tumor cells and reactive brain cells surrounded the tumor solid part.
We observed a gradual decrease of Cho/Cr values in the direction from the tumor to the distant and contra-lateral normal appearing white matter. Between all measurement areas the differences of Cho/Cr values were statistically significant. Since Cho levels increase in areas with high cell membrane turnover, such as in the growing tumor [25], it could indicate a gradual decrease in the concentration of tumor cells in the distant peritumoral areas. However, the role of this indicator in various peritumoral areas was different, depending on the distance from the tumor. A statistically significant difference between Cho/Cr measurements in the tumor and perifocal edema zone were most pronounced (p < 0.001), but Cho/Cr ability to differentiate perifocal edema and distal infiltration area, as well as distal and contra-lateral normal signal intensity area was slightly lower (p-values, respectively—0.034 and 0.002). These data suggest that Cho/Cr ratio is less specific indicator of distal peritumoral area where invasive cells have lower concentration. We believe that the Cho/Cr ratio provides additional information on the perifocal edema zone where the tumor cells concentration is higher.
We observed a gradual decrease of MI/Cr values in the direction from the tumor to the distant and contra-lateral normal appearing white matter. Our study finding is consistent with previously published studies, which showed that the MI rate in tumor was higher compared to the same patient's normal signal intensity white matter [26]. However, in our study, MI/Cr ratio showed the lowest diagnostic role in the evaluation of the peritumoral areas. Our findings suggest that MI/Cr ratio was not specific for assessing tumor infiltration neither in edema area, nor in the normal appearing white matter, because in MI/Cr ratio did not show statistically significant difference between the tumor and perifocal edema and between the distal and contra-lateral normal signal intensity white matter. Obviously, this finding is likely indicative of described glial tumor heterogeneous morphology and variable astroglial cell load in glial tumors, perifocal edema and distant white matter. Similarly Chernov with colleagues found no statistically significant differences between the tumor and peritumoral brain tissue [27].
We observed a gradual decrease of LL/Cr values in the direction from the tumor to the distant and contra-lateral normal appearing white matter. Between all measurement areas the differences of LL/Cr values were statisticcally significant. These statistically significant differences were most pronounced in all measurement areas (p < 0.001) compared with the rest of MRS and DTI quantitative measurements, which could indicate that the LL/Cr measurement is the most specific in determination of tumor cell infiltration. LL/Cr is an important indicator of the distant normal appearing white matter evaluation, because this zone in structural MRI sequences is not different from the contra-lateral normal white matter, but in the MRS images we observed the anaerobic glycolysis suggesting a tumor-specific metabolism, i.e., a potential tumor cell infiltration in areas that directly localized around the tumor. Our results of the gradual decrease in LL/Cr values from the tumor towards the periphery agrees with to published morphological observations— most gliomas recur within 2.5 cm from the edges of the resection [4], where histologically individual invasive cells were identified [6]. In this study we made measurements in the distal normal signal intensity zone within 1cm from perifocal edema border (measured from the tumor solid parts, it varied in several centimeters, depending on the amount of edema). We believe that the results of our study tumor resection amount could affect slightly, because, under the current approach, the neurosurgeon removes the tumor within visible abnormal brain tissue borders according the structural MRI and intra-operative appearance, maximally maintaining a visually intact brain tissue. Our findings are more likely to help the nonsurgical treatment choice, especially in radiation therapy planning, when the potential of tumor cells infiltrating in normal signal intensity area at least 1 cm away from the borders of edema should take into account.
Summarizing MRS and DTI results of the tumor and surrounding brain tissues, which could indicate a tumor cell infiltration among all measurement areas, Cho/Cr, NAA/Cr, LL/Cr and FA values, were statistically significantly different. LL/Cr and FA differences were particularly evident in the distinguishing between different brain areas surrounding the tumor. MI/Cr measurements showed a lower diagnostic importance, because they were not different between the tumor and perifocal edema, as well as between the distal and contra-lateral normal signal intensity area.
As indicated by previous studies [7,25], MRS demonstrated lipid levels correlate with the histologically observable degree of necrosis. Our research data could indicate that LL/Cr ratio is a sensitive in early detection of individual tumor cell perifocal infiltration. However, it should be noted that the majority of patients in our study received radiation and chemotherapy, so LL/Cr changes might be partly due to treatment effects [28]. To determine whether MRS and DTI measurements were affected by prior treatment, we separately analyzed the glial tumor patients before and after received radiotherapy/chemotherapy.
Compared MRS metabolites and FA measurements between glial tumor patients before radiotherapy/chemotherapy and patients after radiotherapy/chemotherapy with residual tumor tissue, we observed statistically significant differences only in LL/Cr ratios within distal normal appearing white matter. LL/Cr in this area after received therapy had reduced, presumably due to the alteration of brain metabolic type in the distal areas of glioma—the metabolically active tumor cells decreased in a given area. This parameter has also decreased slightly in patients with clinical and radiological remission period, when a residual tumor tissue was no longer detectable with structural MRI method, although the decrease in both groups was not statistically significantly different. Thus, our findings indicate LL/Cr ratio importance of evaluating treatment effects—reduced LL/Cr in distal normal signal intensity area suggestive of a positive treatment effect. These results confirm our hypothesis that peripheral areas around gliomas have a higher concentration of vital tumor cells; and the received nonsurgical therapy positive effects can be observed in these areas. Necrotic changes and a small number of vital cells were observed in tumor central areas, and therefore received treatment did not affect the biochemistry in this area. Other MRS parameters and FA values in any of the areas measured showed no statistically significant difference in patients before and after combined therapy, which in turn might suggest the less importance of these parameters in determining the effect of treatment. It should be noted that probably these results were also affected by the imbalance in the number of patients in both groups.
Several limitations of our study have to be mentioned: First, relative heterogeneous tumor histopathology [5], which may affect the MRS and DTI quantitative measurements, as they may vary within the same tumor. Second, lack of morphological conformation of glioma cells invasion in perifocal edema and distant normal appearing white matter. Previous study of autopsy material indicates that invasive tumor cells were identified several centimeters of malignant glioma lodges, where the small anaplastic cells and fibrillar cells were found [29]. Third, although Cr is considered to be the most stable metabolite used in the calculation of the ratio of metabolites, there are indications in the literature that tumors may also experience reduced levels of Cr, its level can vary in different areas of the same tumor, increased Cr levels may be observed in hypometabolic areas and decreased in hypermetabolic areas of the same tumor [30]. Fourth, the limit could be considered regarding a relatively small number of patients before radiation/chemotherapy.
5. CONCLUSIONS
1) MRS and DTI quantitative measurements in glioma peritumoral area reveal pathological changes, despite the normal signal intensity on structural MRI;
2) MRS and DTI in combination with structural MRI examination sequences enhance vital glial tumor cells areas and possible infiltration border;
3) Increased LL/Cr ratios and decreased FA values have superior implications in detecting glial tumors extent along the white matter tracts. NAA/Cr reduction and Cho/Cr increase may provide additional diagnostic value;
4) LL/Cr ratio in distal normal signal intensity area could be used as radiation/chemotherapy effectiveness criteria, as this will reduce after the received treatment and in remission stage.
6. ACKNOWLEDGEMENTS
The authors would like to thank Daina Apskalne PhD for the carefully conducted morphological analyses. This work was supported by European Social Fund in Latvia (grant number 2009/0147/1DP/1.1.2.1.2/ 09/IPIA/VIAA/009).

REFERENCES
- Wright, A.J., Fellows, G., Byrnes, T.J., Opstad, K.S., McIntyre, D.J.O., Griffithsm, J.R., Bell, B.A., Clark, C.A., Barrick, T.R. and Howe, F.A. (2009) Pattern recognition of MRSI data shows regions of glioma growth that agree with DTI markers of brain tumor infiltration. Magnetic Resonance in Medicine, 62, 1646-1651. doi:10.1002/mrm.22163
- Garteiser, P., Doblas, S., Watanabe, Y., Saunders, D., Hoyle, J., Lerner, M., He, T., Floyd, R.A. and Towner, R.A. (2010) Multiparametric assessment of the anti-glioma properties of OKN007 by magnetic resonance imaging. Journal of Magnetic Resonance Imaging, 31, 796- 806. doi:10.1002/jmri.22106
- Kostron, H. and Bauer, R. (2011) Management of recurrent malignant glioma—Neurosurgical strategies. Wiener Medizinische Wochenschrift, 161, 20-21. doi:10.1007/s10354-010-0861-7
- Huang, J., Chen, K., Chen, J., Gong, W., Dunlop, N.M., Howard, O.M., Gao, Y., Bian, X.W. and Wang, J.M. (2010) The G-protein-coupled formylpeptide receptor FPR confers a more invasive phenotype on human glioblastoma cells. British Journal of Cancer, 102, 1052-1060. doi:10.1038/sj.bjc.6605591
- Nelson, S.J. (2011) Assessment of therapeutic response and treatment planning for brain tumors using metabolic and physiological MRI. NMR Biomedicine, 24, 734-749.
- Goebell, E., Fiehler, J., Ding, X.Q., Paustenbach, S., Nietz, S., Heese, O., Kucinski, T., Hagel, C., Westphal, M. and Zeumer, H. (2006) Disarrangement of fiber tracts and decline of neuronal density correlate in glioma patients—A combined diffusion tensor imaging and 1H-MR spectroscopy study. American Journal of Neuroradiology, 27, 1427-1431.
- Bonicelli, C., Bacci, A., Agati, R. and Leonardi, M. (2009) Potential of high field functional MRI in the neuroradiological diagnosis of brain tumours. The Neuroradiology Journal, 22, 534-545.
- Sundgren, P.C., Nagesh, V., Elias, A., Tsien, C., Junck, L., Hassan, G.D.M., Lawrence, T.S., Chenevert, T.L., Rogers, L., McKeever, P. and Cao, Y. (2009) Metabolic alterations: A biomarker for radiation-induced injury of normal brain. An MR spectroscopy study. Journal of Magnetic Resonance Imaging, 29, 291-297. doi:10.1002/jmri.21657
- Costanzo, A.D., Scarabino, T., Trojsi, F., Popolizio, T., Catapano, D., Giannatempo, G.M., Bonavita, S., Portaluri, M., Tosetti, M., Angelo, V.A., Salvolini, U. and Tedeschi, G. (2008) Proton MR spectroscopy of cerebral gliomas at 3T: Spatial heterogeneity, and tumour grade and extent. European Radiology, 18, 1727-1735. doi:10.1007/s00330-008-0938-5
- Oshiro, S., Tsugu, H., Komatsu, F., Abe, H., Onishi, H., Ohmura, T., Iwaasa, M., Sakamoto, S. and Fukushima, T. (2007) Quantitative assessment of gliomas by proton magnetic resonance spectroscopy. Anticancer Research, 27, 3757-3764.
- Sundgren, P.C. (2009) MR spectroscopy in radiation injury. American Journal of Neuroradiology, 30, 1469- 1476. doi:10.3174/ajnr.A1580
- Kallenberg, K., Bock, H., Helms, G., Jung, K., Wrede, A., Buhk, J.H., Giese, A., Frahm, J., Strik, H., Dechent, P. and Knauth, M. (2009) Untreated glioblastoma multiforme: Increased myo-inositol and glutamine levels in the contralateral cerebral hemisphere at proton MR spectroscopy. Radiology, 253, 805-812. doi:10.1148/radiol.2533071654
- Walecki, J., Tarasow, E., Kubas, B., Czemicki, Z., Lewko, J., Podgorski, J., Sokol, M. and Grieb, P. (2003) Hydrogen-1 MR spectroscopy of the peritumoral zone in patients with cerebral glioma: Assessment of the value of the method. Academic Radiology, 10, 145-153. doi:10.1016/S1076-6332(03)80038-7
- Louis, D.N., Ohgaki, H., Wiestler, O.D., Cavenee, W.K., Burger, P.C., Jouvet, A., Scheithauer, B.W. and Kleihues, P. (2007) The 2007 WHO classification of tumours of the central nervous system. Acta Neuropathologica, 114, 97- 109. doi:10.1007/s00401-007-0243-4
- Weybright, P., Sundgren, P.C., Maly, P., Hassan, D.G., Nan, B., Rohrer, S. and Junck, L. (2005) Differentiation between brain tumor recurrence and radiation injury using MR spectroscopy. American Journal of Roentgenology, 185, 1471-1476. doi:10.2214/AJR.04.0933
- Huang, J., Wang, A.M., Shetty, A., Maitz, A.H., Yan, D., Doyle, D., Richey, K., Park, S., Pieper, D.R., Chen, P.Y. and Grills, I.S. (2011) Differentiation between intra-axial metastatic tumor progression and radiation injury following fractionated radiation therapy or stereotactic radiosurgery using MR spectroscopy, perfusion MR imaging or volume progression modeling. Magnetic Resonance Imaging, 29, 993-1001. doi:10.1016/j.mri.2011.04.004
- Smith, E.A., Carlos, R.C., Junck, L.R., Tsien, C.I., Elias, A. and Sundgren, P.C. (2009) Developing a clinical decision model: MR spectroscopy to differentiate between recurrent tumor and radiation change in patients with new contrast-enhancing lesions. American Journal of Roentgenology, 192, 45-52. doi:10.2214/AJR.07.3934
- Wang, W., Stewarda, C.E. and Desmonda, P.M. (2009) Diffusion tensor imaging in glioblastoma multiforme and brain metastases: the role of p, q, L, and fractional anisotropy. American Journal of Neuroradiology, 30, 203- 208. doi:10.3174/ajnr.A1303
- Bulakbasi, N., Kocaoglu, M., Ors, F., Tayfun, C. and Ucoz, T. (2003) Combination of single-voxel proton MR spectroscopy and apparent diffusion coefficient calculation in the evaluation of common brain tumors. American Journal of Neuroradiology, 23, 225-233.
- Iliescu, B., Negru, D. and Poeata, I. (2010) MR tractography for preoperative planning in patients with cerebral tumors in eloquent areas. Romanian Neurosurgery, 17, 413-420.
- Callot, V., Galanaud, D., Fur, Y.L., Gouny, S.C., Ranjeva, J.P. and Cozzone, P.C. (2008) 1H MR spectroscopy of human brain tumours: A practical approach. European Journal of Radiology, 67, 268-274. doi:10.1016/j.ejrad.2008.02.036
- Yen, P.S., Teo, B.T., Chiu, C.H., Chen, S.C., Chiu, T.L. and Su, C.F. (2009) White matter tract involvement in brain tumors: A diffusion tensor imaging analysis. Surgical Neurology, 72, 464-469. doi:10.1016/j.surneu.2009.05.008
- Romano, A., Fasoli, F., Ferrante, M., Ferrante, L., Fantozzi, L.M. and Bozzao, A. (2008) Fiber density index, fractional anisotropy, ADC and clinical motor findings in the white matter of patients with glioblastoma. European Radiology, 18, 331-336. doi:10.1007/s00330-007-0740-9
- Engelhorn, T., Savaskan, N.E., Schwarz, M.A., Kreutzer, J., Meyer, E.P., Hahnen, E., Ganslandt, O., Dorfler, A., Nimsky, C., Buchfelder, M. and Eyupoglu, I.Y. (2009) Cellular characterization of the peritumoral edema zone in malignant brain tumors. Cancer Science, 100, 1856- 1862. doi:10.1111/j.1349-7006.2009.01259.x
- Yamasaki, F., Kurisu, K., Kajiwara, Y., Watanabe, Y., Takayasu, T., Akiyama, Y., Saito, T., Hanaya, R. and Suqiyama, K. (2011) Magnetic resonance spectroscopic detection of lactate is predictive of a poor prognosis in patients with diffuse intrinsic pontine glioma. Neuro-Oncology, 13, 791-801. doi:10.1093/neuonc/nor038
- Salzedo, E., Cortes, M.P., Melancon, D. and Tampieri, D. (2009) Myoinositol trends in different types of brain lesions. The Neuroradiology Journal, 22, 16-21.
- Chernov, M.F., Kubo, O., Hayashi, M., Izawa, M., Maruyama, T., Usukura, M., Ono, Y., Hori, T. and Takakura, K. (2005) Proton MRS of the peritumoral brain. Journal of Neurological Sciences, 22, 137-142. doi:10.1016/j.jns.2004.11.039
- Gerstner, L., Jellinger, K., Heiss, W.D. and Wober, G. (1977) Morphological changes in anaplastic gliomas treated with radiation and chemotherapy. Acta Neurochirurgica, 36, 117-138. doi:10.1007/BF01405993
- Tamura, M., Ohye, C. and Nakazato, Y. (1993) Pathological anatomy of autopsy brain with malignant glioma. Neurologia Medico-Chirurgica, 33, 77-88. doi:10.2176/nmc.33.77
- Yerli, H., Ağıldere, A.M., Özen, O., Geyik, E., Atalay, B. and Elhan, A.H. (2007) Evaluation of cerebral glioma grade by using normal side creatine as an internal reference in multi-voxel 1H-MR spectroscopy. Diagnostic and Interventional Radiology, 13, 3-9.