Journal of Biomedical Science and Engineering
Vol. 5 No. 10 (2012) , Article ID: 23779 , 6 pages DOI:10.4236/jbise.2012.510070
3D volume extraction of cerebrovascular structure on brain magnetic resonance angiography data sets
![]()
Department of Computer Engineering, Sunchon National University, Sunchon, Republic of Korea
Email: dykim@sunchon.ac.kr
Received 9 July 2012; revised 10 August 2012; accepted 23 August 2012
Keywords: Cerebrovascular Structure; Medical Image Segmentation; Preserved Voxel Connectivity
ABSTRACT
The use of computers in facilitating their processing and analysis has become necessary with the increaseing size and number of medical images. In particular, computer algorithms for the delineation of anatomical structures and other regions of interest, which are called image segmentation, play a vital role in numerous biomedical imaging applications such as the quantification of tissue volumes, diagnosis, localization of pathology, study of anatomical structure, treatment planning, and computer-integrated surgery. In this paper, a 3D volume extraction algorithm was proposed for segmentation of cerebrovascular structure on brain MRA data sets. By using a priori knowledge of cerebrovascular structure, multiple seed voxels were automatically identified on the initially thresholded image. In the consideration of the preserved voxel connectivity—which is defined as 6-connectivity with joint faces, 18-connectivity with joint edges, and 26-connectivity with joint corners— the seed voxels were grown within the cerebrovascular structure area throughout 3D volume extraction process. This algorithm provided better segmentation results than other segmentation methods such as manual, and histogram thresholding approach. This 3D volume extraction algorithm is also applicable to segment the tree-like organ structures such as renal artery, coronary artery, and airway tree from the medical imaging modalities.
1. INTRODUCTION
The human cerebrovascular system is a complex threedimensional anatomical structure. Serious types of cerebrovascular diseases such as carotid stenosis, aneurysm, and vascular malfunction may lead to brain stroke, which is the third leading cause of death and a principal cause of long-term disability in much of the industrialized world [1]. Therefore, an accurate model of the vascular system from medical imagery data volume is needed to detect these diseases at early stage and to prevent invasive treatments. With rapid advances in the field of medical imaging, Computed Tomography (CT), Magnetic Resonance Imaging (MRI), digital mammography, and other imaging modalities provide an effective means for non-invasively mapping the anatomy of a subject. These technologies have greatly increased knowledge of normal and diseased anatomy for medical research and are a critical component in diagnosis and treatment planning. With the increasing size and number of medical images, the use of computers in facilitating their processing and analysis has become necessary.
In particular, computer algorithms for the delineation of anatomical structures and other regions of interestare key component in assisting and automating specific radiological tasks. These algorithms, called imagesegmentation, play a vital role in numerous biomedical imaging applications such as the quantification of tissue volumes, diagnosis, localization of pathology, study of anatomical structure, treatment planning, and computerintegrated surgery [2]. In this paper, a 3D volume extraction algorithm was proposed for segmentation of cerebrovascular structure on brain MRA data sets. Section 2 describes the previous works related to blood vessel extraction and segmentation on medical imagery from various imaging modalities. Section 3 describes the 3D volume extraction of cerebrovascular structure. Section 4 describes other segmentation methods and results for performance evaluation of proposed segmentation approach. In Section 5, experimental segmentation results on clinical datasets are presented. Finally, Section 6 provides some discussions and concluding remarks.
2. RELATED WORKS
Blood vessel delineation on medical images forms an essential step in solving several practical applications such as diagnosis of the vessels (e.g. stenosis or malformations) and registration of patient images obtained at different times. Blood vessel segmentation algorithms are the key components of automated radiological diagnostic systems. Segmentation methods vary depending on the imaging modality, application domain, method being automatic or semi-automatic, and other specific factors [3].
The segmentation of cerebrovascular structure has been conducted on conventional angiograms, phase contrast magnetic resonance angiogram, and 3D time-offlight (TOF) magnetic resonance angiography. Wilson et al. [4,5] developed automatic statistically based algorithm for extracting the 3D vessel information from TOF MRA data. They introduce distributions for the data, motivated by a physical model of blood flow, that are used in a modified version of the expectation maximizetion (EM) algorithm. The estimated model parameters are then used to classify the voxels statistically into vessels or other brain tissue classes. The algorithm is adaptive because the model fitting is performed recursively so that classifications are made on local subvolumes of data. Chung et al. [6,7] presents a statistical approach to aggregating speed and phase (directional) information for vascular segmentation of phase contrast magnetic resonance angiograms (PC-MRA). Rather than relying on speed information alone, they demonstrate that including phase information as a priori knowledge in a Markov random field (MRF) model can improve the quality of segmentation. They propose to use a Maxwell-Gaussian mixture density to model the background signal distribution and combine this with a uniform distribution for modeling vascular signal to give Maxwell-Gaussianuniform (MGU) mixture model of image intensity. Hassouna et al. [8] also present an automatic statistical approach for extracting 3D blood vessels from TOF magnetic resonance angiography data. The voxels of the dataset are classified as either blood vessels or background noise. Two stochastic processes model the observed volume data. The low level process characterizes the intensity distribution of the data, while the high level process characterizes their statistical dependence among neighboring voxels. A finite mixture of one Reyleigh and two normal distributions models the low level process of the background signal, while the blood vessels are modeled by one normal distribution.
3. CEREBROVASCULAR STRUCTURE SEGMENTATION
MRI uses radio frequency waves and a strong magnetic field rather than x-rays to provide remarkably clear and detailed pictures of internal organs and tissues. Magnetic resonance angiography (MRA) is a noninvasive MRIbased flow imaging technique. Its wide variety of acquisition sequences and techniques use to detect, diagnose and aid the treatment of heart disorders, stroke and blood vessel diseases. It provides detailed images of blood vessels without any contrast material, and the signal intensity of these images is proportional to the velocity of the blood flow. In this paper, the 3D time-of-flight (TOF) of MRA brain images from GE Signa Excite scanner are used to automatically segment the cerebrovascular structure.
3.1. Image Volume Analysis
Conventional CT and MRI scans produce axial slices of the body that are viewed sequentially by radiologists who must visualize or extrapolate from these views what the actual 3D anatomy should be. These axial slice images can be modeled by a continuous function of two or three variables; in the 2D case arguments are coordinates  in a plane, while if images are expanded to 3D a third variable might be added as follows. The image volume V, called image sequence function, defined
 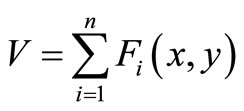 , where F is 2D image function, n is image sequence number, x and y are spatial coordinates. The image analysis involves manipulating the image data to determine exactly the information necessary to solve an image application problem, and rendering quantitative measurements from an image to produce a description, and to make a sophisticated decision [9,10]. Figure 1 shows the transverse slice images of 3D TOF brain MRA data sets, which provide fact that blood vessels are brighter than surrounding tissues and background. This is the nature of MRA scanning protocol that focus on the blood flow area and suppresses the signal intensity of surrounding tissues. MRA is a non-invasive MRI-based flow imaging technique, and it provides images of blood vessels in detail without any contrast agent. Its wide variety of acquisition sequences and techniques, beside its ability to provide detailed images of blood vessels, enabled its use in the diagnosis and surgical planning of the cerebrovascular diseases.
In comparison with background area and surrounding tissues in Figure 1, blood flow area is small portion of the image, which might be indicated in the histogram that plots the frequency of intensity occurrence in the image [11,12].
3.2. Seed Selection Process
Thresholding is often used as an initial step in the pipeline operation of image processing. In case of the background and object occupy comparable areas in the image; a good initial threshold value is the average gray level of the image. On the contrary, if the objects are small compared to the area occupied by the background (or vice versa), then one group of pixels will dominate the histo-
 (a)
(a)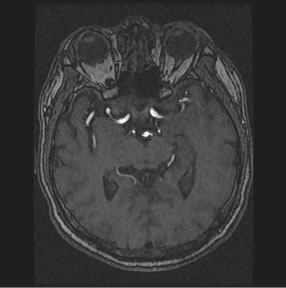 (b)
(b)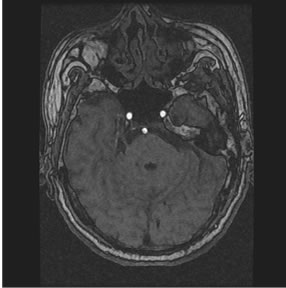 (c)
(c)
Figure 1. Axial sequence images of 3D TOF brain MRA data set.
gram and the average gray level is not as good an initial choice. A more appropriate initial threshold value is a midway value between the maximum and minimum gray levels. Therefore, first sequence image initially binarized with threshold value , where h is the number of bits for representation of each pixel, to determine the region growing seed. This 2D image can be transformed with threshold value T from an input image F to an output binary image G as follows;
  for image elements of objects where
 , and
, and  for image elements for the background where
 . These multiple region-growing seeds are used to extract the cerebrovascular structure on brain MRA data sets.
3.3. Vessel Volume Extraction
The region growing is a procedure that group pixels or sub-regions into larger regions based on predefined criteria. The basic approach is to start with a set of “seed” points and from these grow regions by appending to each seed those neighboring pixels that have properties similar to the seed, such as specific ranges of gray level or color [13]. A region is a connected set of pixels, that is, a set in which all the pixels are adjacent or neighboring in the 2D image space. The definition of connectedness is as follows: between any two pixels in a connected set, there exists a connected path wholly within the set, where a connected path is that which always moves between neighboring pixels. Thus, in a connected set, one can trace a connected path between any two pixels without ever leaving the set. There are two rules of connectivity, and either one can be adopted. If only laterally adjacent the pixels (up, down, left, right) are considered to be connected, this is four-connectivity, and objects are four-connected. In addition, if diagonally adjacent (45˚ neighbor) the pixels are also considered to be connected, one has eight-connectivity and the objects are eight connected [14]. In 3D image volume V, the voxel connectivity is defined as the following: 1) 6-connectivity with joint faces, 2) 18-connectivity with joint edges, and 3) 26-connectivity with joint corners. The 3D volume growing method [12,13,15,16] performed the homogeneous test from the start voxel (or 3D block) to the neighbor voxel (or 3D block) using gray-level, texture, color as an acceptance criterion, and included or excluded the neighbor voxel (or 3D block) according to the homogeneous test result until termination condition is satisfied.
4. VALIDATION STUDY THROUGH MANUAL AND THRESHOLDING METHOD
The validation experiments are necessary to quantify the performance of proposed segmentation method and— specific medical image processing such as registration and visualization. Validation is typically performed using one of two different types of truth models. The most straightforward approach to validation of segmentation, for instance, is by comparing the automated-segmentation with manually obtained segmentation [17,18]. Figures 2(a)-(c) show the 3D reconstructed images of cerebrovascular structure using the manual segmentation results where virtual camera was position at 330˚, 0˚, and 30˚ in longitudinal direction, respectively. The other common approach to validating segmentation methods is by use of physical phantom [19] or computational phantoms which consisting of digital (voxel-based) phantom [20,21] and mathematical (analytical) phantom [22]. Physical phantoms provide an accurate depiction of the image acquisition process but typically do not present a realistic representation of anatomy. On the contrary, whereas digital phantoms are mainly derived from segmented tomographic images of the human anatomy obtained by either CT or MRI, mathematical phantoms consist of regularly shaped continuous objects defined by combinations of mathematical geometries such as spheres, ellipsoids, cylinders, and cones. Although anatomically less realistic than digital phantoms derived from CT or MRI images of patients, the mathematical phantom has the advantage that it can be easily modified to simulate a wide variety of patient anatomies. Furthermore, the combined approach that synthesizes the digital phantom with geometric model of specific human organ provides realistic simulation of tomographic image sequence; and
 (a)
(a) (b)
(b)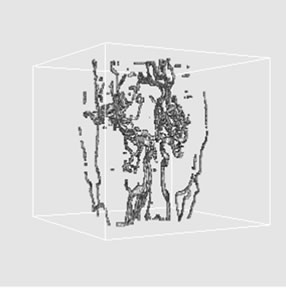 (c)
(c)
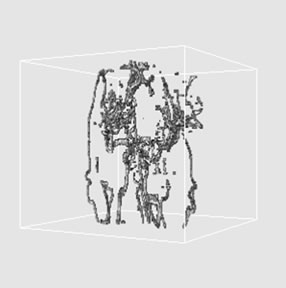
Figure 2. 3D reconstructed images of cerebrovascular structure using the manual segmentation results where virtual camera was positioned at (a) 330˚, (b) 0˚, and (c) 30˚ in longitudinal direction.
the modifications such as identifying particular structures, adding pathologies, and highlighting activation are easily performed [23]. However, here we provide the other segmentation results using histogram thresholding for validation study. The thresholding techniques, which make decisions based on local pixel information, are effective when the intensity levels of the objects fall squarely outside the range of levels in the background. Thresholding is a pixel classification process to identify the pixels of a given image into two classes: those pertaining to objects and those pertaining to background. While one class includes pixels with intensity values that are below or equal to a certain threshold value, the remaining class includes those pixels with intensity values above the threshold. Correct threshold value selection is crucial for successful segmentation; this selection can be determined interactively or it can be the result of automatic threshold detection method [24]. Figures 3(a)-(c) show the 3D reconstructed images of cerebrovascular structure using the results of histogram thresholding where virtual camera was positioned at 330˚, 0˚, and 30˚ in longitudinal direction, respectively.
5. RESULTS
The Intel P4 processor with MS Windows and Visual C++ were used to extract the cerebrovascular structure on brain MRA data sets. This algorithm was applied on the clinical data sets of 3D time-of-flight (TOF) MRA images from GE Signa Excite scanner. Each case consists of 148 axial images and the dimension of image is 512 × 512 pixels, pixel spacing is 0.43 mm and slice thickness is 1.4 mm.
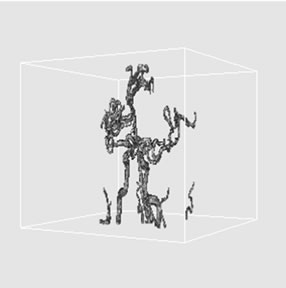
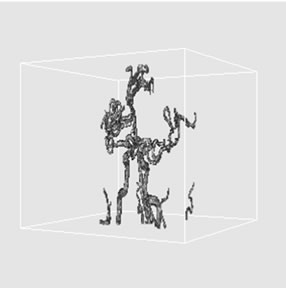
As a result of cerebrovascular structure extraction by using 3D region growing algorithm, Figures 4(a)-(c) show the 3D volume extraction results of cerebrovascular structure using 6-connectivity feature where virtual camera was positioned at 330˚, 0˚, and 30˚ in longitudenal direction, respectively. In addition, Figures 5 and 6 show the extracted cerebrovasculature using 18-connectivity and 26-connectivity features with ray casting algorithm, respectively. The ray casting is one of the volume
 (a)
(a)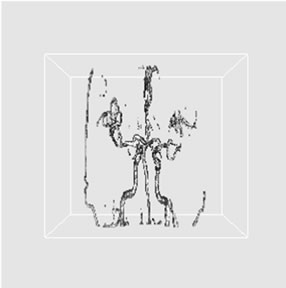 (b)
(b)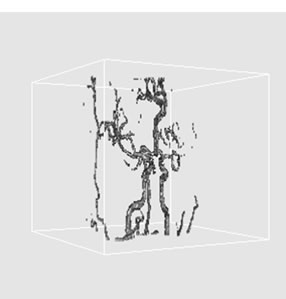 (c)
(c)
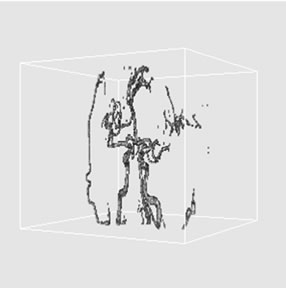
Figure 3. 3D reconstructed images of cerebrovascular structure using the histogram thresholding results where virtual camera was positioned at (a) 330˚, (b) 0˚, and (c) 30˚ in longitudinal direction.
 (a)
(a)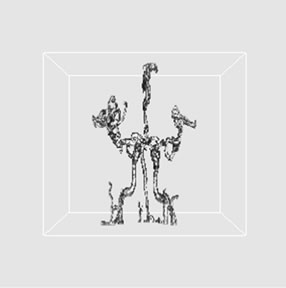 (b)
(b)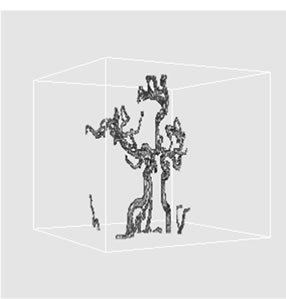 (c)
(c)
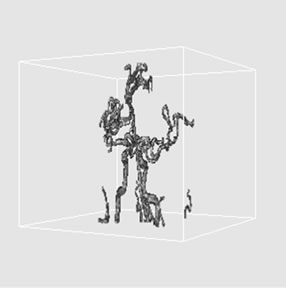
Figure 4. 3D volume extraction results of cerebrovascular structure using 6-connectivity feature where virtual camera was positioned at (a) 330˚, (b) 0˚, and (c) 30˚ in longitudinal direction.
 (a)
(a)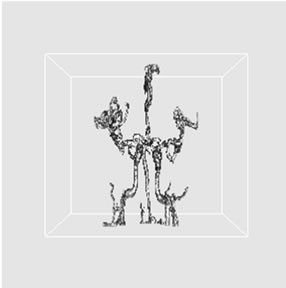 (b)
(b)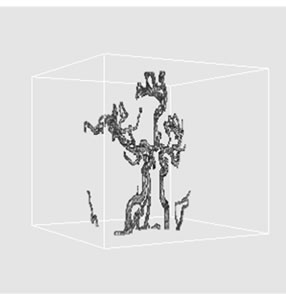 (c)
(c)
Figure 5. 3D volume extraction results of cerebrovascular structure using 18-connectivity feature where virtual camera was positioned at (a) 330˚, (b) 0˚, and (c) 30˚ in longitudinal direction.
 (a)
(a) (b)
(b) (c)
(c)
Figure 6. 3D volume extraction results of cerebrovascular structure using 26-connectivity feature where virtual camera was positioned at (a) 330˚, (b) 0˚, and (c) 30˚ in longitudinal direction.
rendering techniques using backward projection. Rays are cast from each pixel of the image plane into the volume data. At locations along each ray, a sample value and a surface normal approximation are calculated using values of surrounding voxels. Using the sample value and normal, a sample opacity and color are dynamically assigned by a lookup table or in a preprocessing phase. Then a local shading model is applied and the samples along the ray are composed into a pixel value of the final image [25,26]. By applying the ray-casting algorithm with perspective projection technique, these provide fine 3D volume extraction results of cerebrovascular structure. For the purpose of comparing the proposed vessel extraction method with other segmentation approach, the number of voxels from each segmentation result was provided. The voxel counts are as follows: 53.4 K voxels from manual segmentation, 39.3 K voxels from histogram thresholding, and proposed 3D volume extraction method with 6-connectivity (60.8 K voxels), 18-connectivity (61.78 K voxels), 26-connectivity (61.79 K voxels). These provided fact that there was a little increase in the total number of voxels, as the voxel connectivity was increased.
6. DISCUSSION AND CONCLUSIONS
The segmentation of regions is an important first step for various image related application and visualization tasks. Particularly, the computer algorithms for the delineation of anatomical structures and other regions of interest are an important component in assisting and automating specific radiological tasks [2]. The region growing is classified into multiple ways for color image segmentation [27,28], for geographical applications [29,30], medical applications [31,32], and for automatic features of seed selection [33,34].
A 3D volume extraction algorithm was proposed for segmentation of cerebrovascular structure. This method provides the new features that automatically locate the multiple seed voxels using a priori knowledge from anatomic structure of brain vessels. The seed voxels were automatically selected in the initially thresholded image by using a priori knowledge of cerebrovascular structure. In consideration of the preserved voxel connectivity— which defined as 6-connectivity with joint faces, 18- connectvity with joint edges, and 26-connectivity with joint corners—the selected seed voxels were grown within the cerebrovascular structure area throughout 3D volume extraction process. Compared with manual segmentation approach and histogram thresholding method, this algorithm provides fine segmentation results by applying 3D volume extraction approach with automatic seed voxels selection features. The segmentation process on medical imagery from various imaging modalities is an initial and very essential step for useful clinical applications. These segmentation results are also used to implement the medical applications such as the quantification of tissue volumes, diagnosis, localization of pathology, study of anatomical structure, treatment planning, and computer-integrated surgery. Although no single segmentation method that yields acceptable results for all kinds of medical image modalities, the proposed 3D volume extraction algorithm is also applicable to extract the tree-like organ structures such as renal artery, coronary artery, and airway tree on the medical image.
REFERENCES
- Biller, J. and Thies, W.H. (2000) When to operate in ca- rotid artery disease. American Family Physician, 61, 400-410.
- Pham, D.L., Xu, C. and Prince, J.L. (2000) Current method in medical image segmentation. Annual Review of Biomedical Engineering, 2, 315-337. doi:10.1146/annurev.bioeng.2.1.315
- Kirbas, C. and Quek, F. (2004) A review of vessel extraction techniques and algorithms. ACM Computing Surveys, 36, 81-121. doi:10.1145/1031120.1031121
- Wilson, D.L. and Nobel, J.A. (1997) Segmentation of cerebral vessels and aneurysms MR angiography data. Image Processing Medical Imaging Conference, 1230, 423-428. doi:10.1007/3-540-63046-5_37
- Wilson, D.L. and Nobel, J.A. (1999) An adaptive segmentation algorithm for time-of-flight MRA data. IEEE Transactions on Medical Imaging, 18, 938-945. doi:10.1109/42.811277
- Chung, A.C.S., Nobel, J.A. and Summers, P. (2002) Fusing speed and phase information for vascular segmentation of phase contrast MR angiograms. Medical Image Analysis, 6, 109-128. doi:10.1016/S1361-8415(02)00057-9
- Chung, A.C.S., Nobel, J.A. and Summers, P. (2004) Vascular segmentation of phase contrast magnetic resonance angiograms based on statistical mixture modeling and local phase coherence. IEEE Transaction on Medical Imaging, 23, 1409-1507. doi:10.1109/TMI.2004.836877
- Hassouna, M.S., Farag, A.A., Hushek, S. and Moriarty, T. (2006) Cerebrovascular segmentation from TOF using stochastic models. Medical Image Analysis, 10, 2-18. doi:10.1016/j.media.2004.11.009
- Umbaugh, S.E. (1998) Computer Vision and Image Processing. Prentice Hall, New Jersey.
- Jain, A.K. (1989) Fundamentals of Digital Image Processing. Prentice Hall, New Jersey.
- Calotto, M.J. (1987) Histogram analysis using a scalespace approach. IEEE Transactions on Pattern Analysis and Machine Intelligence, 9, 121-129. doi:10.1109/TPAMI.1987.4767877
- Parker, J.R. (1997) Algorithm for image processing and computer vision. John-Wiley & Sons, New York.
- Sonka, M., Hlavac, V. and Boyle, R. (1999) Image processing, analysis, and machine vision. PWS Publishing, Pacific Grove.
- Castleman, K.R. (1996) Digital image processing. Prentice-Hall, New Jersey.
- Adams, R. and Bischof, L. (1994) Seeded region growing. IEEE Transactions on Pattern Analysis and Machine Intelligence, 16, 641-647. doi:10.1109/34.295913
- Mehnert, A. and Jackway, P. (1997) An improved seeded region growing algorithm. Pattern Recognition Letters, 18, 1065-1071. doi:10.1016/S0167-8655(97)00131-1
- Vaidyanathan, M., Clarke, L.P., Hall, L.O., Heidtman, C. and Velthuizen, R. (1997) Monitoring brain tumor re sponse to therapy using MRI segmentation. Magnetic Resonance Imaging, 15, 323-334. doi:10.1016/S0730-725X(96)00386-4
- Wust, P., Gellermann, J., Beier, J., Wegner, S. and Tilly, W. (1998) Evaluation of segmentation algorithms for generation of patient models in radiofrequency hyperthermia. Physics in Medicine and Biology, 43, 3295-3307. doi:10.1088/0031-9155/43/11/009
- Lei, T. and Sewchand, W. (1992) Statistical approach to X-ray CT imaging and its applications in image analysis. IEEE Transaction on Medical Imaging, 11, 62-69. doi:10.1109/42.126911
- Collins, D.L., Zijdenbos, A.P., Kollokian, V., Sled, J.G., Kabani, N.J., Holmes, C.J. and Evans, A.C. (1998) Design and construction of a realistic digital brain phantom. IEEE Transaction on Medical Imaging, 17, 463-468. doi:10.1109/42.712135
- Zubal, I.G., Harrell, C.R. and Smith, E.O. (1994) Computerized 3-dimensional segmented human anatomy. Medical Physics, 21, 299-302. doi:10.1118/1.597290
- Zaidi, H. (1999) Relevance of accurate Monte Carlo modeling in nuclear medical imaging. Medical Physics, 26, 574-608. doi:10.1118/1.598559
- Kim, D.Y. and Park, J.W. (under review). Geometric modeling of cervical artery and digital phantom implementation on tomographic image sequence. Journal of Visual Communication and Image Representation.
- Kim, D.Y. and Park, J.W. (2005) Connectivity-based local adaptive thresholding for carotid artery segmentation using MRA images. Image and Vision Computing, 23, 1277-1287. doi:10.1016/j.imavis.2005.09.005
- Watt, A. (1999) 3D computer graphics. Addison-Wesley, Boston.
- Noordmans, H.J., Voort, A. and Smeulders, A. (2000) Spectral volume rendering. IEEE Transactions on Visualization and Computer Graphics, 6, 196-207. doi:10.1109/2945.879782
- Fan, J., Yau, K.Y., Elmagarmid, A.K. and Aref, W.G. (2001) Automatic image segmentation by integrating color-edge extraction and seeded region growing. IEEE Transaction on Image Processing, 10, 1454-1466. doi:10.1109/83.951532
- Cheng, S.C. (2003) Region-growing approach to colour segmentation using 3-D clustering and relaxation labeling. IEEE Proceedings—Vision Image and Signal Processing, 150, 270-276. doi:10.1049/ip-vis:20030520
- Zhou, Y., Starkey, J. and Mansinha, L. (2004) Segmentation of petrographic images by integrating edge detection and region growing. Computer & Geosciences, 30, 817-831. doi:10.1016/j.cageo.2004.05.002
- Lira, J. and Maletti, G. (2002) A supervised contextual classifier based on a region-growth algorithm. Computers & Geosciences, 28, 951-959. doi:10.1016/S0098-3004(02)00017-1
- Wan, S.Y. and Higgins, W.E. (2003) Symmetric region growing. IEEE Transaction on Image Processing, 12, 1007-1015. doi:10.1109/TIP.2003.815258
- Lu, Y., Jiang, T. and Zang, Y. (2003) Region growing method for the analysis of functional MRI data. Neuro Image, 20, 455-465. doi:10.1016/S1053-8119(03)00352-5
- Grinias, I. and Tziritas, G. (2001) A semi-automatic seeded region growing algorithm for video object localization and tracking. Signal Processing: Image Communication, 16, 977-986. doi:10.1016/S0923-5965(01)00014-5
- Muller, C.R., Peyrin, F., Carrillon, Y. and Odet, C. (2002) Automated 3D region growing algorithm based on an as sessment function. Pattern Recognition Letter, 23, 137-150. doi:10.1016/S0167-8655(01)00116-7