Journal of Biomedical Science and Engineering
Vol. 5 No. 5 (2012) , Article ID: 19403 , 10 pages DOI:10.4236/jbise.2012.55031
Snoring sounds’ statistical characteristics depend on anthropometric parameters
![]()
1Department of Electrical and Computer Engineering, University of Manitoba, Winnipeg, Canada
2TRLabs and Riverview Health Center, Winnipeg, Canada
Email: abarzin@ee.umanitoba.ca, moussavi@ee.umanitoba.ca
Received 7 February 2012; revised 1 March 2012; accepted 21 March 2012
Keywords: snoring sound (SS) segment; higher order statistic; Bispectrum; Median Bifrequency; Skewness; Projected Median Bifrequency; energy
ABSTRACT
Snoring is common in people with obstructive sleep apnea (OSA). Although not every snorer has OSA or vice-versa, many studies attempt to use snoring sounds for classification of people into two groups of OSA and simple snorers. This paper discusses the relationship between snorers’ anthropometric parameters and statistical characteristics of snoring sound (SS) and also reports on classification accuracies of methods using SS features for screening OSA from simple snorers when anthropometric parameters are either matched or unmatched. Tracheal respiratory sounds were collected from 60 snorers simultaneously with full-night Polysomnography (PSG). Energy, formant frequency, Skewness and Kurtosis were calculated from the SS segments. We also defined and calculated two features: Median Bifrequency (MBF), and projected MBF (PMBF). The statistical relationship between the extracted features and anthropometric parameters such as height, Body Mass Index (BMI), age, gender, and Apnea-Hypopnea Index (AHI) were investigated. The results showed that the SS features were not only sensitive to AHI but also to height, BMI and gender. Next, we performed two experiments to classify patients with Obstructive Sleep Apnea (OSA) and simple snorers: Experiment A: a small group of participants (22 OSA and 6 simple snorers) with matched height, BMI, and gender were selected and classified using Naïve Bayes classifier, and Experiment B: the same number of participants with unmatched height, BMI, and gender were chosen for classification. A sensitivity of 93.2% (87.5%) and specificity of 88.4% (86.3%) was achieved for the matched (unmatched) groups.
1. INTRODUCTION
Snoring is a very common disorder mostly associated with obstructive sleep apnea (OSA) syndrome. Overall, 20% - 40% of the general population snore during sleep [1]. By age of 60, snore prevalence increases to 60% in male and 40% in female gender [2]. Although, not every snorer may have OSA (the so-called “simple snorers”) and not everybody with OSA may snore, yet snoring is considered as a major sign of undiagnosed OSA [3]. Thus, many studies attempt to use snoring sounds for classification of people into two groups of OSA and simple snorers. This paper discusses the relationship between snorers’ anthropometric parameters and statistical characteristics of snoring sound (SS), and also reports on classification accuracies of methods using SS features for screening OSA from simple snorers when anthropometric parameters are either matched or unmatched.
Most of the signal processing techniques used for SS analysis, such as autocorrelation/autocovariance function [4,5], power spectrum density (PSD) [3,6], and autoregressive (AR) modeling [3,4] are based on the assumption that a linear model can represent SS and also that the signal-generating process is Gaussian Furthermore, these 2nd order statistical techniques do not analyze the information contained in the signal’s phase. (Note that, henceforth, the terms linear, nonlinear, Gaussian, and nonGaussian signal/segment are being used interchangeably with linear, non-linear, Gaussian, and non-Gaussian signal-generating process).
If the signal of interest, i.e. snoring sounds, violates one of the above assumptions, one should take into account an alternative technique. Higher order statistics (HOS) techniques reveal information on not only amplitude of a signal, but also its phase. Furthermore, if a nonGaussian signal is received along with additive Gaussian noise, a transformation to higher order cumulant domain would be blind to the noise; hence, achieving a cleaner estimate in noisy environments. Thus, the bispectrum and bicoherence can efficiently reveal and quantify any nonlinear relationship among the harmonic peaks (such as phase coupling) [7].
HOS analysis has been used as a tool for screening OSA among snorers [8,9]. However, the effect of anthropometric differences among individuals on snoring sound analysis has not been addressed adequately in the past, while their effect on the accuracy of OSA classification among snorers could be significant. The main objectives of this study were: 1) to investigate how the anthropometric parameters change the snoring sounds, 2) to determine the HOS measures that present significant sensitivity to OSA and other anthropometric changes among individuals, and 3) to investigate the effect of unmatched anthropometric parameters on classification accuracy for screening OSA among snorers. Since many researchers have used the SS features for OSA identification, it is important to investigate whether the same features are also sensitive to anthropometric parameters, i.e. weight, height, gender, etc., among different people. It is important because if they are sensitive, then it implies the classification accuracy might be partly due to unmatched groups in terms of anthropometric parameters.
To achieve the above objectives, we investigated the relationship between spectral and HOS features of SS segments and anthropometric parameters as well as the Gaussianity and linearity properties of the SS. We derived two new features called Median Bifrequency (MBF) and Projected Median Bifrequency (PMBF), and also calculated skewness, kurtosis, 1st formant frequency, and energy of the SS segments. Then, we investigated the statistical relationship between these features and anthropometric parameters using Kendall's Tau-b test [10] and Kruskal-Wallis Analysis of Variance (KWAV) [11, 12]. Lastly, we ran a Naïve Bayes classifier [13] on the features to examine the feasibility of OSA screening using both HOS and common spectral features. For this part of the study, we selected two subsets of the participants: one with matched anthropometric parameters between the OSA and simple snorer groups and the other one with unmatched anthropometric parameter between the two groups.
2. METHOD
2.1. Data Recording
Data for this study was adopted from our previous study
[14]. Out of the 68 participants of that study, data of 60 individuals (15 females, 51.5 ± 11.6 y), who were snorers, were selected for this study. The study was approved by the Ethics Board of the University of Manitoba prior to data collection. Data were recorded simultaneously with full-night Polysomnography (PSG) at the Health Science Center, Winnipeg, participated. The respiratory sounds of the participants were collected by a miniature microphone (ECM-77B) placed over the suprasternal notch of trachea and secured by double adhesive tape and a soft neck band, and were digitized at 10,240 Hz sampling rate. The bit depth was 24. The participants’ anthropometric information of this study is shown in Table 1. The AHI value of each participant was determined by the PSG study scored by the sleep lab technicians.
As known, the respiratory sounds of a snorer consist of breath, loud vibratory sounds (perceived as snore by humans), and/or small segments of silence [5]. We call the part of respiratory sound containing snore (or loud vibratory sounds) as SS segment. The length of each SS segment varies within and between the subjects.
The automatic algorithm proposed in our previous study was used to extract the SS segments in a semiautomated manner [15]. An example of the selection method is as the following: the PSG data provided information about the time (e.g. 3:00 - 3:45 am) when the patient X was snoring (snoring interval). Given this information the snore detection algorithm proposed in Ref. [15] was run either on the entire interval (if <15 minutes) or on a 15-minute interval (if >15 minutes). The snoring intervals shorter than 5 minutes were neglected. Although the method’s accuracy was over 98%, to ensure 100% accuracy of SS segments, all of the detected SS segments were validated by visual (spectrogram) and auditory means, and the misclassified cases were removed.
Overall 24214 of SS segments from all patients were analyzed, which on average corresponded to 10.1 ± 4.2 min of snoring per patient. The average number of SS segments per individual was 462 ± 271. Most (99%) of the extracted snoring sounds occurred during inspiration. The extracted SS segments for each patient were used to estimate the bispectrum and derive the desired features. Figure 1 shows an extracted SS segment along with its spectrogram. It should be noted that the bispectral analysis was only performed on the SS segments.
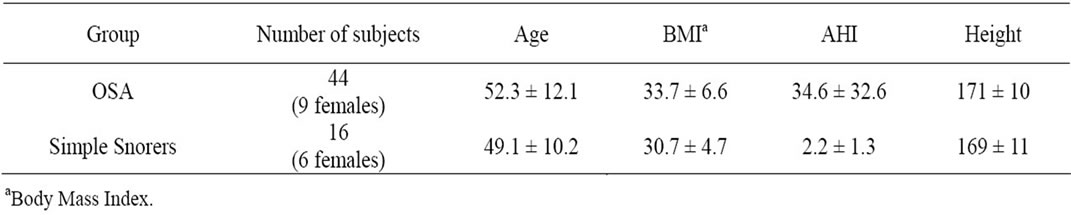
Table 1. Anthropometric information of participating individuals.
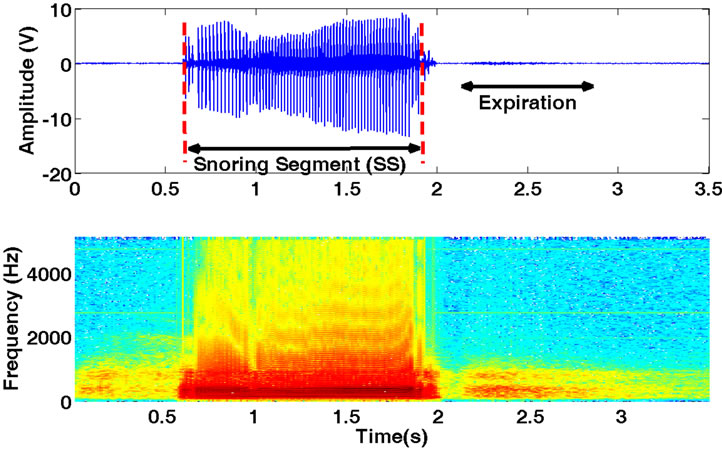
Figure 1. An extracted snoring segment (SS) and its spectrogram.
2.2. Higher Order Statistics (HOS)
Assume that  is an extracted SS segment (in general a random process).
The key assumption underlying the HOS analysis is that the process  is stationary in some sense [7]. Snoring sounds are non-stationary in nature [3]. Hence, all the HOS measures such as bispectrum and bicoherence should be calculated on a short time-windowed version of the signal to ensure stationarity (wide-sense) of the SS segments.
2.2.1. Definition of Bispectrum and Bicoherence
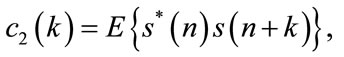
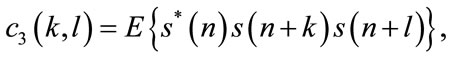
The 2nd, 3rd and 4th order cumulants of a zero-mean stationary process are defined by:
 (1)
(1)
 (2)
(2)
 (3)
(3)
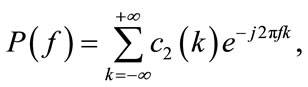
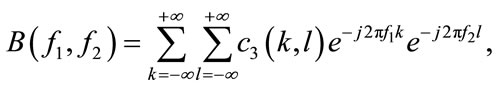
where  is a zero mean stationary process, k, l and m are different time increments, * refers to complex conjugate operator, and c2, c3, c4 denote 2nd, 3rd, and 4th order cumulants respectively [16]. The 2nd and 3rd order polyspectrum are defined as the Fourier Transform of c2 and c3, respectively [16]:
 (4)
(4)
 (5)
(5)
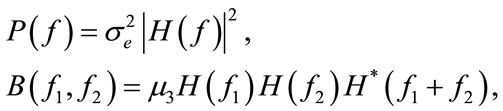
where  represent the PSD and bispectrum, respectively. Note that the PSD is real valued, nonnegative, and a function of one variable (discrete frequency, f ). On the other hand, the bispectrum is a function of two variables (discrete bifrequencies, f1, f2) and has complex values. Bicoherence is another useful statistic measure, which is defined as [7]:
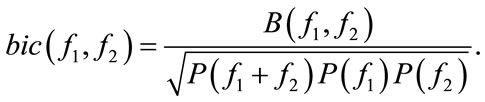 (6)
(6)
A linear and stationary random process,  , can be represented as the output of a linear system (impulse response:
 ) excited by an independent and identically distributed (iid) noise,
 . The power spectrum and bispectrum of the output (
 ) can be simplified as:
 (7)
(7)
and therefore bicoherence will be constant as:
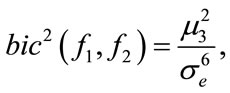 (8)
(8)
where  is an iid noise with zero mean, variance
 , and 3rd moment
  (
(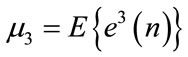 ) and
) and  is the Fourier Transform of
  [17].
[17].
Equation 8 shows that for any linear signal, squared bicoherence is constant and independent of the bifrequencies (f1, f2). If the squared bicoherence is zero, signal  is Gaussian or non-skewed with a symmetric distribution because
  or equivalently skewness is also zero [7,17].
We used the Hinich’s method to test for non-skewness (loosely called Gaussianity) and linearity of the SS segments [17]. First, we tested the Gaussianity hypothesis (H: the bispectrum is zero). If H holds the process is Gaussian; hence, signal generating process is linear. Otherwise, the process is non-Gaussian and needs to be tested for its linearity. If the bicoherence is constant, the process is linear, otherwise, it is nonlinear. This procedure was repeated for all SS segments and all body positions.
2.2.2. Bispectrum and Bicoherence Estimation
In practice, the number of sound samples is finite; hence, the HOS measures need to be estimated from available data. The bispectrum of the signal , can be estimated using direct or indirect approaches. In this study, the direct approach [7], which is an extension of the Welch technique for power spectrum density estimation, was used to estimate the bispectrum in the following steps:
1) The signal 
 is divided into K overlapping segments, each of length M. Let the kth segment of
  be
be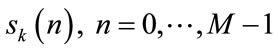 .
.
It is worth noting that for snoring sound analysis, we used 80 ms time windows (M = 820) with 50% overlap to ensure the stationarity assumption.
2) Calculate the zero-mean signal of each segment as:
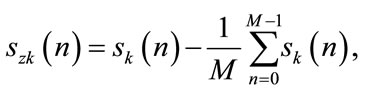 (9)
(9)
3) Multiply the zero-mean signal by the Hanning window,  , to control the effect of spectral leakage.
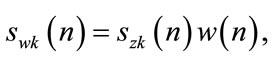 (10)
(10)
4) Compute the discrete Fourier transform (DFT) of each segment:
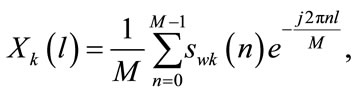 (11)
(11)
The raw bispectral estimate ( ) can be calculated as:
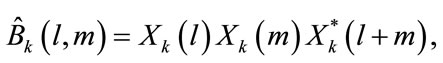 (12)
(12)
where l, m are the discrete frequencies.
5) The consistent estimate of bispectrum ( ) can be obtained by averaging raw estimates over all segments.
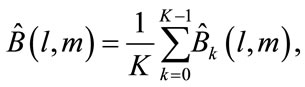 (13)
(13)
Consequently, the squared bicoherence can be derived from bispectrum as below [18]:
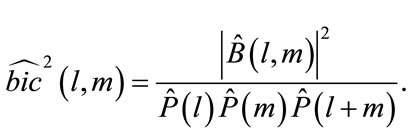 (14)
(14)
The discrete bispectrum has many symmetries in  plane. It is only needed to calculate
  in the non-redundant region or principal domain (D) which is defined as:
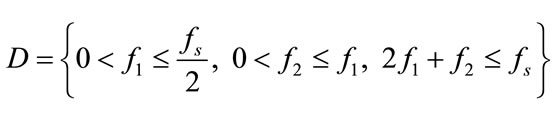
[19]. Where  are the bifrequencies (in Hertz) correspondent to the normalized bifrequencies
 .
.
2.3. Feature Extraction
Suppose that we estimated the bispectrum ( ) in D. This section details on deriving two new features defined in section I: 1) The MBF feature, which is a 2-D feature denoted as
  and 2) PMBF, which is a 1-D feature denoted as
 .
.
2.3.1. MBF Computation
MBF is the bifrequency where the summation of absolute values of  becomes half of the summation of absolute value of
  over all bifrequencies in D. In fact, the procedure looks like:
1) Calculate the summation of  at all bifrequencies in D.
2) Set f1 = 0.
3) For all bifrequencies  satisfying the condition
  calculate:
4) Check if 
If YES, end the algorithm and 
If NO, increase f1 and go to step 3. (Note that:  .)
.)
2.3.2. PMBF Computation
Once the MBF is computed, the PMBF,  , can be determined by the projection of
  onto the line
  corresponding to the diagonal slice of the bispectrum. Equivalently we have:
2.3.3. Skewness and Kurtosis
Let  be a zero-mean random process. Skewness
  and kurtosis
  are defined as:
where  is the standard deviation of
  and
and  and
and  are its zero-lag 3rd and 4th order cumulants respectively [20].
2.3.4. 1st Formant Frequency and Energy
Energy (E) and first formant frequency (F1) were obtained from each SS segment. Linear predictive coding (LPC) [21] was used to estimate F1. To meet stationarity assumption,  was divided into 80 ms overlapping frames (50% overlap and Hanning window). In each frame, the autoregressive (AR) model of the signal was estimated and the roots of AR model were calculated. To select the AR model order, we used the optimum order model (optimum order =
 ) suggested in [22]. Therefore, we selected an AR model of 14 to estimate first formant frequency of each frame. F1 was estimated by taking median over all frames.
2.3.5. Calculation of Features
As mentioned in the Section 2.1, the number of SS segments is different for each patient. Let us denote  SS segment of patient X by
  First,
 ,
,  ,
,  ,
,  ,
,  for all segment were calculated resulting in a finite number of observations for each feature. Then, the sample median of each feature set was estimated. In fact the followings were calculated for patient X:
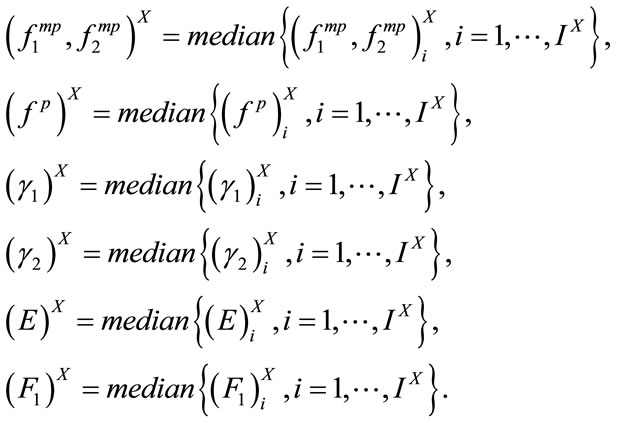
This procedure was repeated for all 60 individuals yielding a  matrix for MBF feature and a
  vector for PMBF, energy, 1st formant frequency, skewness, and kurtosis features. The reason we used median instead of mean is the insensitivity of median to outliers; it is known that when the data is not symmetrically distributed, the median outperforms the mean in measuring the middle range of data [23]. Figure 2 shows the sample density of
 , and
, and  estimated by kernel method [24]. As shown in Figure 2, the data is skewed; therefore, the median is a better estimate of the middle range of the data than the mean value in this case.
2.4. Statistical Analysis
To investigate the effect of anthropometric parameters such as age, gender, height, BMI, and AHI on the features, we ran statistical tests assuming the significance level as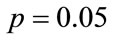 . Since the distribution of the features deviated from normal distribution, the Kendall’s Tau-b test (nonparametric counterpart of Pearson correlation) [10] was used to measure the correlation among continuous anthropometric parameters and HOS features. The one-way KWAV [11,12] was also used to compare the median of features between men and women.
2.5. Classification
Naïve Bayes classifier [13] was used to evaluate the ability of our feature set to discriminate the subjects to snorers with OSA and snorers without OSA or the so called “simple snorer” groups. Particularly, we were interested to compare the ability of SS features to be used as a signature of OSA when the groups of OSA and non-OSA were matched (Experiment A) and unmatched (Experiment B) in terms of anthropometric parameters.
Therefore, we performed two experiments: Experiment A: We selected a subset of our database including 22 apneic and 6 simple snorers that were matched in terms of gender, BMI, height and AHI. Experiment B: Another subset with the same number of participants (28 including 21 apneic and 7 simple snorers) with unmatched anthropometric parameters was used for classification. Table 2 shows the anthropometric profile of both experiments.
We used the energy, 1st formant frequency, MBF, PMBF, skewness, and kurtosis as our features for linear discriminant analysis. Several combinations of the features were examined and the performance was evaluated using the Leave-One-Out Cross-Validation (LOOCV) technique [25,26]. The LOOCV is a common technique when the number of observations (subjects in this case) is relatively small; it helps to prevent over-fitting. In the LOOCV, one observation is used as testing set and the rest [27] is used as training set. This procedure is repeated for all observations [28] and the average performance is measured. It is worth noting that the Euclidean metric was used to compute the distance.
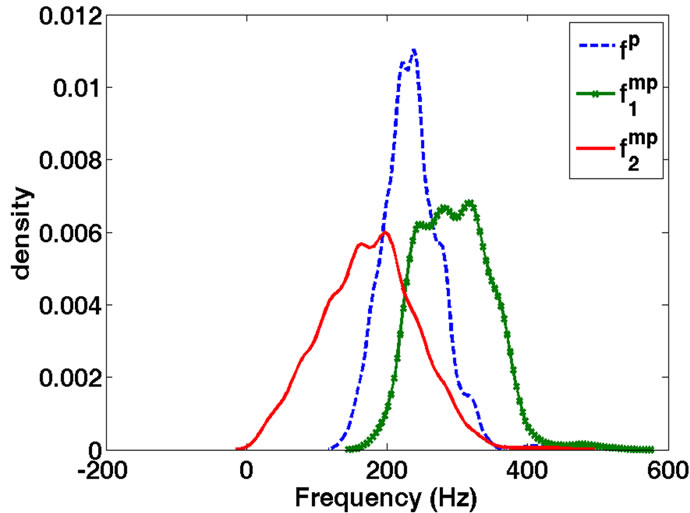
Figure 2. Kernel density estimate of ,
,  , and
, and  for a typical subject. Note the asymmetry of the distributions.
3. RESULTS AND DISCUSSION
All SS segments were found to be non-Gausssian, while their linearity varied during the night. In fact, for each patient, there existed some linear SS segments as well as some non-linear ones. We also noticed that the linearity of the SS segments varied among different body positions within each subject. However, this result was not consistent among all subjects. Furthermore, not everybody slept and/or snored in all positions.
It was shown that the body position during sleep changes both duration and intensity of snoring sounds [27]. However, we did not find a consistent and significant relationship between the sleeping position and the change in the linearity of snoring sound generating process.
However, in general, we did not find a consistent and significant relationship between the sleeping position and the change in the linearity of snoring sound generating process; the results in the population of our study were variable between the subjects. However, the lack of finding a general pattern of such relationship could be partially due to lack of snoring data in all different sleeping positions in our study.
It is known that if a signal is non-Gaussian, the 2nd order statistical techniques are only able to extract partial information from the signal [7,8]. Therefore, we used HOS measures to develop new features such as MBF and PMBF from existing data. We also extracted common HOS features such as skewness and kurtosis from the SS segments. It was found that there was a significant relationship between frequency based features such as ,
,  , and
, and  and all anthropometric parameters except age. As shown in Table 3, four out of five anthropometric parameters (height, BMI, AHI, and gender) significantly affected the HOS features of the SS segments, while gender and BMI were significant parameters affecting energy and first formant features.
The height of individuals was observed to be a significant factor influencing the value of  (p < 0.01),
  , and
, and  (p < 0.05). There was a negative relationship between height and these frequency related features. The taller the individuals, the lower frequency components were in their snoring bispectrum. The height has been shown to affect the tracheal sound spectral features [28]. It was reported that the tracheal sounds in children had higher frequency components than in healthy
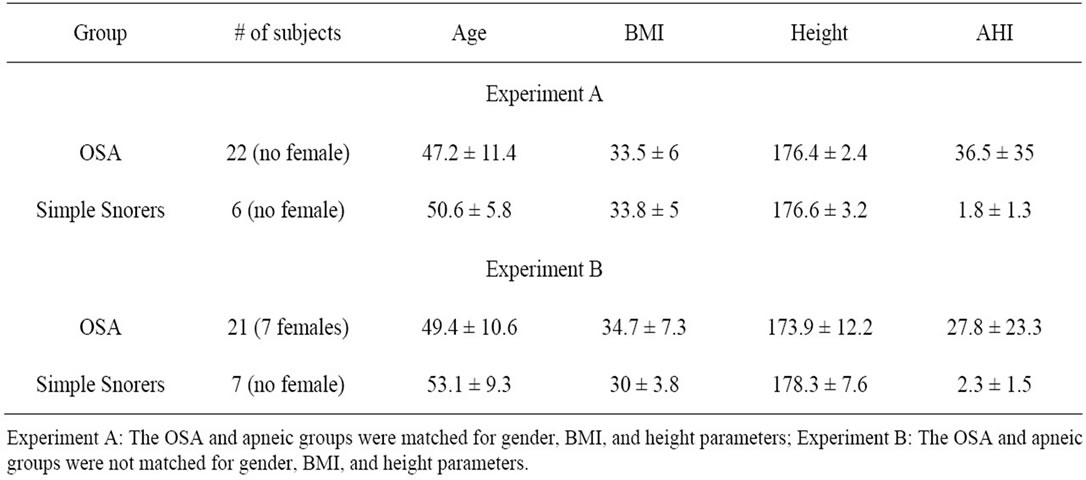
Table 2. Anthropometric information of two subsets selected for classification.
Table 3. The results of Kendall’s Tau-b and Kruskal-Wallis tests for five anthropometric parameters.
adults. In another study [29], it is shown that the anatomy of the trachea determines the characteristic features of tracheal sounds. However, there was no study confirming the change in the features of SS segments due to the height. Based on our findings, the MBF and PMBF features of the extracted SS segments are negatively related to the height of individuals. Assuming that taller individuals have taller neck, this result implies that the characteristics of SS segments reflect resonances (existing in SS) that depend on the upper airway’s length.
The results of the Kendall’s Tau-b test on BMI groups shows that BMI is significantly associated with the value of  (p < 0.05),
  (p < 0.01) as well as F1 (p < 0.05). They were negatively correlated meaning that the higher the BMI, the lower were the values of
 ,
,  , and F1. As known, obesity is a factor strongly associated with the presence of OSA [30]. Obese individuals with sleep apnea have been shown to have more (about 42%) fat in their cervical region than normal subjects as well as non-obese individuals with OSA [31]; thus, resulting in pharyngeal area narrowing. It is also known that higher BMI is associated with increased level of leptin (a hormone produced by the adipose tissue and has also actions on the respiratory centre control) [32]. Therefore, our observed changes in the acoustical properties of the SS segments due to BMI can be explained by both anatomical and hormonal changes of the upper airway.
It was also found that AHI and gender were significantly correlated with energy and frequency-based HOS features of the SS segments. As shown in Table 3, the individuals with higher AHI had lower frequency-based features ( and
and ) (p < 0.05) and higher energy (p < 0.01). The female snorers of this study were observed to have higher frequency-based features (
 and
and ) (p < 0.05) and lower energy feature (p < 0.05) than the male snorers. Although there was no study investigating the gender effect on the snoring sounds, this observation is congruent with findings reported in two studies focused on breath and lung sounds [33,34]. According to those studies, breath and lung sounds in healthy women contain higher frequency components than in men. It has also been shown that men have higher pharyngeal and supraglottic resistances than women [35]. Therefore, given that the size and mechanical properties of pharynx are significantly different between men and women [36], the snoring sounds of women and men can be expected to be significantly different as the results of our study indicate. Moreover, these might be also a reason for greater incidence of OSA in men [35,36].
Two of the frequency-based HOS features ( and
and ) were found to be significantly different in snorers with different AHI. This result is congruent with previous studies. In people with OSA, the lateral pharyngeal muscular wall is usually narrower [37]. Therefore, minimum area of the airway has been shown to be significantly smaller in apneic individuals than non-OSA people. The size of airway plays a major role in the frequency components of the sound produced by the flow turbulence in the airway. This explains the change in the frequency based HOS feature of the SS segments between snorers with OSA and simple snorers.
It was observed that for some of the anthropometric parameters (e.g. BMI and gender) two of the frequency-based features ( ,
, , and
, and ) were significantly correlated, while the third one was not significantly correlated.
  is linearly related to the summation of
  and
and  (projection of two). If both have a significant correlation with a parameter, then we expect that
  would be also significant (as in the case with Height parameter) but having one of them significantly correlated with a parameter, does not necessarily lead to a significant correlation of
  and that parameter. The reason that only one of the coordinates of MBF is significant depends on the bispectrum of the SS segment. As an example, let us compare MBF for 4 SS segments of participant4 (P4) and participant6 (P6). P4 (BMI = 24.4):
  = [320,320,360,320] and
  = [240,40,160,160]. P6 (BMI = 47.1):
  = [240,240, 200,250] and
  = [180,160,180,120]. It is clear that BMI significantly changed
  but not
 . In fact, the difference between the bispectral information of the two sets of SS segments is well extracted using 2-D MBF feature which is an advantage of bispectral analysis.
One important point is that these frequency changes due to small changes in the airway size may not always be detectable by spectral analysis of the sounds. However, as known, HOS techniques complement the information obtained from 2nd order statistical techniques, i.e. power spectral analysis. Hence, we propose using a combination of HOS techniques and conventional acoustical techniques increases the diagnosis accuracy of OSA. In this paper, we tried to verify this point by applying a simple classifier to our feature set. We partitioned our database into two sets to compare two scenarios, one when the height, gender, and BMI are matched between the two groups of snorers with OSA and simple snorers, and the other one when those parameters are not matched. We observed an increase in the accuracy of classification when the parameters were matched.
Table 4 illustrates the results of classification. Several combinations of features were used as input to the naïve Bayes classifier. Results demonstrate that the highest sensitivity and specificity occurred when a combination of both conventional feature (Energy) and HOS feature set ( and skewness) was used. This combination resulted in sensitivity of 93.2% (87.5%) and the specificity of 88.4% (86.3%) for experiment A (B). As shown in Table 4, for experiment A, the sensitivity and specificity
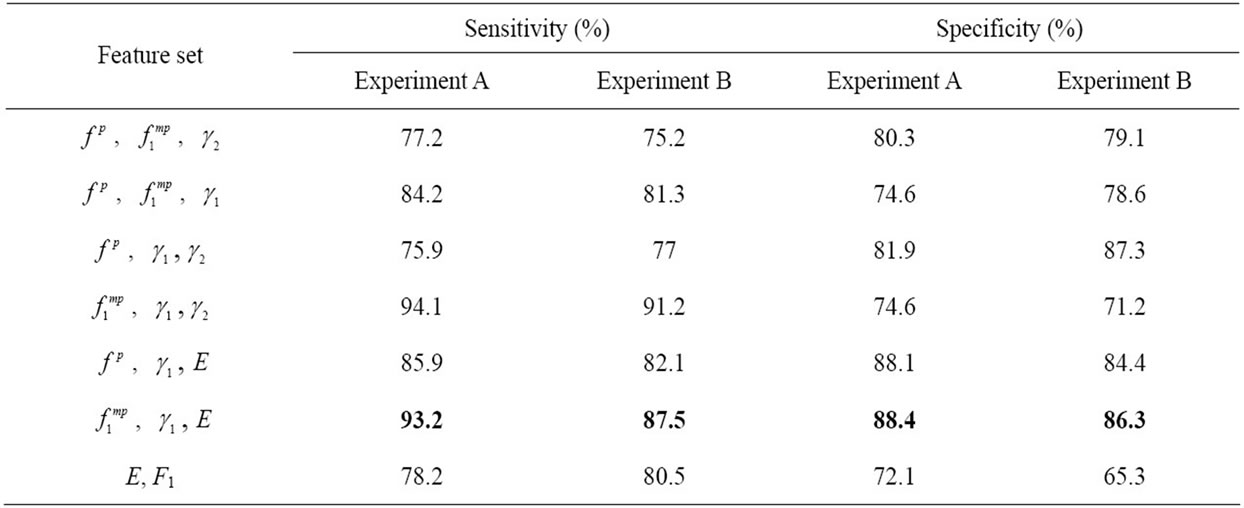
Table 4. Naïve Bayes classification results for different combination of conventional and HOS features.
values for only HOS features were 75.9% - 94.1% and 74.6% - 81.9%, respectively. On the other hand, using only energy and formant frequency resulted in a sensitivity and specificity of 78.2% and 72.1%, respectively.
As expected, overall, the sensitivity and specificity decreased when an unmatched subset was used for classification.
To compare our work with a recently published work [9], we matched the anthropometric parameters of snorers with OSA and simple snorer groups. Moreover, our recordings were performed using a microphone placed over trachea. Therefore, our recorded sounds have a higher signal to noise ratio than those recorded by an ambient microphone. We also improved the sensitivity and specificity of OSA diagnosis among snorers by simultaneous usage of HOS and conventional features. However a major difficulty in our study was to find a larger population with matched anthropometric parameters to validate the results of our analysis. This limitation was partially resolved by using LOOCV which performs well when the population size is relatively small.
4. CONCLUSION
In this study, the relationship between anthropometric parameters of 60 snorers and the 3rd and 4th order statistical features derived from the SS segments were investigated.
In summary, we developed two new frequency-based HOS features from the non-Gaussian SS segments, and investigated statistical correlation of these features along with the zero-lag HOS features with different anthropometric parameters. An important contribution of the statistical investigation is on the application of snoring sound for OSA identification among snorers. Since the common features of snoring sounds used in classification are sensitive to anthropometric parameters, the results of classification is reliable only when the two groups of apneic and controls are matched for those parameters.
When HOS features were used in the classification of the apneic group, the results have shown improvement compared to those of previous studies. The HOS features may also be used (under investigation) to find the site of obstruction in upper airway, and cluster the SS segments based on their production mechanism.
5. ACKNOWLEDGEMENTS
In summary, we developed two new frequency-based HOS features from the non-Gaussian SS segments, and investigated statistical correlation of these features along with the zero-lag HOS features with different anthropometric parameters. An important contribution of the statistical investigation is on the application of snoring sound for OSA identification among snorers. Since the common features of snoring sounds used in classification are sensitive to anthropometric parameters, the results of classification is reliable only when the two groups of apneic and controls are matched for those parameters.
When HOS features were used in the classification of the apneic group, the results have shown improvement compared to those of previous studies. The HOS features may also be used (under investigation) to find the site of obstruction in upper airway, and cluster the SS segments based on their production mechanism.
![]()
![]()
REFERENCES
- Hoffstein, V. (2002) Apnea and snoring: State of the art and future directions. Acta Otorhinolaryngol Belg, 56, 205-236.
- Lee, B., Hill, P., Osborne, J. and Osman, E. (1999) A simple audio data logger for objective assessment of snoring in the home. Physiological Measurement, 20, 119-127. doi:10.1088/0967-3334/20/2/001
- Dalmasso, F. and Prota, R. (1996) Snoring: Analysis, measurement, clinical implications and applications. European Respiratory Journal, 9, 146-159. doi:10.1183/09031936.96.09010146
- Sola-Soler, J., Jane, R., Fiz, J. and Morera, J. (2003) Spectral envelope analysis in snoring signals from simple snorers and patients with obstructive sleep apnea. IEEEEMBS, Cancun, Mexico, 2527-2530.
- Abeyratne, U., Karunajeewa, A. and Hukins, C. (2007) Mixed-phase modeling in snore sound analysis. Medical and Biological Engineering and Computing, 45, 791-806. doi:10.1007/s11517-007-0186-x
- Beck, R., Odeh, M., Oliven, A. and Gavriely, N. (1995) The acoustic properties of snores. European Respiratory Journal, 8, 2120-2128. doi:10.1183/09031936.95.08122120
- Fackrell. J.W.A. (1996) Bispectral analysis of speech signals. Edinburgh Research Archive, University of Edinburgh.
- Ng, A.K., Wong, K.Y., Tan, C.H. and Koh, T.S. (2007) Bispectral analysis of snore signals for obstructive sleep apnea detection. Proceedings of the 29th Annual International Conference of the IEEE EMBS, 6195-6198.
- Ng, A., Koh, T., Abeyratne, U. and Puvanendran, K. (2009) Investigation of obstructive sleep apnea using nonlinear mode interactions in nonstationary snore signals. Annals of Biomedical Engineering, 37, 1796-1806. doi:10.1007/s10439-009-9744-8
- Kendall, M.G. (1938) A New Measure of Rank Correlation. Biometrika, 30, 81-93. doi:10.2307/2332226
- Kvam, P.H. and Vidakovic, B. (2007) Nonparametric statistics with applications to science and engineering. Wiley-Interscience. doi:10.1002/9780470168707
- Searle, S.R. (1971) Linear models. John Wiley & Sons, Inc, New York.
- Duda, R.O., Hart, P.E. and Stork, D.G. (2000) Pattern Classification. 2nd Edition, Wiley-Interscience.
- Yadollahi, A. and Moussavi, Z. (2009) Acoustic obstructive sleep apnea detection. Engineering in Medicine and Biology Society, EMBC 2009. Annual International Conference of the IEEE, 7110-7113.
- Azarbarzin, A. and Moussavi, Z. (2011) Automatic and unsupervised snore sound extraction from respiratory sound signals. IEEE Transactions on Biomedical Engineering, 58, 1156-1162. doi:10.1109/TBME.2010.2061846
- Brillinger, D.R. (1965) An introduction to polyspectra. The Annals of Mathematical Statistics, 36, 1351-1374. doi:10.1214/aoms/1177699896
- Hinich, M.J. (1982) Testing for gaussianity and linearity of a stationary time series. Journal of Time Series Analysis, 3, 169-176. doi:10.1111/j.1467-9892.1982.tb00339.x
- Brillinger, D.R. and Rosenblatt, M. (1967) Computation and interpretation of k-th order spectra. Spectral Analysis of Time Series, 189-232.
- Hinich, M.J. and Wolinsky, M.A. (1988) A test for aliasing using bispectral analysis. Journal of the American Statistical Association, 83, 499-502.
- Swami, A., Mendel, J.M. and Nikias, C.L. (1998) Higherorder spectral analysis toolbox user’s guide. Version 2.
- Proakis, J.G. and Manolakis, D.K. (2006) Digital signal processing. 4th Edition, Prentice Hall, New York.
- Markel, J. (1972) Digital inverse filtering—A new tool for formant trajectory estimation. IEEE Transactions on Audio and Electroacoustics, 20, 129-137. doi:10.1109/TAU.1972.1162367
- Hogg, R., Craig, A. and Mckean, J. (2004) Introduction to mathematical statistics. Prentice Hall, New York.
- Silverman, B.W. (1986) Density estimation for statistics and data analysis. Chapman and Hall, London.
- Burman, P. (1989) A comparative study of ordinary cross-validation, v-fold cross-validation and the repeated learning-testing methods. Biometrika, 76, 503-514.
- Venter, J.H. and Snyman, J.L.J. (1995) A note on the generalised Cross-Validation Criterion in Linear Model Selection. Biometrika, 82, 215-219. doi:10.1093/biomet/82.1.215
- Nakano, H., Ikeda, T., Hayashi, M., Ohshima, E. and Onizuka, A. (2003) Effects of body position on snoring in apneic and nonapneic snorers. Sleep, 26, 169-172.
- Sanchez, I. and Pasterkamp, H. (1993) Tracheal sound spectra depend on body height. American Journal of Respiratory and Critical Care Medicine, 148, 1083-1087. doi:10.1164/ajrccm/148.4_Pt_1.1083
- Kraman, S., Pasterkamp, H., Kompis, M., Takase, M. and Wodicka, G. (1998) Effects of breathing pathways on tracheal sound spectral features. Respiration Physiology, 111, 295-300. doi:10.1016/S0034-5687(97)00113-8
- Young, T., Palta, M., Dempsey, J., Skatrud, J., Weber, S. and Badr, S. (1993) The occurrence of sleep-disordered breathing among middle-aged adults. New England Journal of Medicine, 328, 1230-1235. doi:10.1056/NEJM199304293281704
- Mortimore, I.L., Marshall, I., Wraith, P.K., Sellar, R.J. and Douglas, N.J. (1998) Neck and total body fat deposition in nonobese and obese patients with sleep apnea compared with that in control subjects. American Journal of Respiratory and Critical Care Medicine, 157, 280-283.
- De Sousa, A.G., Cercato, C., Mancini, M.C. and Halpern, A. (2008) Obesity and obstructive sleep apnea-hypopnea syndrome. Obesity Reviews, 9, 340-354. doi:10.1111/j.1467-789X.2008.00478.x
- Gavriely, N., Nissan, M., Rubin, A.H. and Cugell, D.W. (1995) Spectral characteristics of chest wall breath sounds in normal subjects. Thorax, 50, 1292-1300. doi:10.1136/thx.50.12.1292
- Gross, V., Dittmar, A., Penzel, T., Schuttler, F. and von Wichert, P. (2000) The Relationship between normal lung sounds, age, and gender. American Journal of Respiratory and Critical Care Medicine, 162, 905-909.
- White, D.P., Lombard, R.M., Cadieux, R.J. and Zwillich, C.W. (1985) Pharyngeal resistance in normal humans: influence of gender, age, and obesity. Journal of Applied Physiology, 58, 365-371.
- Brooks, L.J. and Strohl, K.P. (1992) Size and mechanical properties of the pharynx in healthy men and women. American Journal of Respiratory and Critical Care Medicine, 146, 1394-1397.
- Schwab, R., Gupta, K., Gefter, W., Metzger, L., Hoffman, E. and Pack, A. (1995) Upper airway and soft tissue anatomy in normal subjects and patients with sleep-disordered breathing. Significance of the lateral pharyngeal walls. American Journal of Respiratory and Critical Care Medicine, 152, 1673-1689.