Journal of Biomedical Science and Engineering
Vol. 5 No. 8 (2012) , Article ID: 21456 , 6 pages DOI:10.4236/jbise.2012.58053
Novel approach for the automated detection of allergy test using spectral imaging
![]()
Department of Biomedical Engineering, Damascus University, Damascus, Syria
Email: issa.ibraheem@gmail.com
Received 12 August 2011; revised 10 January 2012; accepted 13 June 2012
Keywords: Allergy-test; Classification; Spectral Imaging; Principal Components Analysis; Linear Discriminant; Classification
ABSTRACT
This paper proposes a novel approach for the automatic detection of allergy test (allergy lesion). A hyperspectral microscope system was used to image the test samples which were diagnosed by dermatologist. It was found that allergy of different levels, and healthy skin cells show absorption spectra, which are sufficiently characteristic and yet reproducible enough to allow for differentiation when using a spectroscopic system. Principal components analysis was used to extract relevant features that could be used for classification from these spectra. Preliminary results indicate that the different types of allergy cells can be reliably distinguished by these features. We conclude that hyperspectral microscopic analysis is a promising approach for improving and automating the diagnosis of allergy test as well as another skin lesions.
1. INTRODUCTION
As allergies are an increasingly common health problem, determination of the specific allergens a patient reacts to is a significant part of the day-to-day activities is medical practice. The most widely used allergy tests are based on either pricking (prick test) or scratching (scratch test) the skin and bringing the area into contact with an allergen. Usually, this is performed multiple times with different allergens.
After a certain period of time, the test persons skin will react to allergens the patient is allergic against by exhibiting a more or less distinct reddening caused by the allergic immunoreaction leading to a localized inflammation of the skin near at the exposed area. The degree of inflammation is graded on a scale from 0 to 3, depending on the intensity of the redness and the structure (elevations, pits, vesicles). The prevalently used technique to identify allergy types is a microscopic analysis of the spectral information of skin. Yet, the diagnosis of allergy type present in a sample is difficult and labor intensive, requires much experience and still, as any manual work, is prone to subjective judgment. Hence, a computerized expert system analysis able to derive a pre-diagnostic estimation based on objectified criteria would be a valuable tool to dermatologists and pathologists [1,2].
Although a human expert still has to be the final instance, who makes the actual diagnosis, such an instrument would have the capability to speed up the time-to-diagnosis significantly and at the same time reduces the probability of false assessments. Factors influencing the diagnosis are both the coloration and the spatial distribution. Another important approach in life sciences is image processing, sometimes also referred to as computer vision. Here, images are acquired either using RGB or monochromatic cameras. The spatial information contained in these images is then evaluated, e.g. to count the number of different cells in a blood sample, or a sample taken e.g. from a biotechnological fermentation broth. Still, imaging often has a problem to distinguish between different structures that are similar in brightness respectively color, a factor that may severely limit reliability and hence the practical applicability of imaging systems. Additionally, with the development of fast and powerful data evaluation algorithms spectral and morphological classifiers, combined contextual data evaluation, wavelet analysis, etc., it is also nowadays to acquire and evaluate spectral images within a few seconds.
This is of a major importance, as it is neither possible to keep a (wake) patient stationary or a biologically active sample constant for prolonged periods of time nor compatible with screening requirements to wait for days to get the results. Here, real-time Spectral Imaging Systems (SI Systems) are a valuable addition to established methods.
2. MATERIALS AND METHODS
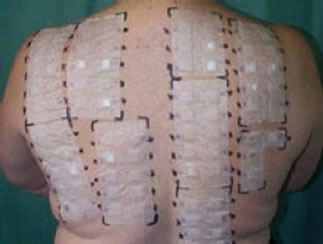
The diagnosis using allergy test is difficult because many different symptoms can lead to the same decision, in additional the prick or patch skin test methods as shown in Figure 1 are tiresome to patients, and the diagnosis is done manually by physician. For Prick Test a small needle is used to gently prick the skin through a drop fluid containing a known allergen. 1 - 20 minutes after the exposure to the allergen, the allergen interaction with IgE Type 1 named hypersensitivity on the surface of mast Cells triggers the release of inflammatory mediators. the positive reaction means erythema at skin around needle prick (itchy and red) with the development of a white swelling called a weal. Weal reaches its maximum size in about 15 to 20 minutes and the reaction fades within a few hours (its for the patient a long test time). In Patch Test Tapping traces of various known contact allergens (typical 20 - 30) on the skin keeping them there for 48 hours. the test sites are inspected 48 and 72 hours after application. Positive reaction leads to erythema, swelling, and vesiculation. This type called type 4 (delayed) hypersensitivity (contact dermatitis). for all these allergytest disadvantages a Non-Invasive and in-Vitro method for automatic classification of allergy test is required [2,3]. Any automated system also has to take into account the skin portion and the larger the area, the more strongly allergic is the patient to a specific allergen. The practical problem is now to objectively assay the redness and the size of the reddened skin area, in particular when taking into account different skin types. While grade 0 (no inflammation) is pretty standard, distinguishing between various types of grade 1 to 3 may be a problem, even for an expert. The same applies when trying the measure the size of the frequently irregularly shaped inflamed area. Here the application of a SI system has a number of advantages. First, the spectroscopic measurement allows to reliably measure spectra for each pixel, allowing not only to correctly classify the grade of the allergic reaction, totally and at a specific spot, but also the size of the inflamed area and the homogeneity of the discoloration Together, this allows for a much more precise determination of the sensitiveness against certain allergens. Image data acquisition using scan process of the objects (area of 2 × 5 cm2, shown in Figure 2) of the skin takes about 30 s, with the results being available practically instantaneously.
 (a)
(a)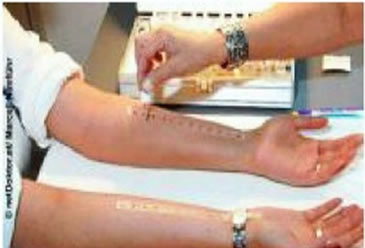 (b)
(b)
Figure 1. (a) prick allergy test [2]; (b) patch allergy test [2].
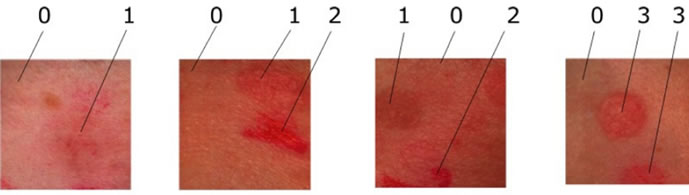
Figure 2. samples of allergy types.
This good time resolution allows monitoring the development of the allergic reaction over time, thus providing even more information.
2.1. Chemometry-Spectra
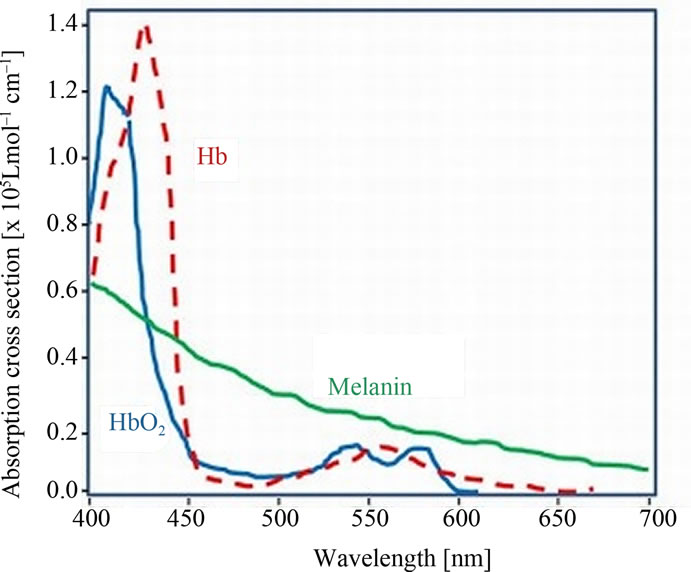
Of skin Components: The chemometry-spectra of skin are the summation and overlapping of several biological components under the skin surface. However the almost influences on the chemometry-spectra of skin are from Oxygenated hemoglobin, Deoxygenated hemoglobin and the Pigmentation of the skin cells as (melanin). See the spectra of the chemometry-spectra of skin components in Figure 3(a). Figure 3(b) shows the Spectra of four different grades of epicutaneus: epi0 the grade 0 is negative, no inflammation. epi1, is the grade 1 with light inflamemation, elevated. epi2 is the grade 2 with medium inflammation and small pits. and epi3 is the grade 3 in which we find intense inflammation with vesicles. We used a spectral imaging system with spatial resolution of 512 × 512 and spectral resolution of 270 bands. Within we acquired 32 Allergy objects of 4-different types and used 8 objects, which were manually labeled to build the training set. For testing we used 24 objects
2.2. Classification Rules
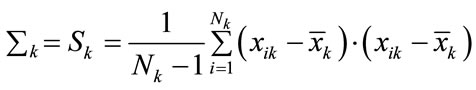
We used the Linear and quadratic discriminate classifiers LDC and QDC to separate the pixels in the spectral images of allergy objects into the four classes of its levels. Quadratic and linear discriminant analysis work well when the class conditional densities are approximately normal and good estimates can be obtained for the population parameters, mean vectors µk and variance-covariance ∑k. These parameters are usually estimated by their sample analogs [3].
 (1)
(1)
and
 (2)
(2)
where {xik; i = 1, ···; Nk} is the training sample from population k. Although reasonable, these two approaches enjoy optimal properties especially when the population distributions are normal. Under substantial departures
 (a)
(a)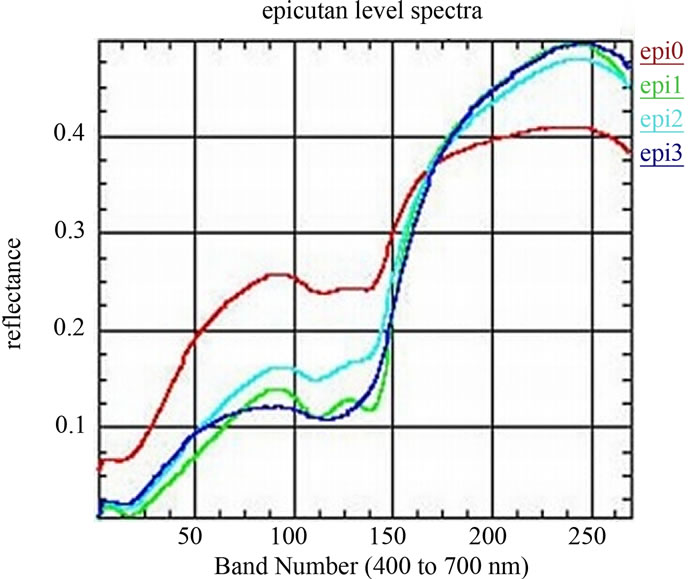 (b)
(b)
Figure 3. (a) Norimichi Tsumura, et al., Mapping pigmentation in human skin by multi-visible, spectra imaging by inverse optical scattering technique, Department of information and image Sciences, Chiba University, Chiba, Japan; (b) Spectra of four different epicutan-grades, epi0 grade 0: negative, no inflammation. epi1, grade 1: light inflammation, elevated. epi2 grade 2: medium inflammation, small pits. and epi3, grade 3: intense inflammation with vesicles
from normality these discriminant procedures are highly biased. When allocating an object with measurement vector x into one of K possible unordered populations arbitrary labeled as {i = 1, ···, K} the distribution of the measurements x are seldom identical in each class. The conditional distribution for each class k most often applied classification rules are based on the multivariate normal distribution:
 (3)
(3)
where µk and ∑k are the class k (1 ≤ k ≤ K) population mean vector and covariance matrix, calculated in Equations (1) and (2). The class-conditional densities and the unconditional class prior probabilities are usually unknown. More often one is able to obtain a sample of observations from each class that are correctly classified by some external mechanism. When the training sample data can be regarded as drawn randomly from the pooled population, these prior probabilities are estimated by the fraction of each class in the pooled sample:
 (4)
(4)
where Nk is the sample size of class k and

If the prior probabilities are equal for each k, then it leads to Maximum-Likelihood. To estimate the class conditional densities fk(x) and the prior probability πk a training sample with already correctly classified classes is needed. The most often applied classification rules are derived by assuming that the class-conditional densities are p-variate normal with mean vectors k and variancecovariance nonsingular matrices ∑k, k = 1, ···, K. After Bayes Formula, which gives the Probability for one object with given vector xT = (x1, ···, xp) to belong to class k and can be calculated as following:
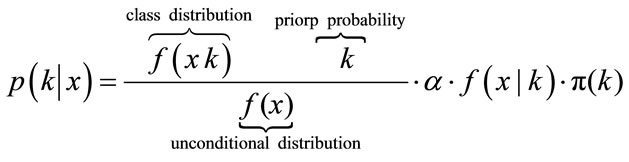 (5)
(5)
It’s known, that f(x) is the unconditional distribution of x is given by
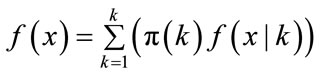 (6)
(6)
For easier calculation, we take the logarithm of the posterior distribution
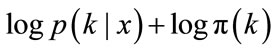 (7)
(7)
With the multivariate normal distribution it leads to
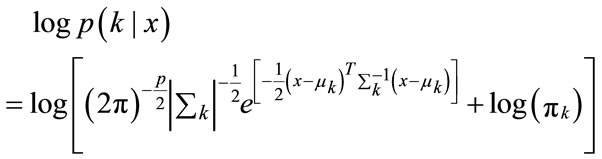 (8)
(8)
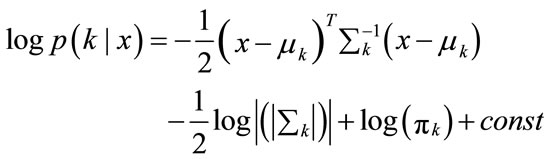 (9)
(9)
Multiplication with −2 leads to the discriminant function
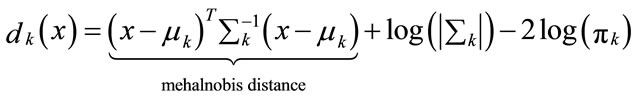 (10)
(10)
And the classification rule
 (11)
(11)
The above classification rule is called the quadratic discriminant Classifiers QDC. An important special case is the one where all the variance-covariance matrices are assumed to be equal ∑k = ∑, resulting to what is called linear discriminant classifiers LDC [4,5]. equal ∑k = ∑, then the discriminant function in Equation (10) simplifies to
 (12)
(12)
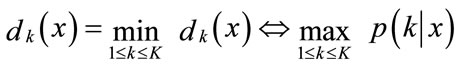
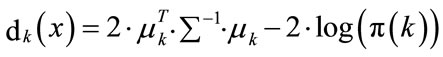
is called the Linear Discriminant Classifier (LDC) because the quadratic terms in the discriminant function cancel, because xT ∑−1x is the same in every class k and can be left out. The decision boundaries are now linear. The discriminant function uses the Mahalanobis metric in computing distances to centroids:
 (13)
(13)
The pixel xi is assigned to the class k if:
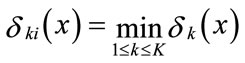 (14)
(14)
Figure 4 shows the data distribution in the future space, the problem now is to partition the future space in to two regions (classes), where for all points in one we will call it “clas1” and for all points in the other we call it “clas2”. The separating line (liner function in the first graph) could serve as a decision boundary of the classifier. Overall classification error on the data shown is the overlapping of the points of the clas1 and clas2. The nonlinear (quadratic) decision boundary shown in the second graph might represent the optimal separation of the data but there will still be some error. To reduce the error we seek the suitable PCA space (new rotated future space as it shown in Figure 5) to improve the performance of the classifier.
2.3. Principal Component Analysis
Spectra are high-dimensional and highly redundant features and the direct application of statistical classification on the whole data is difficult, if it isn’t impossible. Therefor we used the principal component analysis PCA to reduce the data size and to extract the relevant features in the spectral information [6-9]. PCA is a method to finds directions in data, which retain as much variation as possible, make projected data uncorrelated and minimize squared reconstruction error (Figure 6 shows the new p subspace axes). Principal components can be
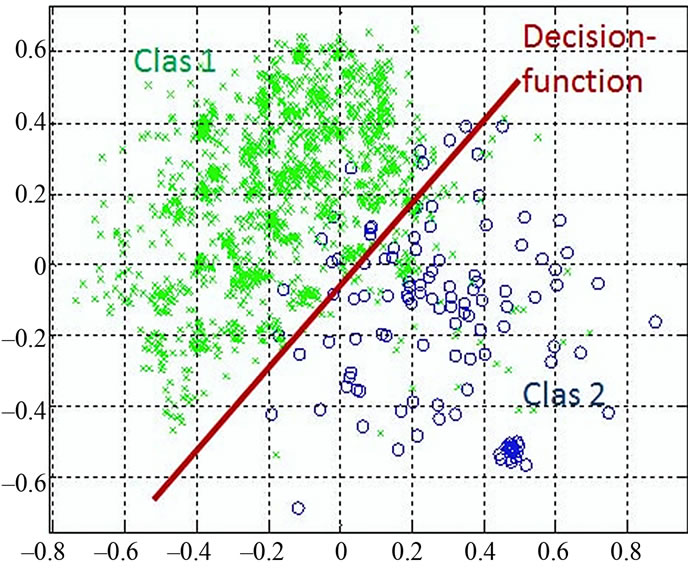
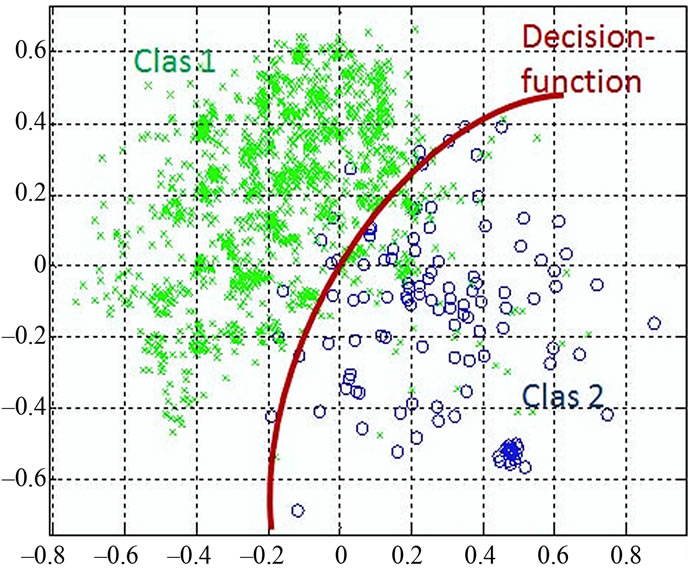
Figure 4. discriminant functions of LDC and QDC.
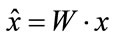
found by calculating the covariance matrix ∑ki after Equation (2), which determines shape of density. Then by performing Eigen analysis, within we get eigenvalues L and eigenvectors E. The Eigenvectors correspond to main axes of Gaussian, and the eigenvalues to their length (see Figure 5). The principal components are the l eigenvectors ei corresponding to the l largest eigenvectors λi. The values of eigenvectors λ are shown in Figure 7. The projection onto PCA subspace can be calculated by:
 (15)
(15)
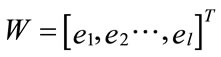
and the new axis for the new projection is:
 (16)
(16)
the ratio of the retained variance is then:
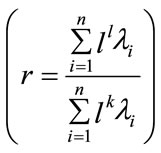 (17)
(17)
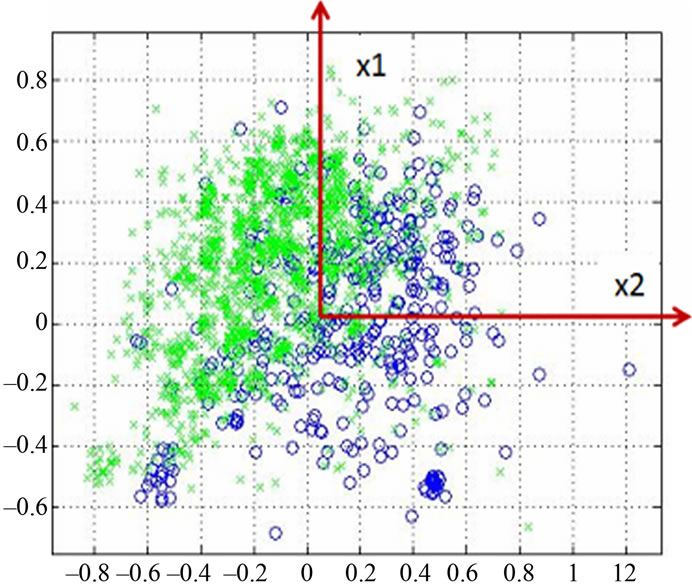
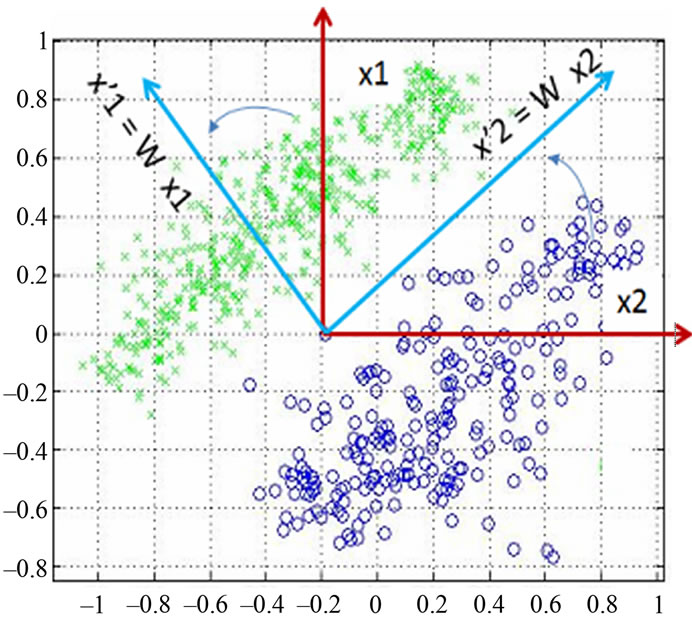
Figure 5. Data projection with principal components direction.
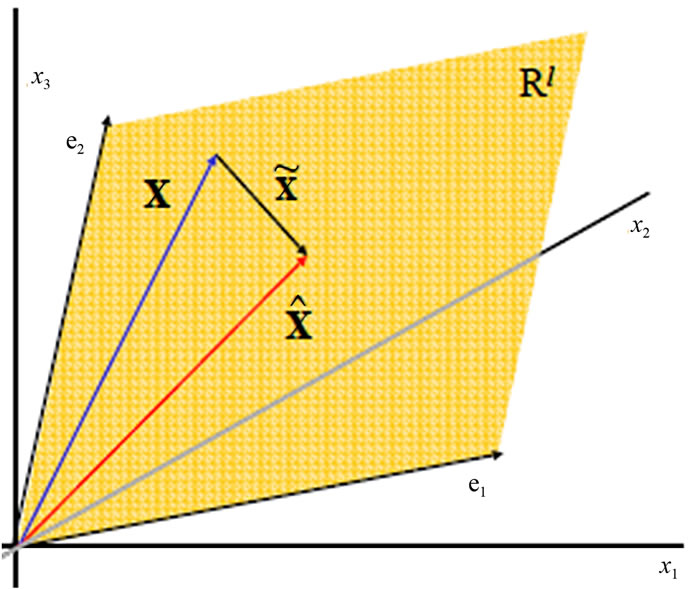
Figure 6. PCA forms linear subspaces.
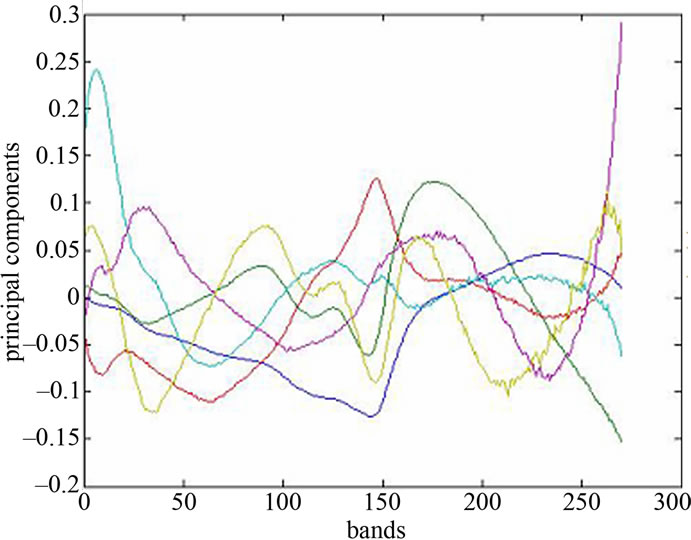
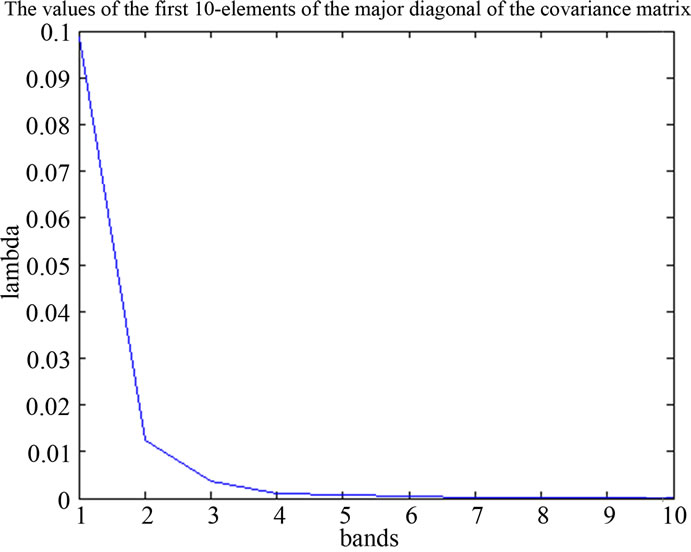
Figure 7. spectra of PA and values of the major diagonal elements of the covariance matrix.
Usually l is chosen such that r = 0.90 or r = 0.95; the remaining dimensions are considered to contain noise.
 = WT·W·x, then
 is the best reconstruction in the least square sense. To reduce the spectral-data-size we applied the principal components analysis, within the spectral dimension from 270 bands up to 8 principal components reduced. The major diagonal of the covariance matrix shows the level of the information stored in the component.
3. RESULTS AND CONCLUSION
During a clinical study allergy skin lesions of 100 patients were acquired with the Spectral Imaging System. The data consisted of spectral cubes of four-different allergy levels (allergy types). The data was split into an equally sized independent training and test set. A principal component analysis (PCA) was used to reduce the 270 spectral channels to six principal components (Figure 8 shows the PCA-scopes of the dat).
These six principal components served as the input features for a Bayes classifier (LDC and QDC-Classifiers). The classifier has been trained on the training set (33 diagnosed objects) and the performance was evaluated on the independent test set (67 objects). Every allergy type of the test set has been detected correctly; Table 1 shows the perceptual values of the right detected objects using the QDC and LDC. The LDC as well as QDC classifier delivers >71% for all objects. Despite the quite small data set, the results are promising and a follow-up study with a larger number of patients has been started yet to support these results. Figure 9 shows a sample image of a allergy lesions and the classifier result, where the advantage of the pixel-wise spectral classifica-
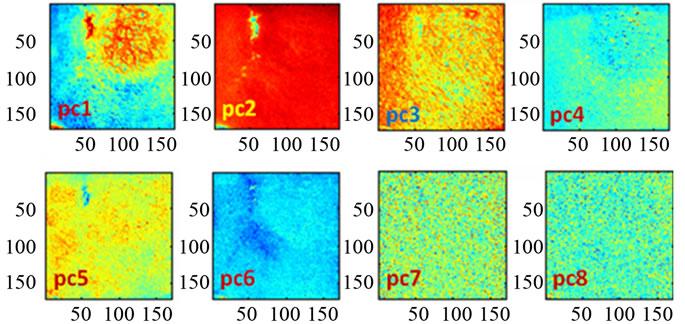
Figure 8. Scopes images of the first eight-PCAs.
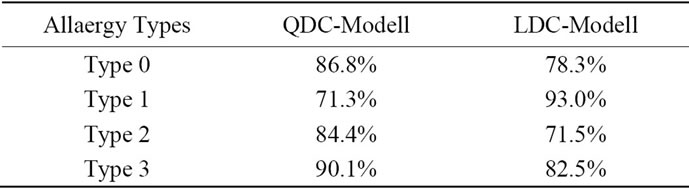
Table 1. Classification results using QDC and LDC Modells.

Figure 9. sample images of a allergy lesions and the classifier result.
tion becomes visible.
The size and the border of the allergy lesion can be detected as well as the type of the entire lesion. During the study also other skin abnormalities were acquired and preliminary investigations show, that the presented Spectral Imaging approach could also detect and evaluate other skin abnormalities like psoriasis or and melanoma and other allergy test probably allergenic materials.
![]()
![]()
REFERENCES
- Farkas, D.L., et al. (2001) Applications of spectral imaging: Detection and analysis of human melanoma and its precursors. Pigment Cell Research, 14, 2-8. doi:10.1034/j.1600-0749.2001.140102.x
- Leitner, R., Ibraheem, I. and Kercek, A. (2005) Spectral imaging as a modern tool for medical diagnostics. Austrian Computer Society, Vienna, 31-34.
- Ibraheem, I., Leitner, R., Mairer, H., Cerroni, L. and Smolle, J. (2006) Hyperspectral analysis of stained histological preparations for the detection of melanoma. Proceeding of 3rd International Workshop on Spectral Imaging, Graz, 13 May 2006.
- Duda, I.R.O., Hart, P.E. andStork, D.G. (2001) Pattern classification. 2nd Edition, John Wiley & Sons, New York.
- Fix, E. and Hodges, J.L. (1989) Discriminatory analysis—nonparam etric discrimination: Consistency properties. International Statistical Review, 57, 238247.
- Bajcsy, P. and Groves, P. (2004) Methodology for hyperspectral band selection. Photogrammetric Engineering and Remote Sensing Journal, 70, 793-802,
- Sotoca, J.M., Plam F. and Klaren, A.C. (2004) Unsupervised band selection for multispectral images using information theory. International Conference on Pattern Recognition, 23-26 August 2006, 510-513.
- Hillenkamp, F. and Grabbe, S. (1993) Die physikalischen grundlagen optischer strahlung auf die haut. In: E. Macher, G. Kolde and E.B. Brcker, Jahrbuch der dermatologie, Zulpich, Biermann-Verlag, 13-30.
- Ibraheem I. (2011) Linear and quadratic classifier to detection of skin lesions “epicutaneus”. 5th International Conference on Bioinformatics and Biomedical Engineering, Wuhan, 31 May 2011, 1-5.