iBusiness
Vol.6 No.3(2014), Article ID:49401,8 pages
DOI:10.4236/ib.2014.63012
Improved Network-Based Recommendation Algorithm
Chuanmin Mi, Xiaofei Shan, Jing Ma
College of Economics and Management, Nanjing University of Aeronautics and Astronautics, Nanjing, China
Email: michuanmin@163.com
Copyright © 2014 by authors and Scientific Research Publishing Inc.
This work is licensed under the Creative Commons Attribution International License (CC BY).
http://creativecommons.org/licenses/by/4.0/


Received 16 June 2014; revised 17 July 2014; accepted 15 August 2014
Abstract
Recently, personalized recommender systems have become indispensable in a wide variety of commercial applications due to the vast amount of overloaded information. Network-based recommendation algorithms for user-object link predictions have achieved significant developments. But most previous researches on network-based algorithm tend to ignore users’ explicit ratings for objects or only select users’ higher ratings which lead to the loss of information and even sparser data. With this understanding, we propose an improved network-based recommendation algorithm. In the process of reallocation of user’s recommendation power, this paper originally transfers users’ explicit scores to users’ interest similarity and user’s representativeness. Finally, we validate the proposed approach by performing large-scale random sub-sampling experiments on a widely used data set (Movielens) and compare our method with two other algorithms by two accuracy criteria. Results show that our approach significantly outperforms other algorithms.
Keywords: Recommendation, Network-Based, Source Reallocation, Rank Score, Hitting Rate

1. Introduction
In order to overcome information overload, recommender systems have become a key tool for providing users with personalized recommendations on items such as movies, music, books, news, and web pages. More and more e-commercial cooperates like Amazon, Half.com, CDNOW, Netflix, and Yahoo! have adopted recommendation systems to provide customers with purchase suggestions by reference to their past purchasing records. Intrigued by many practical applications, researchers have developed lots of different kinds of recommendation algorithms and systems over the last decade. One kind is called network-based recommendation algorithm, which is acquiring rapid development about in the past few years. These algorithms have demonstrated not only lower complexity but higher accuracy when compared to user-based or object-based collaborative filtering algorithms.
Bipartite graphs are quite common in complex networks. Recommender systems can be aimed at providing link predictions for user-object bipartite graphs [1] -[4] . Actually, a lot of efforts in the physics community have been devoted to designing recommendation algorithms on bipartite graphs. Among them, algorithms which are based on heat conduction [5] and probability spreading [6] -[8] have been successfully applied in personalized recommendation. The heat conduction method is inclined to recommend popular products while the probability spreading method tends to recommend cold products for the individual target user. Soon after that, the hybrid method combining heat conduction and probability spreading algorithm is proposed to achieve better recommendation performances [5] . Chuang Liu and Yuan Guan have improved the original one from different aspects [9] [10] . Chuang Liu investigates the impact of heterogeneous initial configuration on recommendation results, while Yuan Guan makes each user have his/her own personalized hybrid parameter instead of all users in the system sharing the same hybrid parameter.
However, the algorithms mentioned above usually ignore users’ explicit scores for objects or only select higher users’ scores, which lead to the loss of information and even sparser data [11] . When calculating the importance of one user in the recommendation process of the target user, we have to admit that it is the similar scores for common objects that contribute to high users’ similarity no matter the score is 1 or 5. If two users both give an object a score level of 1, we think this score has the same impact with the score level of 5 which is given to another object by the same two users.
Meanwhile, evaluation of a personalized recommendation method attracts more attention than before. Past researches tend to focus on accuracy measures such as mean absolute error [12] , precision and recall [13] . Greg Linden (2009) pointed out that recommendation aims to help users find interesting objects instead of predicting what rating users may give to the object [14] . For example, users may give a high rating to a movie but the possibility that they will watch the movie is small. As a consequence, it is more important to predict whether the users will be interested in the objects than to predict what rating the users will give to the objects. Recent studies have increasingly recognized that new measures are indispensable in order to achieve a comprehensive evaluation of a personalized method [15] . For example, if the places recommended by a tour recommendation system are those either the customer has visited or in similar style with places the customer visited, we have to admit that the accuracy of this system is high but the recommendations are useless.
With the above understanding, we propose in this paper an improved network-based recommendation algorithm to overcome the loss of information resulting from ignoring explicit users’ scores for objects. For the first time (as we know), this paper tries to define users’ interest similarity and user’s representativeness by users’ explicit scores for objects. We validate the proposed network-based approach by performing large-scale random sub-sampling experiments on a widely used data set (Movie Lens), and evaluate our method using two accuracy criteria (the mean rank ratio and the hitting rate). Results demonstrate that our approach remarkably outperforms the ordinary network-based method.
2. Network-Based Recommendation Algorithm (NBR)
As a special case of complex network, bipartite graphs can be applied in lots of areas and situations such as readers purchasing books or users collecting objects. The following is the definition of bipartite graph.
Definition 1: Assuming
 is an undirected graph, if the vertex set V can be divided to two disjoint sets
 , for each
 , if the terminal
and end vertex of e respectively belong to different subsets of V, then G is a bipartite
graph.
, if the terminal
and end vertex of e respectively belong to different subsets of V, then G is a bipartite
graph.
The input data of a recommendation system can be a bipartite graph , which contain users
 , objects
 , and edges
 . There
will be a link
. There
will be a link
 between user and object if the user has given a score to the object. Thus, a recommendation
problem can be converted to a link prediction problem, which is an active research
area in computer science.
between user and object if the user has given a score to the object. Thus, a recommendation
problem can be converted to a link prediction problem, which is an active research
area in computer science.
Network-based recommendation algorithm goes through a two-step reallocation process. At the beginning, each object has some recommendation power which can be allocated to its users equally. Next, each user’s recommendation power got from objects can be reallocated to his/her collected objects equally. The resource reallocation process for each object in the network-based recommendation algorithms can be expressed using the below equation:
 (1)
(1)
Here
 means the importance of
 in
in![]() ’s sense,
’s sense,
 is the degree of
 and
and
 is the degree of
 .
.
The predict score of
 for uncollected object
 (to what extent
 likes
likes ) is given as
 (2)
(2)
For objects with different ratings, the problem is in which case
 should be given the value of 1. Obviously, objects with the worst rating should
not share the same value as those with the best rating. Reference [10] only considers the object whose score is more than 3
(the highest score is 5 and lowest score is 1). Those objects with ratings lower
than 3 are ignored in the process of recommendation source reallocation. However,
this will make the data sparsity problem existing widely in recommendation systems
worse and data sparsity often leads to low accuracy and diversity.
should be given the value of 1. Obviously, objects with the worst rating should
not share the same value as those with the best rating. Reference [10] only considers the object whose score is more than 3
(the highest score is 5 and lowest score is 1). Those objects with ratings lower
than 3 are ignored in the process of recommendation source reallocation. However,
this will make the data sparsity problem existing widely in recommendation systems
worse and data sparsity often leads to low accuracy and diversity.
3. Score-Based Network-Based Recommendation Algorithm (SNBR)
3.1. Interest Similarity
Actually, influence brought by non-target user to target use can come from two aspects. One is common interest and the other is common dislike. For a pair of users, when their ratings for one object are both more than 3, they could contribute recommendation power to each other. In the mean time when their ratings for one object are both less than 3, this object can also increase the similarity of the pair of users.
It is believed that two users have similar interest for an object if they have given the object similar scores. On the contrary, if two users have given object very different scores such as one is 5 and the other is 1, this object will obviously reduce the similarity between the two users. Therefore, this paper defines interest similarity to depict this phenomenon.
Definition 2: Assuming there is a user-object bipartite graph , for any
 ,
,
 , if
, if
 are respectively explicit scores of
 for
for , let
, let
 and
and
 is a tunable coefficient,
 are the highest score and lowest score for
an object in systems, then
are the highest score and lowest score for
an object in systems, then
 is the interest similarity between
 for
for .
.
In Definition 2,
 is the maximum difference between two ratings.
For example, in the five points rating, this is a constant value of 5 − 4
= 1. If the value of
is the maximum difference between two ratings.
For example, in the five points rating, this is a constant value of 5 − 4
= 1. If the value of
 is equal to 1, it means
 and
and
 are the explicit scores of
 for
for , such as 5, 4, 3, 2, 1. When two users’ ratings
are not equivalent,
, such as 5, 4, 3, 2, 1. When two users’ ratings
are not equivalent,
 is used to adjust the influence brought by
the difference of the two ratings. Generally, the value of
is used to adjust the influence brought by
the difference of the two ratings. Generally, the value of
 depends on the difference. If the difference is quite small,
 should be given a relatively small value.
It is because every user has its own habit for ratings. Some users tend to give
4 for their favorite objects while others tend to give 5. On the contrary, if the
difference surpasses the threshold which is regarded as standard to separate common
interest and common dislike,
should be given a relatively small value.
It is because every user has its own habit for ratings. Some users tend to give
4 for their favorite objects while others tend to give 5. On the contrary, if the
difference surpasses the threshold which is regarded as standard to separate common
interest and common dislike,
 should be given a bigger value which can better
reflect the fact that this object low the similarity of the pair of users. Thus,
the value of
should be given a bigger value which can better
reflect the fact that this object low the similarity of the pair of users. Thus,
the value of
 had better be dynamic and change while the difference of two ratings changes. For
example, if the difference of two ratings is 1, then
had better be dynamic and change while the difference of two ratings changes. For
example, if the difference of two ratings is 1, then
 can be set as 1. If the difference of two ratings becomes 3, then
 can be set as 5. The value of
 should be decided by experiments. But in this paper, we set
 static and try to find its optimal value.
3.2. Representativeness
Think about such a situation. If a student and an expert both recommend an essay, it is undoubted that the expert’s recommendation shows more persuasion than the student’s because the expert is more representative and authoritative. It is true that every user has its own unique interest. But usually, before recommendation, we consider the user owning common preference. For example, Forrest Gump is regarded as a classic movie by whoever watched it. Then we think the possibility that the target user will give a low rating to Forrest Gump is not high. Therefore, in the process of recommendation, we believe that a user will be much more helpful for the target user if his/her scores for objects are usually close to the average score of objects. Therefore, this paper defines user’s representativeness to describe the above understanding.
Definition 3: Assuming there is a user-object bipartite graph , for any
 , let
, let

here
 is the number of the total objects,
 is the average score of
 , then
 is
is ’s representativeness.
In the above definition, the maximum value of
 is 1 which means each rating of
 is equal to the average rating of the corresponding object. The possibility for
 getting the value of 1 is almost impossible in the integral rating. There is not
lowest limit for
getting the value of 1 is almost impossible in the integral rating. There is not
lowest limit for
 and when the value of
 is small enough, it means
 has quite different preference. In this case, target user will not get much recommendation
sources from
has quite different preference. In this case, target user will not get much recommendation
sources from .
.
3.3. Improved Algorithm
In this paper, we changed the sequence of source reallocation steps. At the beginning, we assume each user has some recommendation power which can be allocated to his/her scored objects equally. Next, each object’s recommendation power got from users can be reallocated to its users equally. The resource reallocation process for each user in the scored-based network-based recommendation algorithms can be expressed using the below equation:
 (3)
(3)
here
 means the importance of
 in
in ’s sense and
 is the degree of
 and
and
 is the degree of
 .
.
When considering both interest similarity and representativeness, the equation is:
 (4)
(4)
The predict score of
 for unevaluated object
 (to what extent
 likes
likes ) is given as:
 (5)
(5)
here
 is the average score of
 for all the scored objects and so is
 .
.
The following is the steps of the new proposed method:
Input: user-object matrix
 and target user
 .
.
Output: recommendation list of .
.
Step 1: According to the definition of representativeness, calculate each user’s
representativeness .
.
Step 2: According to the definition of Interest Similarity, calculate the similarities
between target user and other users for each object. Then get
 by the third formula.
Step 3: Predict the ratings for objects that target user hasn’t rated by Formula 5.
Step 4: Sort candidate objects for the target user in non-ascending order according to their discriminate scores and obtain a ranking list of the candidates.
Step 5: Evaluate the output by predefined criteria. Adjust the parameter
 and return to step 2 until
 getting the optimal value.
4. Experimental Results
4.1. Data and Criteria
We use a benchmark data-set, namely, MovieLens, to evaluate the performance of described algorithms. The Movie Lens data is downloaded from the web-site of GroupLens Research (http://www.grouplens.org). The data consists 1682 movies (objects) and 943 users. MovieLens is a rating system, where each user votes movies in five discrete ratings 1 - 5 and higher rating means high likeness.
We use a repeated random sub-sampling strategy to validate the proposed approach. In each validation run, we split at random known links between objects and users into a training set that contains 80% data and a test set that contains the rest 20% data. During the experiments, we found that if the training dataset contains less than 60% data, all of the algorithms show disappointing performances because training data is not enough to train a trusted similarity among users. If the ratio between training data and test data reaches less than 8:2, we can clearly see their different performances on each criterion.
We select rank score and hitting rate to evaluate algorithm. Ranking score, which exhibits global prediction accuracy is the average rank of the predictions in the user’s unevaluated objects list, and can be defined as follows:
 (6)
(6)
here
 is the objects set of
 in probe set,
 is the position of
 in
in ’s recommendation list,
 is the number of total objects in data set and
 is the degree of
 in training set.
Hitting rate demonstrates the relation between the number of hitting objects (object in recommendation list appears in probe set) and the length of recommendation. Hitting rate can be defined as follows:
 (7)
(7)
Here
 is the number of hitting objects (in this paper, we only count those recommendations
whose real explicit scores found in probe set are more than 3 as hitting objects)
and
is the number of hitting objects (in this paper, we only count those recommendations
whose real explicit scores found in probe set are more than 3 as hitting objects)
and
 is the number of one user’s objects in probe set.
4.2. Performance of Algorithm
This paper compares performances of NBR, INBR (Ref. [11] ) and SNBR on rank score and hitting
rate. According to reference
[11] , we set the parameters appearing in the algorithm as
 (optimal value). Besides, we investigate the impact of
 on SNBR and prove the necessity of considering user’s representative. Table 1 has shown the performances of NBR, INBR and SNBR
on rank score (
on SNBR and prove the necessity of considering user’s representative. Table 1 has shown the performances of NBR, INBR and SNBR
on rank score ( and the length of recommendation
list is 10).
and the length of recommendation
list is 10).
According to the formula of rank score, the smaller rank score is, the better the algorithm is. If target user’s interesting objects appear in the front of the recommendation list, it usually leads to a small rank score. From Table 1, we can see that the new proposed method outperforms the original network-based algorithm and the improved algorithm in reference [11] on rank score.
Figure 1 shows the performance of NBR and SNBR
on hitting rate when
 in SNBR (without user’s repetitiveness).
From Figure 1, we can see that hitting rates of both of the algorithms increase along with the increasing of the length of the recommendation list. But SNBR surpasses the NBR whatever the length is and their difference are increasing.
Figure 2 is the impact of
 on SNBR (here we only list the data when the length of recommendation list is 100).
It is clear that
 has optimal value when the length of recommendation list is constant as seen in
the Figure 2. If the difference between two ratings
for one object is big such as one rating is 1 and the other is 5, then a bigger
has optimal value when the length of recommendation list is constant as seen in
the Figure 2. If the difference between two ratings
for one object is big such as one rating is 1 and the other is 5, then a bigger
 is helpful to differentiate the two users. On the contrary, small difference needs
a small
is helpful to differentiate the two users. On the contrary, small difference needs
a small . There

Table 1.Performance of NBR, INBR and SNBR on rank score.
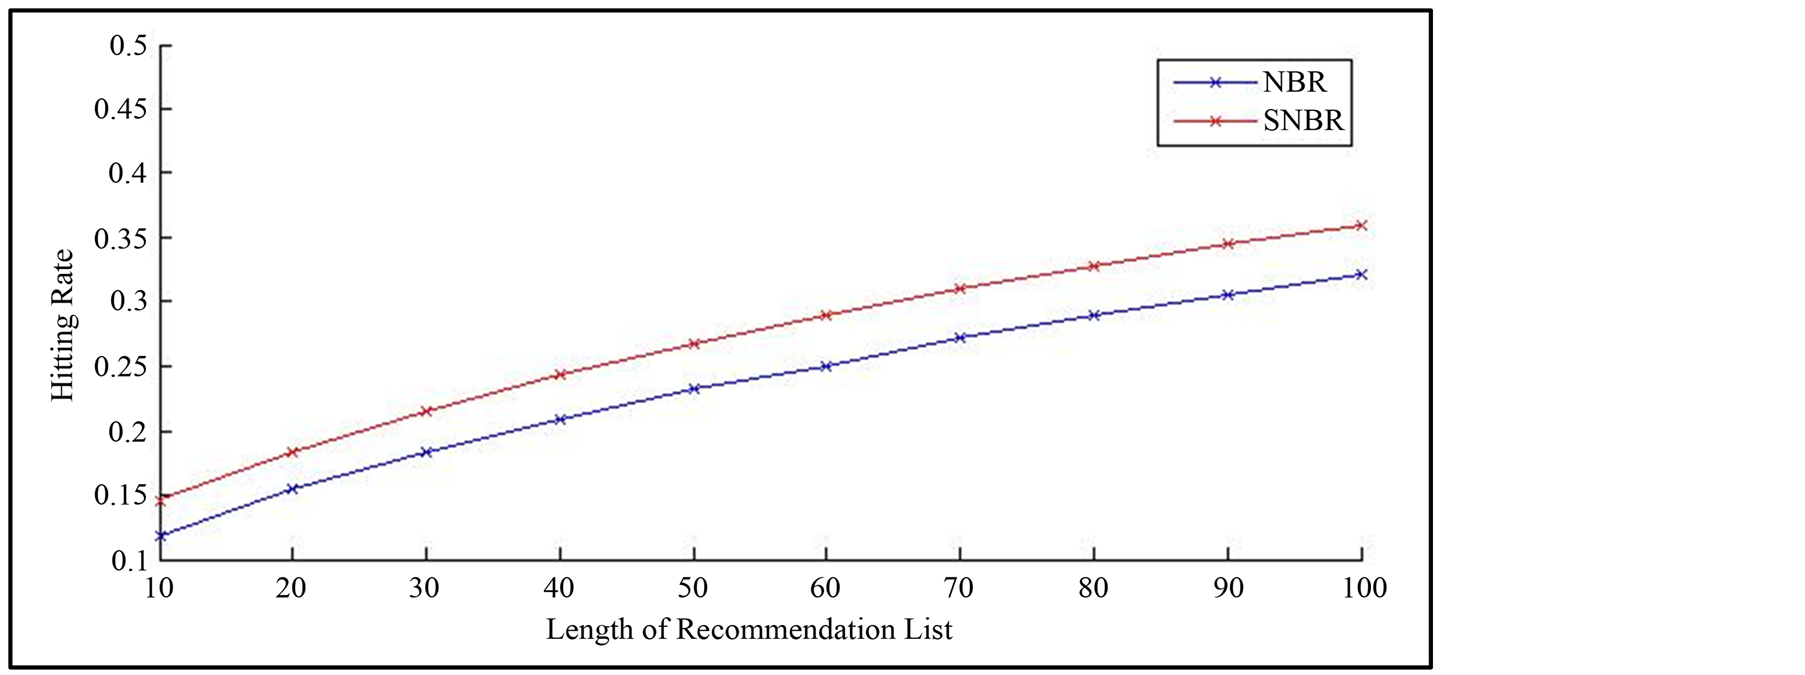
Figure 1. Performance of NBR and SNBR on hitting rate.
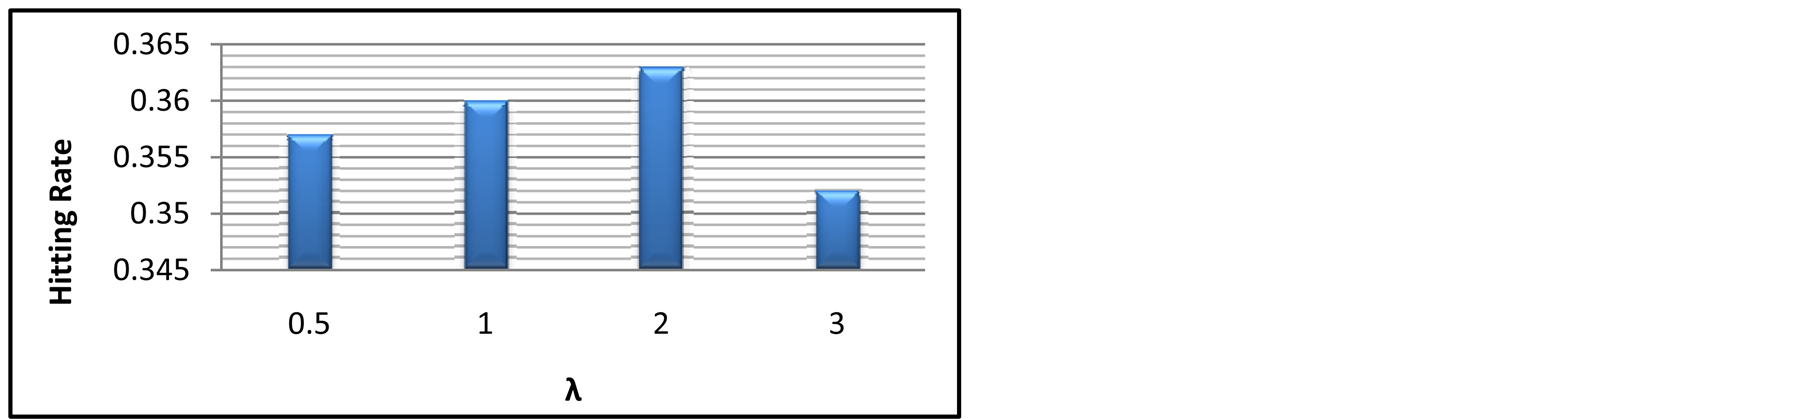
Figure 2. Impact of λ on SNBR.
fore, in order to keep a balance, there exists an optimal value for . Through experiments, we find that
the optimal value is between the intervals of 1 - 2.
. Through experiments, we find that
the optimal value is between the intervals of 1 - 2.
Figure 3 shows the performance when considering user’s repetitiveness or not in SNBI. We can see that user’s representativeness has a positive influence for recommendation accuracy.
Figure 4 compares the performance of SNBI when considering user interest and user’s repetitiveness in INBR and NBR. And the result demonstrates that our approach remarkably outperforms the other tow network-based methods.
5. Summary
In this paper, we have proposed an improved network-based recommendation algorithm
to achieve better personalized recommendation by considering users’ explicit scores
for objects. Ignoring explicit scores is easy to result in loss of information and
even sparser data, which leads to low recommendation accuracy. The proposed method
achieves superior performance mainly due to the transferring explicit scores to
users’ interest similarity and representativeness. Thus, Two additional parameters
 and
and
 are introduced in this algorithm. We investigated the recommendation performance
using two accuracy measures on a benchmark data set, MovieLens. Numerical experiments
demonstrate the higher accuracy of our method comparing with the original one and
the necessity of the proposal of interest similarity and representativeness.
are introduced in this algorithm. We investigated the recommendation performance
using two accuracy measures on a benchmark data set, MovieLens. Numerical experiments
demonstrate the higher accuracy of our method comparing with the original one and
the necessity of the proposal of interest similarity and representativeness.
The success of the proposed method mainly lies in the introduction of interest similarity
and representativeness. Certainly, the proposed method can be further investigated
from the following aspects. First, try to get the optimal value of . This paper only uses the approximate
value of
. This paper only uses the approximate
value of . The future work can focus on how
to solve the optimal problem. Second, try to get the optimal combination of
. The future work can focus on how
to solve the optimal problem. Second, try to get the optimal combination of
 and
and . The future work can
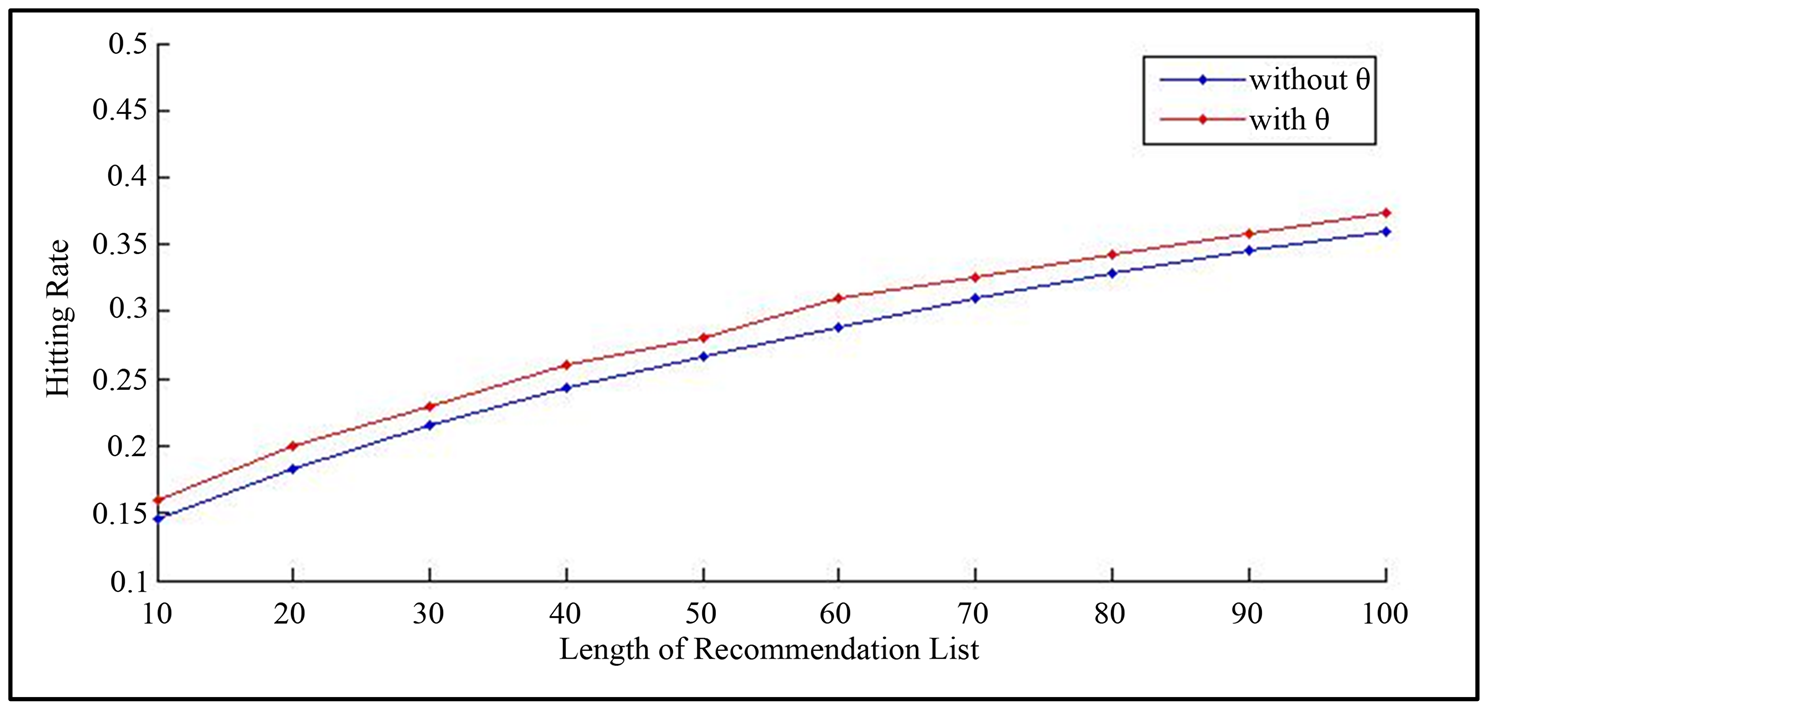
Figure 3. Performance of SNBR when considering user’s representativeness.
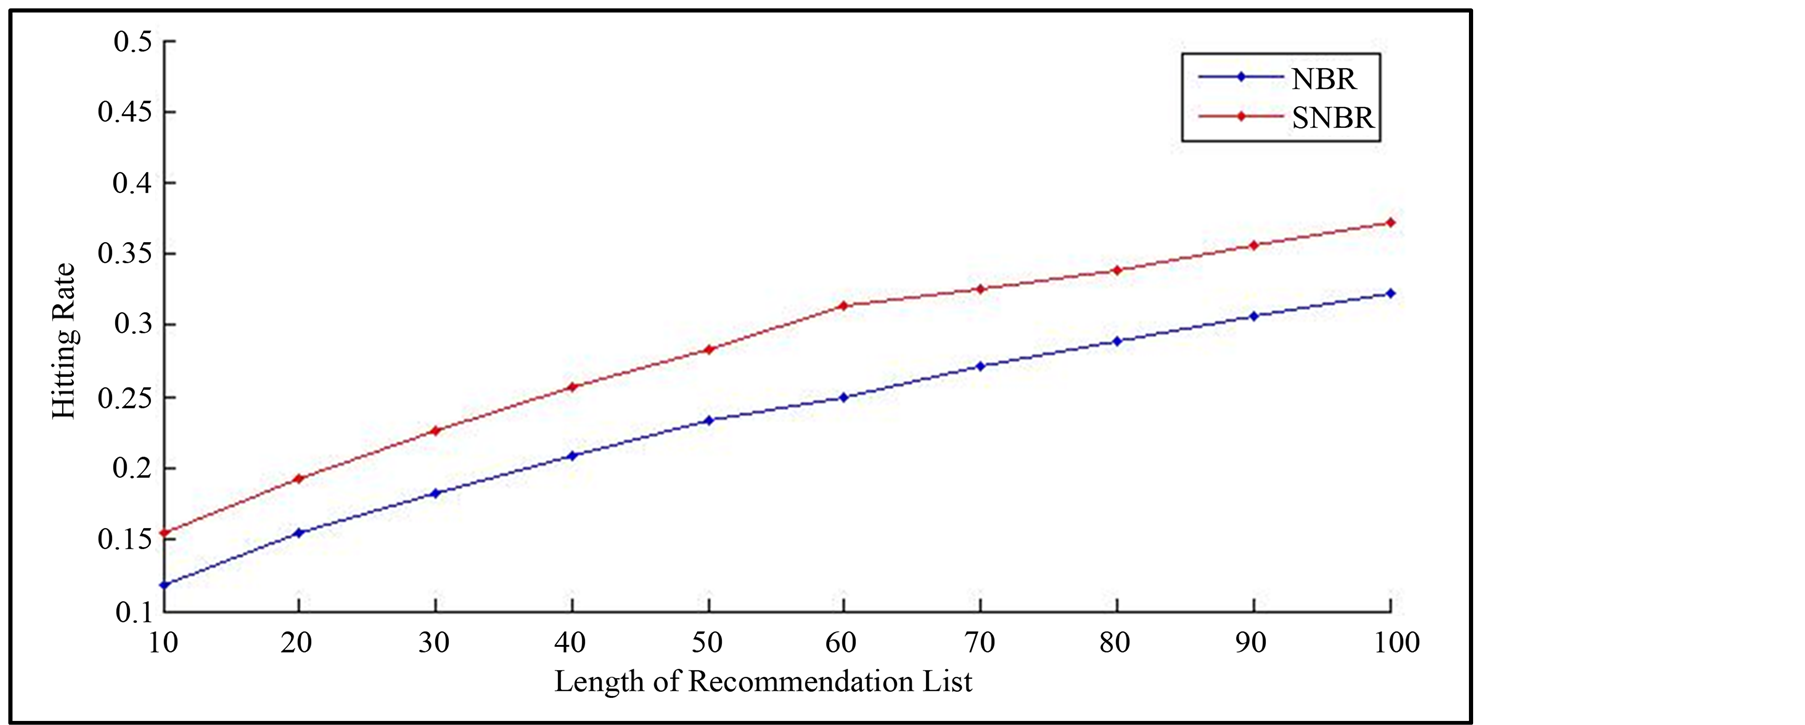
Figure 4. Performances of three algotithms when considering user interest and user’s repetitiveness in SNBR.
focus on whether there exits optimal combination of
 and
and
 in order to achieve the improvement of recommendation accuracy.
Acknowledgements
This work was partially supported by National Natural Science Foundation Project (71373123), the NUAA Fundamental Research Funds (NS2013080) and the Fundamental Research Funds for the Central Universities (NJ20140033).
References
- Huang, Z., Zeng, D.D. and Chen, H. (2007) Analyzing Consumer-Product Graphs: Empirical Findings and Applications in Recommender Systems. Management Science, 53, 1146-1164. http://dx.doi.org/10.1287/mnsc.1060.0619
- Lü, L.-Y. and Zhou, T. (2011) Link Prediction in Complex Networks: A Survey. Physica A: Statistical Mechanics and Its Applications, 390, 1150-1170. http://dx.doi.org/10.1016/j.physa.2010.11.027
- Sarukkai, R.R. (2000) Link Prediction and Path Analysis Using Markov Chains. Computer Networks, 33, 377-386. http://dx.doi.org/10.1016/S1389-1286(00)00044-X
- Liben-Nowell, D. and Kleinberg, J. (2007) The Link-Prediction Problem for Social Networks. Journal of the American Society for Information Science and Technology, 58, 1019-1031. http://dx.doi.org/10.1002/asi.20591
- Zhou, T., Kuscsik, Z., Liu, J.G., et al. (2010) Solving the Apparent Diversity-Accuracy Dilemma of Recommender Systems. Proceedings of the National Academy of Sciences of the United States of America, 107, 4511-4515. http://dx.doi.org/10.1073/pnas.1000488107
- Zhou, T., Ren, J., Medo, M. and Zhang, Y.-C. (2007) Bipartite Network Projection and Personal Recommendation. Physical Review E, 76, 1-7. http://dx.doi.org/10.1103/PhysRevE.76.046115
- Zhou, T., Jiang, L.L., Su, R.Q., et al. (2008) Effect of Initial Configuration on Network-Based Recommendation. Europhysics Letters, 81, 1-4. http://dx.doi.org/10.1209/0295-5075/81/58004
- Zhou, T., Su, R.Q., Liu, R.R., et al. (2009) Accurate and Diverse Recommendations via Eliminating Redundant Correlations. New Journal of Physics, 11, 1-19. http://dx.doi.org/10.1088/1367-2630/11/12/123008
- Liu, C. and Zhou, W.X. (2012) Heterogeneity in Initial Resource Configurations Improves a Network-Based Hybrid Recommendation Algorithm. Physica A: Statistical Mechanics and Its Applications, 391, 5704-5711. http://dx.doi.org/10.1016/j.physa.2012.06.034
- Guan, Y., Zhao, D.D., Zeng, A. and Shang, M.-S. (2013) Preference of Online Users and Personalized Recommendations. Physica A: Statistical Mechanics and Its Applications, 392, 3417-3423. http://dx.doi.org/10.1016/j.physa.2013.03.045
- Wang, Q. and Duan S.Y. (2013) Improved Recommendation Algorithm Based on Bipartite Networks. Application Research of Computers, 30, 771-775.
- Herlocker, J.L., Konstan, J.A., Terveen, K., et al. (2004) Evaluating Collaborative Filtering Recommender Systems. ACM Transactions on Information and Systems, 22, 5-53. http://dx.doi.org/10.1145/963770.963772
- Billsus, D. and Pazzani, M.J. (1998) Learning Collaborative Information Filters. Proceedings of the 15th International Conference on Machine Learning, Madison, 26-30 July 1998, 46-54.
- Linden, G. (2009) What Is a Good Recommendation Algorithm. http://cacm.acm.org/blogs/blog-cacm/22925-what-is-a-good-recommendation-algorithm/fulltext.
- Wei, W., Liu, Q. and Zhang, L. (2013) Review on Diversity in Personalized Recommender Systems. Library and Information Service, 57, 127-136.