Positioning
Vol.2 No.4(2011), Article ID:8314,5 pages DOI:10.4236/pos.2011.24014
Temporal Variations of GPS Irregularities at Conjugate Points under Storm Conditions
![]()
1Department of Communications and Electronics Engineering, College of Engineering, Jerash University, Jerash, Jordan; 2Department of Electrical Engineering, Faculty of Engineering Technology, Al-Balqa Applied University, Al-Salt, Jordan; 3Department of Computer Science, Faculty of Science and Technology, Universiti Malaysia Terengganu, Terengganu, Malaysia.
Email: *mhomom@yahoo.com
Received August 22nd, 2011; revised September 26th, 2011; accepted October 28th, 2011.
Keywords: GPS, Geomagnetic Storm, Scintillation, TEC, Conjugate Point
ABSTRACT
The paper investigates the temporal variations of GPS irregularities at quasi-conjugate points in the polar region during the October-November 2003 Halloween storm. The pseudorange and carrier phase observables obtained from dual frequency GPS receivers of Trimble 5700 at Scott Base Station in Antarctica and Ashtech Z-X113 at Resolute Bay in Nunavut, Arctic are employed in determination the ionospheric total electron content (TEC) and scintillation parameters. The comparison of TEC and scintillation parameters at both stations show: dominant occurrence of positive storm phases over the nightside hemisphere, dominant occurrence of negative storm phases over the dayside hemi-sphere, the periods of pronounced scintillation activity at both hemispheres were coincident with the TEC enhancement periods, the weak scintillation periods are coincident with the TEC depletion periods. The strong TEC enhancement during the sudden storm commencement of the geomagnetic storm was only seen over the nightside station and finally obvious asymmetry in the ionospheric TEC and scintillation activity between summer and winter hemispheres was observed. The results over the polar were in good agreement with previous measurements made by other researchers over the subauraral and midlatitude regions.
1. Introduction
The ionosphere is prone to significant disturbances, which are considerably worse during periods of high solar activity [1]. Large number of observations indicates that the primary cause of geomagnetic storms is the long duration of southward Interplanetary Magnetic Field (IMF). The southward IMF Bz plays an important role in determination the amount of solar wind energy to be transferred into the magnetosphere. In the Earth’s magnetosphere, the charged particles are trapped on the same field line and therefore conjugate points could be affected by the same population [2]. Any two points on Earth’s surface are geomagnetically conjugate if they are on opposite ends of the same geomagnetic field line.
Several studies were made to investigate the similarities of the ionospheric total electron content (TEC) and compare the response between northern and southern hemispheres [3-5]. Most of these studies are highly concentrated on middle and subauroral latitudes but poorly investigated at high latitude regions especially in Antarctica. This paper examines the temporal variations of GPS TEC and scintillation measurements at conjugate points under storm conditions. The measurements have been conducted during the October 2003 geomagnetic storm at approximately conjugate stations in the polar region, Scott Base station, Antarctica (SBA) (GC: 77.85˚S, 166.76˚E; CGM: –79.94˚S, 327.23˚E; LT = UT + 12) and Resolute Cornwallis Island station (RESO) at the high Arctic region (GC: 74.69˚N, 265.12˚E; CGM: 83.17˚N, 320.95˚E; LT = UT – 5). In the analysis, the diurnal variations of ionospheric TEC and scintillation and the percentage of TEC deviation (ΔTEC%) obtained from ground-based GPS receivers at the conjugate polar stations will be compared. The paper is organized as follows; Section 1 introduced the paper. Section 2 briefly discusses the magnetic storms conditions, Section 3 describes the measurement system and data processing, Section 4 presents the results and discussion followed by the conclusion in Section 5.
2. Measurement Setup
The measurement setup at SBA station consists of a Trimble TS5700 24-channel, high precision, dual-frequency GPS receiver, Trimble Zephyr Geodetic antenna and a Dell notebook computer for data logging. The Trimble Zephyr Geodetic antenna has improved accuracy, resulting from sub-millimeter phase centre repeatability, enhanced multi path resistance, and superior satellite tracking at all elevation angles and in difficult environments. The receiver was set to tracks GPS signals at 1 second sampling rate and the cutoff elevation angles was set to 13˚ to maintained the quality of the data. These data are further processed to provide 30 second sampling rate. The measurement system at RESO station consists of Ashtech Z-X113 dual frequency GPS receiver. The Ashtech Z-XII3 receiver, uses the carrier phase and averaging to smooth the pseudorange observations, but with the Ashtech translator the smoothing rate can be selected at the data translation step by the user. In the analysis, the GPS data obtained from both stations were at 30 second sampling rate and above 30˚ cutoff elevation. These data are utilized in determination the absolute vertical TEC (VTEC) and scintillation measurements. The calculation procedure for the GPS VTEC, Percentage deviation of TEC and rate of change of TEC measurements are discussed in the next section.
3. Calculation Procedure
The absolute GPS TEC can be obtained from differential time delay (P1-P2) or from differential phase advance (L1-L2) where P1, P2 are the GPS pseudorange observables (in meter), and L1 and L2 are the GPS carrier phase measurements (in cycles). However, the TEC obtained from differential time delay gives the absolute TEC level but it is highly exposed to multipath effect and contains delays inherent in satellite and receiver hardwares [6] while the TEC obtained from differential phase advance gives high precision TEC but a level of TEC is unknown because of unknown initialization constant in phase data (i.e. ambiguity term). Therefore, the level of TEC is adjusted to the TEC derived from the corresponding pseudorange difference (P2-P1) for each satellite-receiver pair [6]. To get absolute TEC values, the time delay measurements are used to determine the ambiguity term then by combination the GPS carrier phase with the code measurements for each satellite receiver pair, the absolute TEC value can be obtained with high precision [7]. The equivalent vertical TEC for each satellite receiver pair is determined by multiplying the slant TEC with zenith angle of the line of sight at the subionospheric point [8]. Beside the VTEC measurements, the percentage deviation of the absolute TEC measurements (ΔTEC%) was used to describe the perturbation components of the TEC measurements and to determine the fluctuation of the positive and negative storm phases around the zero level. This index is derived by subtracting the TEC values under quiet storm conditions from the TEC values under disturbed conditions where the quite day is the day where the 3-hour kp index is ≤2. The rate of change of GPS TEC (ROT) (in TECU/min) was also used in the analysis to describe the high frequency changes in the TEC due to irregular ionospheric phenomena such as the traveling ionospheric disturbances (TIDs) and scintillation occurrence [9]. The method of determination the rate of change of TEC measurements does not require the estimation of real ambiguity as long as no cycle slips occurs, it is directly determined from the geometry free combination of the phase measurements [9]. The total scintillation index (Σ scintillation) was used to characterize the scintillation activity during storm periods. For each satellite path over the GPS station, the index integrates the scintillation readings that exceed 0.3 TECU/min.
4. Results and Discussion
The October 2003 storm is regarded as the greatest storm during the 23rd solar cycle and it is one of the fastest traveling solar storms in the last two decades. The period from 28th October to 1st November of 2003 was characterized by extreme solar activity that resulted in a series of intense geomagnetic storms. The extreme interplanetary and geomagnetic disturbances during the October 2003 storm were related to the eruptive activity of the sun. The event was preceded by high solar X-ray energy for one week before the onset of the storm [10]. The maximum X-ray energy for this storm was recorded at 09:51 UT on 28th October with a series of X17.2/4B flares accompanied by bursts of radio emissions and ejections of solar mass were observed. The most intense storm activity was observed on 29th and 30th October 2003 with two high speed streams of solar wind originated from the coronal hole on the sun disk.
Figure 1 presents the Dst and kp magnetic indices obtained from the world data centre and GPS-TEC and ΔTEC% measurements at SBA and RESO conjugate points during the October 2003 storm. As shown in Figure 1(a), three Dst minima with maximum values of –180 nT, –363 nT and –401 nT are observed at around 12:00 UT on 29th October, 01:00 UT and 23:00 UT on 30th October 2003. The kp index reached its maximum value of 9 two times on 29th October mainly at 09:00 UT and 21:00 UT, and once on 30th October at round 21:00 UT. The daily GPS-TEC and ΔTEC% measurements at both stations are shown in Figure 1(c) and Figure 1(d). The figures show that the absolute TEC measurements at conjugate points follow the magnetic field variations where the maximum TEC activity is usually seen at maximum kp and Dst indices. Prior to the midday time
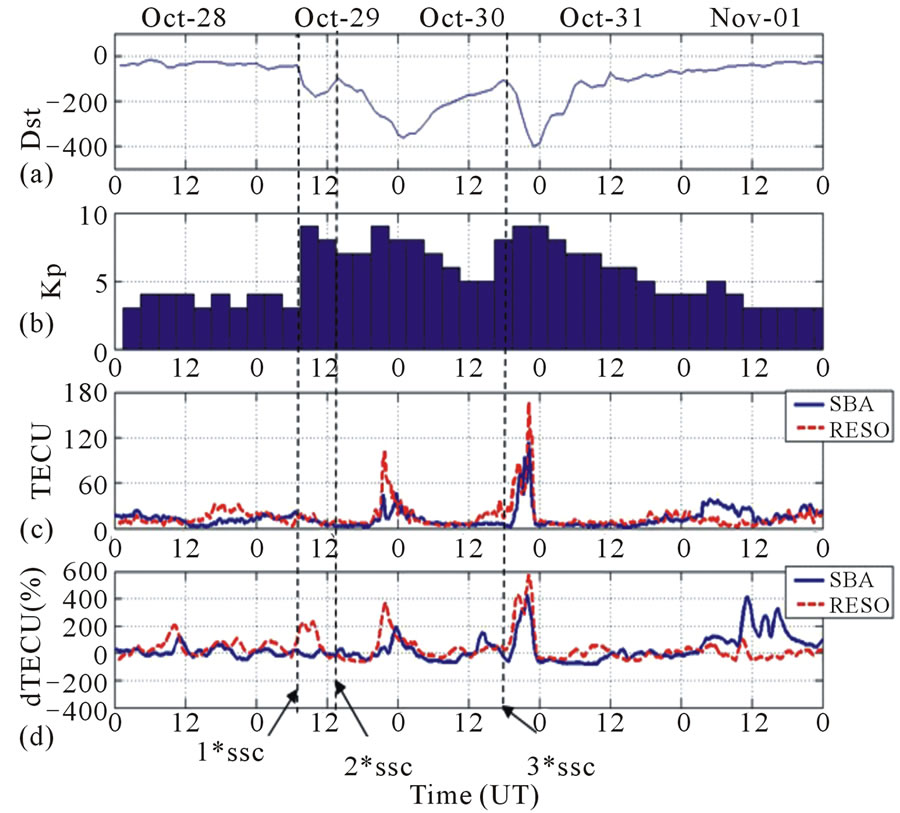
Figure 1. The daily Dst index, planetary Kp index, Absolute VTEC and ΔTEC% variations at SBA and RESO conjugate stations during the October 2003 storm (a). Dst index; (b). Kp index; (c). VTEC measurements; (d). ΔTEC% measurements.
on 28th October 2003, the TEC level was higher at SBA station in the dayside hemisphere by 5 TECU. Following that time, the TEC level became higher at RESO station in the nightside hemisphere by a maximum difference of 20 TECU. Although the absolute TEC activity shows enhancement following the midday time at RESO station, the ΔTEC% measurements shows occurrence of TEC enhancement around 11:00 UT with 200% at RESO and 130% at SBA station. The TEC enhancement during this time was coincident with the X17.2/4B X-Ray flares that took place at 09:51 UT on 28th October.
During the 29th October, the TEC shows similar response at both stations with more pronounced TEC activity occurred over the dark side hemisphere. During the first sudden storm commencement (SSC) at around 06:30 UT on 29th October until second SSC time at 12:00 UT, obvious TEC enhancement was seen at RESO station with maximum ΔTEC% is 200%. The strong nighttime TEC enhancement at the 1st SSC time is probably induced by the particle precipitation as suggested by Baran et al. [11]. Following that time, sudden increase in the TEC was observed between 18:00 UT on 29th October till 03:00 UT on 30th October 2003. During this time, the maximum recorded TEC was 47 TECU at SBA station and 100 TECU at RESO station and the maximum recorded ΔTEC% were 190% at the dayside SBA station and 380% at RESO station. Another sudden increase of TEC was observed during the period between 17:00 UT and 23:00 UT on 30th October 2003 with a maximum TEC value of 100 TECU at SBA and 170 TECU at RESO station. During this period the maximum ΔTEC% values were 580% at RESO and 420% at SBA station. The strong TEC activity on 30th October is related to the strong solar activity that was observed during this time as at 17:00 UT on 30th October 2003 sudden increase in the solar wind speed due to arrival of CME was recorded. The long duration of positive storm phase on 29th and 30th October at both stations is probably due to mechanism of disturbance solar wind energy penetration to the ionospheric heights or due to the transportation of ionization either by electric field or by the thermospheric winds [12].
The enhanced period on 30th October was followed by quiet TEC condition until the morning of 1st November 2003. Long duration of negative percentage TEC with trough-like figure was clearly seen over the day side hemisphere. This affect is probably due to the impulsive precipitation particle energy at the dayside cusp region which accordingly causes sharp density depletion as suggested by Idenden [13]. Based on this research, the increase in the recombination rate due to ion neutral friction heating caused by rapid ion flow through dayside convection throat in the cusp region could produce significant depletion in the F-region of the dayside ionosphere. The significant ionization activity at SBA dayside station during the 1st November 2003 was not seen at the RESO station. Pronounced TEC activity was observed over the dayside hemisphere particularly between 12:00 - 24:00 UT with maximum value of 30 TECU. Quiet TEC conditions were observed over the night side hemisphere during this time. This positive storm phase over the dayside station on 1st November is probably due to the trough infilling caused by the increased particle precipitation [14].
The daily total TEC measurements (Σ TEC) at the conjugate points obtained from the summation of TEC values during the October 2003 storm are shown in Figure 2. As shown in the figure, more pronounced TEC activities are clearly seen at the dark side hemisphere except on 1st November where the TEC at dayside station SBA was higher than the TEC at the dark side station by 2 times. The ratio between the two stations (TECRESO/ TECSBA) was 1.3, 1.4, 1.5 and 0.5 respectively.
The GPS scintillation measurements obtained from Rate of TEC (ROT) measurements during the storm period at SBA and RESO stations is shown in Figure 3. During 28th October 2003, weak scintillation activity was observed at both sites with maximum scintillation value of 0.6 TECU/min at SBA and 0.7 TECU/min at RESO. The total scintillation (Σ scintillation) that exceeded 0.3 TECU/min threshold during this day were more pronounced at RESO with values of 8.4 TECU/min at SBA and 49 TECU/min at RESO (5.8 times). During the 1st SSC period around 06:30 UT on 29th October 2003, weak scintillation activity was observed at both sites
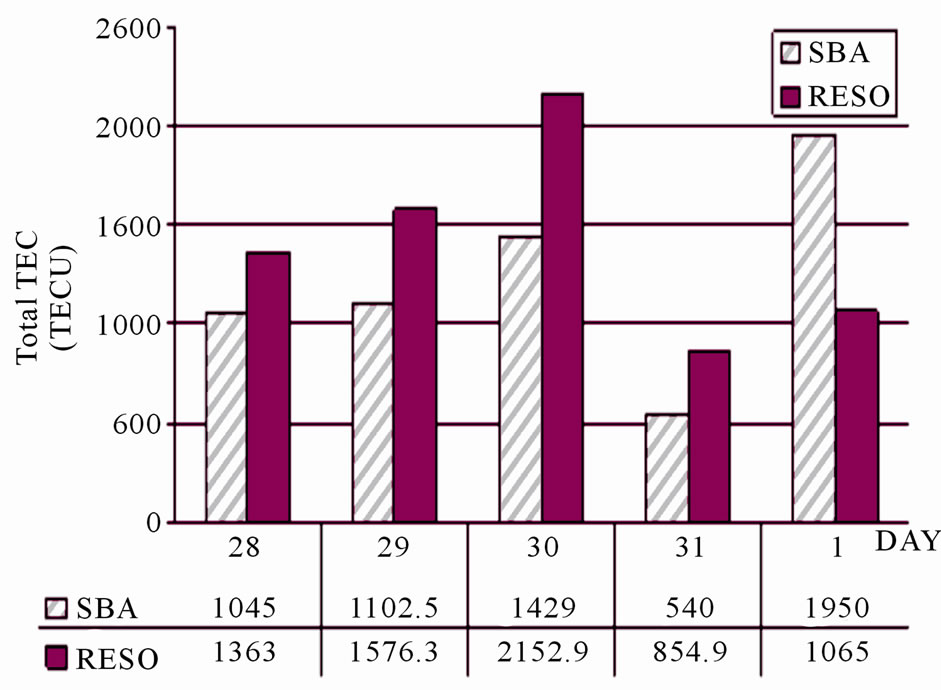
Figure 2. Total daily TEC measurements during the October 2003 storm at the RESO and SBA conjugate stations.
with maximum scintillation values were 0.6 TECU/min at SBA station and 0.7 TECU/min at RESO station. During the evening UT time on 29th October 2003, pronounced scintillation activity was observed at both conjugate points particularly between 20:00 UT on 29th October and 02:00 UT on 30th October at SBA station and between 19:00 UT on 29th October and 02:00 UT on 30th October at RESO. The maximum scintillation readings during this period were 2.1 TECU/min at SBA and 1.2 TECU/min at RESO station. The total scintillation activity and scintillation durations during 29th October 2003 were more pronounced at the dark side hemisphere by 1.3 and 1.2 respectively (111.1 TECU/min and 6 hours at SBA and 146.5 TECU/min and 7 hours at RESO).
Following 02:00 UT on 30th October 2003, quiet scintillation activity was observed at the conjugate points which persisted until the evening UT time where another intense scintillation period was observed. The intense scintillation period was observed between 20:00 UT and 23:00 UT at SBA station and between 17:00 UT and 23:00 UT at RESO station. The maximum scintillation readings at both stations during this period were 4.3 TECU/min and 2.7 TECU/min respectively. The total scintillation activity and scintillation durations during 30th October 2003 was more pronounced at the dark side hemisphere with a factor of 1.3 and 1.2 respectively (111.1 TECU/min and 6 hours at SBA and 146.5 TECU/ min and 7 hours at RESO). During this day, the total scintillation readings at both stations were nearly same with longer durations are seen at RESO site. The total scintillation and duration measurements were about 564 TECU/min and 3 hours at SBA station and 498 TECU/ min and 6 hours at RESO station (factors of 0.9 and 2 respectively). The strong nighttime scintillation activity during 29th and 30st October 2000 over the dark hemisphere represented by RESO station is probably induced by the particle precipitation mechanism. The daily total scintillation activity on 31st October 2003 was generally weak with total values of 6.1 TECU/min at SBA and 24.6 TECU/min at RESO station (factor of RESO/ SBA is 4). Pronounced scintillation activity during this day was only seen during the evening UT time until midnight with maximum values of 1 TECU/min was recorded at both stations. During the 1st November, the scintillation activity is more pronounced at the day hemisphere represented by SBA station than at RESO station by a factor of 1.6 (the values of Σ scintillation were 87 TECU/min at SBA and 54.1 TECU/min at RESO station).
The total daily scintillation readings (daily scintillation values > 0.3 TECU/min) during the storm period between 28th October and 1st November 2003 is presented in Figure 4. As shown in the figure, higher scintillation activity was seen over the dark hemisphere (i.e. RESO) on 28th, 29th and 31st October 2003 respectively while more pronounced activity at the day side hemisphere was seen on 30th and 1st November 2003. Table 1 summarizes total TEC, scintillation and duration of positive/ negative storm phases above the threshold of Kp = 2, As seen in the table, pronounced activity is seen over the nightside hemisphere (factor of 1.3 for TEC and 1.1 for scintillation).
5. Conclusions
The paper compares the GPS-TEC variations, ΔTEC% and scintillation measurements at conjugate points during the severe storm event of October 2003 storm. The data from ground-based dual frequency Trimble 5700 GPS receiver at SBA station, Antarctica and the Ashtech Z-X113 GPS receiver at RESO station in the high Arctic are used in the analysis. The comparison of TEC and scintillation parameters at both stations show: dominant occurrence of positive storm phases over the nightside
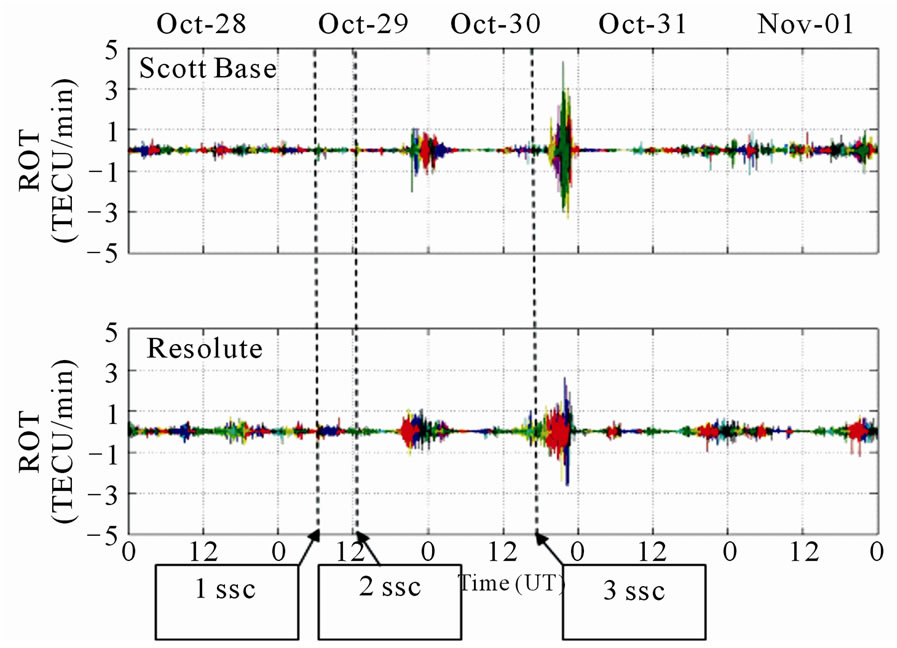
Figure 3. The ionospheric scintillation measurements between 28th October and 1st November 2003 at both SBA and RESO stations.
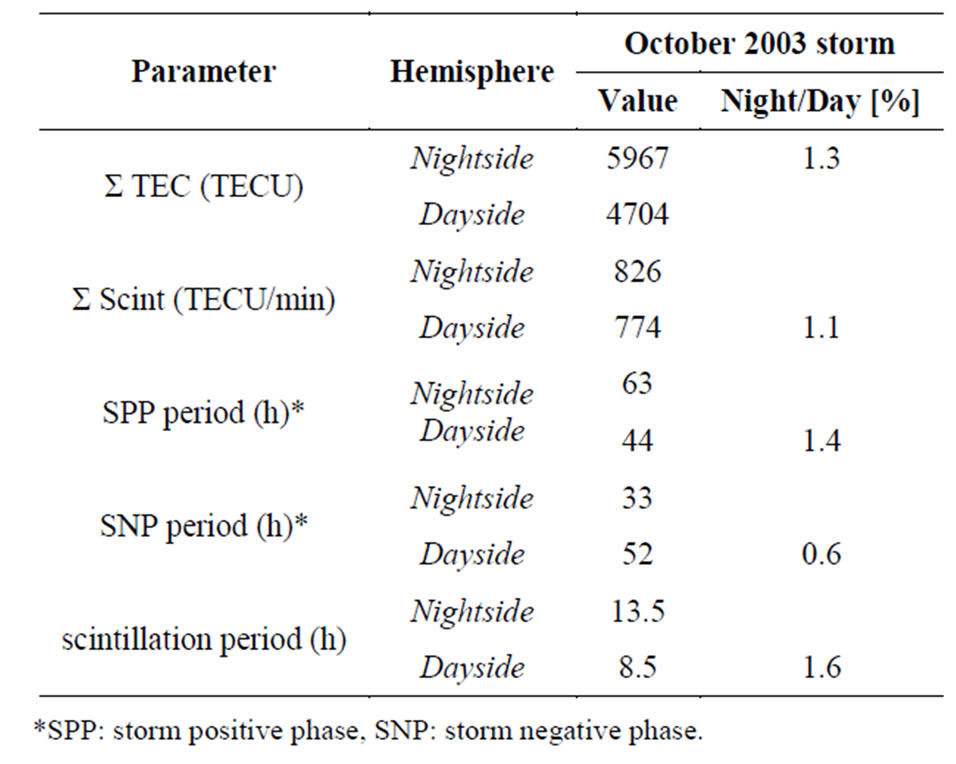
Table 1. Total ionospheric TEC and scintillation activities during the October 2003 geomagnetic storm.
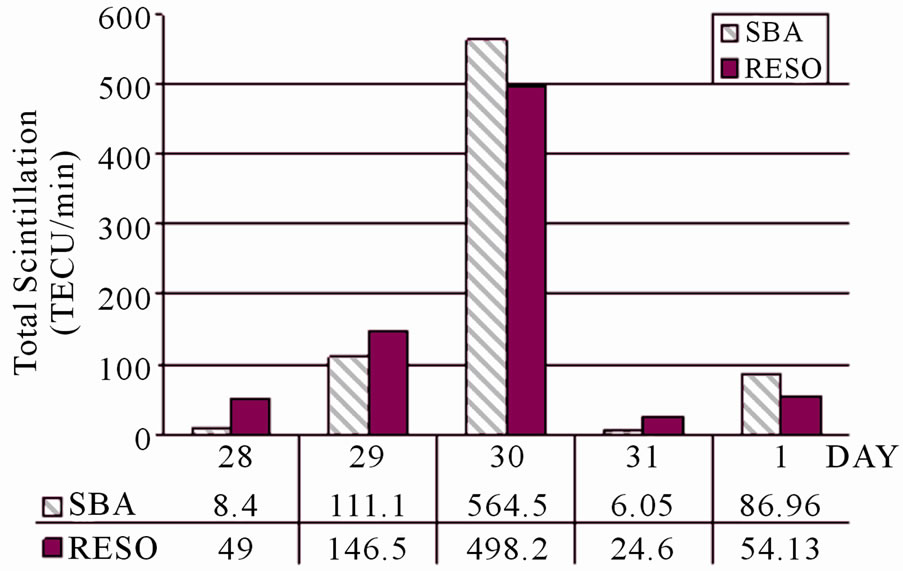
Figure 4. Total daily scintillation measurements during the October 2003 storm at SBA and RESO conjugate stations.
hemisphere, dominant occurrence of negative storm phases over the dayside hemisphere ,the periods of pronounced scintillation activity at both hemispheres were coincident with the TEC enhancement periods, the weak scintillation periods are coincident with the TEC depletion periods. The strong TEC enhancement during the sudden storm commencement of the geomagnetic storm was only seen over the nightside station, and finally obvious asymmetry in the ionospheric TEC and scintillation activity between summer and winter hemispheres was observed.
REFERENCES
- A. Dodson, T. Moore, M. H. Aquino and S. Waugh, “Ionospheric Scintillation Monitoring in Northern Europe,” ION GPS 2001 Conference, Salt Lake City, 11-14 September 2001, pp. 2490-2498.
- A. Rodger and J. Aarons, “Studies of Ionospheric F-Region Irregularities from Geomagnetic Mid-Latitude Conjugate Regions,” Journal of Atmospheric and Terrestrial Physics, Vol. 50, No. 1, 1988, pp. 63-72. doi:10.1016/0021-9169(88)90010-4
- N. Jakowski, H. D. Battac, B. Lazo and L. Lois, “Seasonal Variations of the Columnar Electron Content of the Ionosphere Observed at Havana from July 1974 to April 1975,” Journal of Atmospheric and Terrestrial Physics, Vol. 43, No. 1, 1981, pp. 7-11. doi:10.1016/0021-9169(81)90003-9
- N. Balan, G. J. Bailey, N. R. Balachandran and J. E. Titheridge, “Nighttime Enhancements in Ionospheric Electron Content in the Northern and Southern Hemispheres,” Journal of Atmospheric and Terrestrial Physics, Vol. 56, No. 1, 1994, pp. 67-79. doi:10.1016/0021-9169(94)90177-5
- H. Le, L. Liu, X. Yue and W. Wan “The Ionospheric Behavior in Conjugate Hemispheres during the 3 October 2005 Solar Eclipse,” Annales Geophysicae, Vol. 27, No. 1, 2009, pp. 179-184. doi:10.5194/angeo-27-179-2009
- Y. Otsuka, T. Ogawa, A. Saito, T. Tsugawa, S. Fukao and S. Miyazaki, “A new Technique for Mapping of Total Electron Content Using GPS Network in Japan,” Earth Planets and Space, Vol. 54, 2002, pp. 63-70.
- J. A. Klobuchar, “Ionospheric Effects on GPS, in Global Positioning System: Theory and Applications, Volume 1,” B. W. Parkinson and J. J. Spilker Eds., American Institute of Aeronautics and Astronautics INC., Washington, 1996, pp. 485-515.
- A. J. Mannucci, B. D. Wilson and C. D. Edwards, “A New Method for Monitoring the Earth Ionosphere Total Electron Content Using the GPS Global Network,” Proceedings of ION GPS 93, Salt Lake City, 22 September 1993, pp. 1323-1332.
- R. Warnant and E. Pottiaux, “The Increase of the Ionospheric Activity as Measured by GPS,” Earth Planets Space, Vol. 52, 2000, pp. 1055-1060.
- I. Veselovsky, I. Panasyuk and V. Yanke, “Solar and Heliospheric Phenomena in October-November 2003: Causes and Effects,” Cosmic Research, Vol. 42, No. 5, 2004, pp. 453-488.
- L. Baran, I. Ephishov and I. Shagimuratov, “Ionospheric Total Electron Content Behaviour during November 1997 Storm,” Physics and Chemistry of the Earth, Part C: Solar, Terrestrial & Planetary Science, Vol. 26, No. 5, 2001, pp. 341-345. doi:10.1016/S1464-1917(01)00010-1
- A. D. Danilov and J. Lastovicka, “Effects of Geomagnetic Storms on the Ionosphere and Atmosphere,” International Journal of Geomagnetism and Aeronomy, Vol. 2, 2001, pp. 209-224.
- D. Idenden, “The Thermospheric Effects of a Rapid Polar Cap Expansion,” Annales Geophysicae, Vol. 16, No. 10, 1998, pp. 1380-1391. doi:10.1007/s00585-998-1380-3
- P. R. Field, H. Rishbeth, R. J. Moffett, D. W. Idenden, T. J. Fuller-Rowell, G. H. Millward and A. D. Aylward, “Modelling Composition Changes in F-layer Storms,” Journal of Atmospheric and Solar-Terrestrial Physics, Vol. 60, No. 5, 1998, pp. 523-543. doi:10.1016/S1364-6826(97)00074-6