Journal of Geographic Information System
Vol. 4 No. 3 (2012) , Article ID: 19593 , 15 pages DOI:10.4236/jgis.2012.43025
Determination of Optimal Zones for Forest Plantations in the State of Mexico Using Multi-Criteria Spatial Analysis and GIS
1Faculty of Geography, Autonomous University of the State of Mexico, Toluca, Mexico
2Department of Geography, University of Alcala, Alcala de Henares, Spain
Email: {noelpj2000, luisrms}@gmail.com, {joaquin.bosque, montserrat.gomez}@uah.es, roberto_franco_plata@yahoo.com.mx, xanynemiga@rocketmail.com
Received February 29, 2012; revised March 18, 2012; accepted April 1, 2012
Keywords: MCE; GIS; Forest Plantation; State of Mexico
ABSTRACT
This work aims to develop simulation models that allow locating adequate areas for forest plantations in the state of Mexico. It combines multi-criteria evaluation (MCE) techniques and geographic information systems (GIS) to analyze and simulate future scenarios for forest plantations under three major objectives: commercial production, restoration and protection, and agroforestry. Results demonstrate the potential of this method to integrate different variables of social, economic and environmental nature, and for solve some problems of forest activities and management by locating the most suitable areas for this forestal activity.
1. Introduction
The ongoing accelerated processes of deforestation and forest degradation are factors that influence global change through the production of carbon dioxide emissions. It is estimated that by combining strategies of forest preservation with forestation and reforestation projects around the world, forests might work as carbon sinks for the coming years. Recent data indicate that by 2050 the potential of carbon sequestration at worldwide level will be at the order of 100 Gt C ([1] IPCC, 2001). For Mexico, a potential between 4 and 5 Gt C is estimated for 2030, if supportive policies are followed ([2] Masera, 1995).
Therefore, we must develop new procedures that help reverting forest deterioration. It is necessary to preserve forests and find a way, from diverse approaches, to manage them adequately, i.e., forests must be considered multipurpose biological systems. The planning of forest resources involves a complex decision-making problem, since any decision made simultaneously affects the other criteria. Thus, such management must be undertaken considering some aspects related to the sustainability of the system to avoid its deterioration ([3] Romero, 1989). While designing policies for the optimal management of a forest system, it is necessary to have a well-defined structure of environmental, economic and social criteria. Thereby, it is recommendable to formulate models that allow planning the use of forest systems within the framework of multi-criteria decision theory.
To deal with it, multi-criteria evaluation models, focused on decision-making processes, have been developed for long time now; these imply the selection of alternatives that represent different ways of acting, different hypotheses and different locations to determine soil uses. For [4] Eastman et al., (1993), this process involves the evaluation of the selection of alternatives based on concrete criteria. Several authors have proposed the integration of Geographic Information Systems (GIS) with models based on multi-criteria analysis (e.g., [5] Barredo and Bosque Sendra, 1999; [6] Malczewski, 1996; [7] Malczewski, 1999; [8] Bosque Sendra et al., 1999). The GIS-MCE binomial approach offers several advantages as it allows designing models of optimal adequacy for different land uses, by combining different objectives and criteria. Despite the benefits that said integration of GIS and MCE provides, some still think that the success of this combination must be based on the development of the so called Spatial Decision Support Systems (SDSS) and on the incorporation of more powerful tools of modeling and spatial analysis ([9] Jankowski, 1995; [10] Barredo, 1996). [11] Gómez Delgado and Barredo (2005) pointed out as limitations the scarce applicability of MCE methods based on peer comparison within huge data series, the difficult analysis of results by non-MCE-expert users and the incipient development of programs linked to GIS.
Commercial forest plantations supply timber, fiber, firewood and non-timber forest products for industrial and non-industrial use. The benefits forest products provide in comparison to other products that compete with them (concrete, plastic and metal) consist in being renewable, efficient from the energy point of view, and environmentally friendly. Planted forests, when responsibly managed, can also contribute to supplying environmental (soil and water protection, rehabilitation of degraded lands, landscape restoration, habitant development and carbon sequestration), and also social services as well, and also support the subsistence means of the population (regional development, income generation, employment and recreation); these can also alleviate the pressure exercised upon primary forests and other valuable forest ecosystems ([12] FAO, 2006). In Mexico it is fundamental to design and implement normative models that consider the short, mid and long term objectives of forest preservation, given the sustainability goals that prevail on the 2025 Strategic Forestry Plan; which aims to enhance forest production and social welfare. Consequently, several programs to plan and develop forest restoration have been created, but regrettably there is not enough information on the environmental, social and economic requirements of the species that are planted; even more, there is an important deficiency of methodologies to determine the most adequate zones for the correct development of the planted species ([13] Reygadas et al., 1997).
For such reason, this work has as a main objective to develop simulation models, by means of MCE and GIS combined techniques, to identify the most suitable areas for forest plantation under three major objectives: commercial production, restoration and protection, and agroforestry. In order to do so, simulation models were built taking into account data from the Government of the State of Mexico for the coming years, which allowed obtaining current and future location of the most adequate zones for said forest plantations.
2. Study Area
The State of Mexico is located in the central part of Mexico, in a region known as the Mexican plateau. This state is bordered by Mexico City and the States of Queretaro, Hidalgo, Tlaxcala, Puebla, Morelos, Guerrero and Michoacan (Figure 1). Its total surface is 22274.97 km2, which represents 1.1% of the country total surface ([14] GEM, 1993). Its relief, climate and bio-geographic characteristics enabled the development of two major forest ecosystems; coniferous forests, which are often associated to broad-leaved, and coniferous and broad-leaved forests, and the deciduous tropical forest, also known as deciduous low forest; these forests can be found in large zones of the territory.
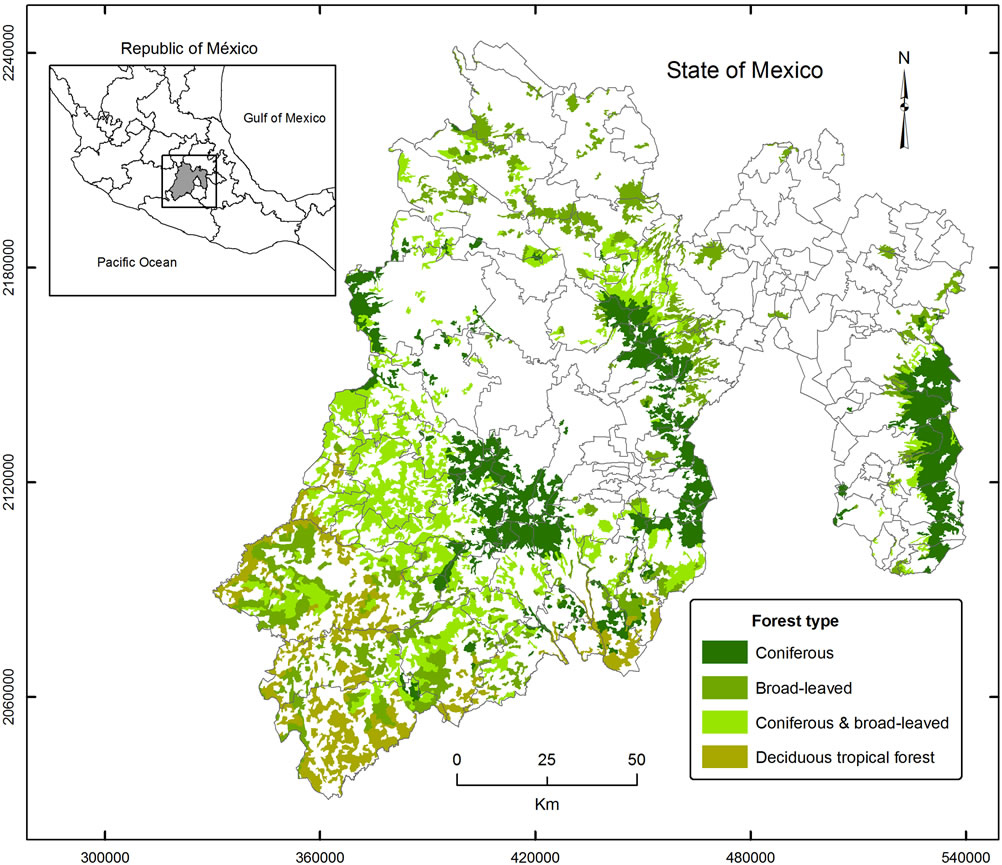
Figure 1. Localization of the State of Mexico.
Forests in this state have shrunk due to the expansion of other land uses, endangering their protective, regulatory and productive functions. Recent data indicates that in a nine-year period (1993-2002), 13,690 ha of temperate forests and 2129 ha of tropical forests were lost, whilst agricultural zones and human settlements increased by 48,789 and 7792 ha each ([15] Pineda et al., 2009).
3. Methodology
Even if decision theory has been applied in diverse knowledge fields, most of its methods came from research performed in fields, such as economy and engineering ([16] García, 2004). Nowadays multi-criteria decision is a field in which the applicability to daily situations and computing tools is very important. However, its integration into GIS has not been fully developed. Therefore, the method used in this work integrates MCE into GIS as a supportive tool to build a spatial model that allows locating the most suitable areas for forest plantations. To do so, the Analytic Hierarchy Process (AHP) by [17] Saaty (1980) was used. It consists in the development of the structure of a multi-criteria problem; a model that contains three levels: goals, criteria and choices (Figure 2); here is necessary to evaluate between different available criteria to find the best alternative to meet an objective it, but those criteria at same time varies in its effectiveness by the choices that were made. Once established, peer comparisons of the elements for each level of the hierarchy are made. Adding the partial results yields a global value for the last level of the hierarchy. This process allows assigning numerical values to individual value judgments; making it possible to measure how each element of the hierarchy contributes to the value of the next level. Having built and evaluated the hierarchies under the aforementioned method, a final evaluation of choices was made using a Weighted Linear Combination (WLC), which is one of the most utilized methods in MCE because of its relatively low complexity for implementation ([11] Gómez Delgado and Barredo, 2005). The suitability level of each choice was obtained using the following equation:

Figure 2. Saaty’s analytical hierarchies method.
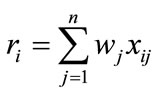 (1)
(1)
where:
ri is the suitability level of alternative i wj is the weight of criterion j xij is the weighed value of alternative i in criterion j The solution for Equation (1) is showed in Figure 3 for one cell (marked by the arrow). In this figure, for criterion A j = a, so wa = 0.65 and xia = 5, and for criterion B j = b, so wb = 0.35 and xib = 4. Finally, n = 2. It has been applied mostly to models developed on GIS raster format ([5] Barredo and Bosque Sendra, 1999); however, it can also be applied to data with a vector format.
To obtain the models of maximum suitability, we followed a methodological process with the elements and processes that are presented in Figure 4 and further detailed below.
The most adequate zones result from the integration of diverse criteria, which were defined for each forest plantation. Said criteria are considered to define factors (that set degrees of suitability) and constraints (that set forbidden areas) for each forest plantation. Three kinds of factors were considered: environmental, economic and social. Such factors were weighted by means of AHM in order to establish relative hierarchies of importance between factors. To carry out this procedure we seek advice from experts from the Autonomous University of the State of Mexico, who with their opinions validated the weights established in the models. Once weighted, we performed an overlapping of layers applying the WLC as decision rule.
Once the suitability maps were obtained, the most suitable areas for each of forest plantation were outlined using the method of Plot Interval Designation (PID) proposed by [18] Franco and Bosque (1997). It was chosen because it has been demonstrated that it offers better control of the suitability values and their distribution, and generates more compact plots, which are closer to the characteristics of the surface needed. This suitability maps were combined applying a Multi-Objective Land Allocation (MOLA) function, assigning the surface to be forested in each plantation. MOLA requires the names of the objectives and their relative weights, the names of the suitability
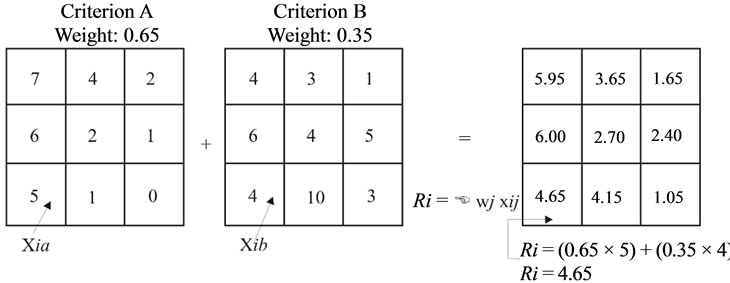
Figure 3. Weighted linear combination source: Modified from [11] Gómez Delgado and Barredo, (2005).

Figure 4. Method to model the suitability of the territory for forest plantations.
maps evaluated for each one and the areas that must be assigned to each one. Later, it repeatedly reclassifies the evaluated suitability maps to carry out a first-step assignnation, verifies if there are conflicts, and then solves those conflicts based on a rule of the minimum distance to the ideal point using the weighted values.
Finally, a tool called BuildScenary, developed in the Department of Geography of the University of Alcala, was used. This tool was designed to assign soil occupations and uses of soil. It automates and speeds the process, applying the WLC as a technique to aggregate the factors and produce the suitability maps, as well as the generation of suitability maps by plots. The process is iterative, in the case that output maps select plots that do not fulfill the goals of surface by objective. If it is the case it reclassifies the maps with lower values ([19] Rodríguez et al., 2009).
3.1. Reference Data
The selection of the variables was based on specialized information on this topic that was obtained from a bibliographic review and expert advice from professors of the Autonomous University of the State of Mexico. Besides, most studies of environmental modeling in a GIS platform usually consider variables such as slope, geology, soils and climate. The availability of high quality information for the area of study was crucial to consolidate the database. Although it is not a condition of the method, all the variables were transformed into a raster format to facilitate the spatial analysis. The adequate species for each type of forest plantation were selected considering Table 1, based on official publications issued by the government of the State of Mexico; whereas the environmental requirements for each of the selected species are defined by CONAFOR (Table 1).
Using this, the optimal and tolerance values for each forest plantation, depending on the environmental requirements of each species were defined. Such values were reviewed and redefined by forest experts at CONAFOR (Table 2).
Based on this, we implemented models of optimal suitability for the three forest plantation goals: 1) commercial; 2) restoration and protection; and, 3) agroforestry. In the first place, the models looked for desirable areas to plant during 1993-2000. Secondly, models of optimal assignation for plantations for 2025 were produced taking as a reference the year 2000. This was according to the reforestation goals established in the 2005-2025 Program of Sustainable Forest Development of the State of Mexico.
3.2. Development of Simulation Models
The environmental, economic and social criteria that were considered to run the models had to contain different types of values that can be factors and constraints at the same time. Constraints were converted into maps with two possible values, 1 corresponds to one prospective place to develop the activity, and 0 indicates zones excluded from the analysis (forbidden areas). With the objective of avoiding the implementation of forest plantations on roads, railways, the hydrographic network, i.e., rivers, water bodies, channels, underground and superficial aqueducts and some conflicting soil occupation types. Such constraints on their own considerably reduced the available area, remaining only 163.927 ha to locate adequate
zones for agro-forest plantations, 696,679 ha for restoration and protection, and 1,109,024 ha for commercial plantations.
Since data has different units and values, factors to be evaluated must be standardized in order to run the model. Table 3 shows the factors that were used for the models and how each one of them was standardized considering its qualitative or quantitative nature.
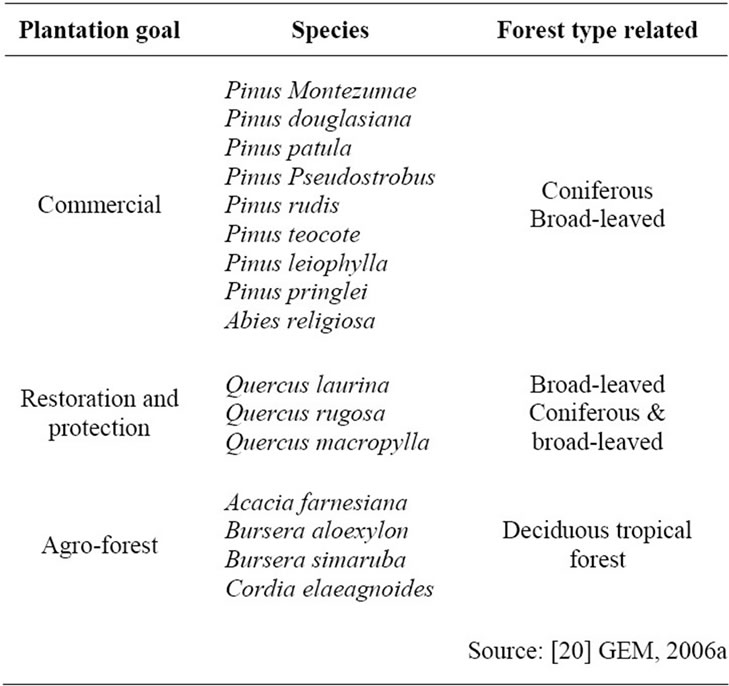
Table 1. Forest species recommended by plantation goal and forest type.
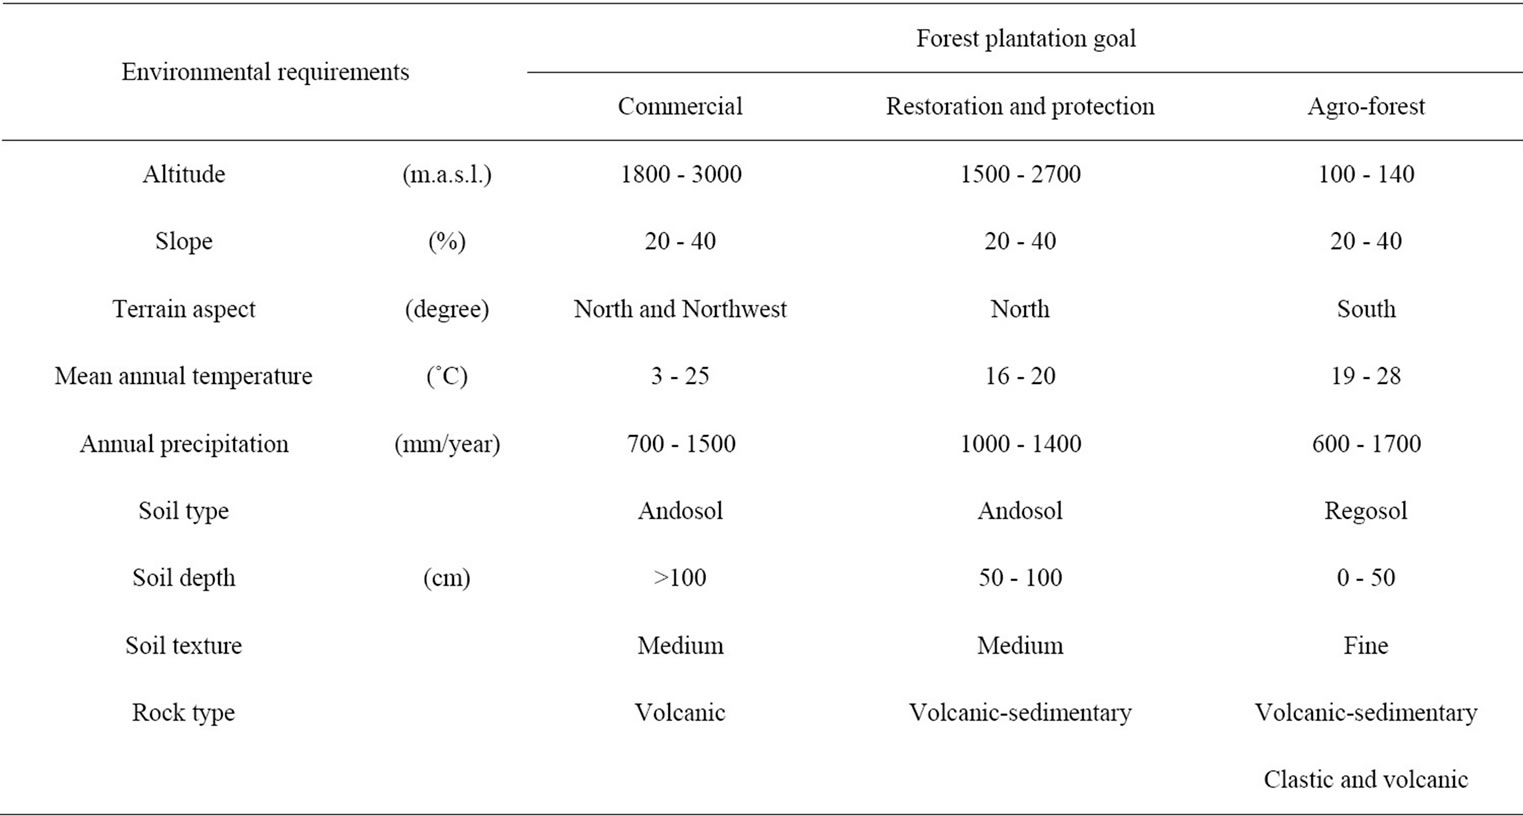
Table 2. Range of optimal values for forest plantations.
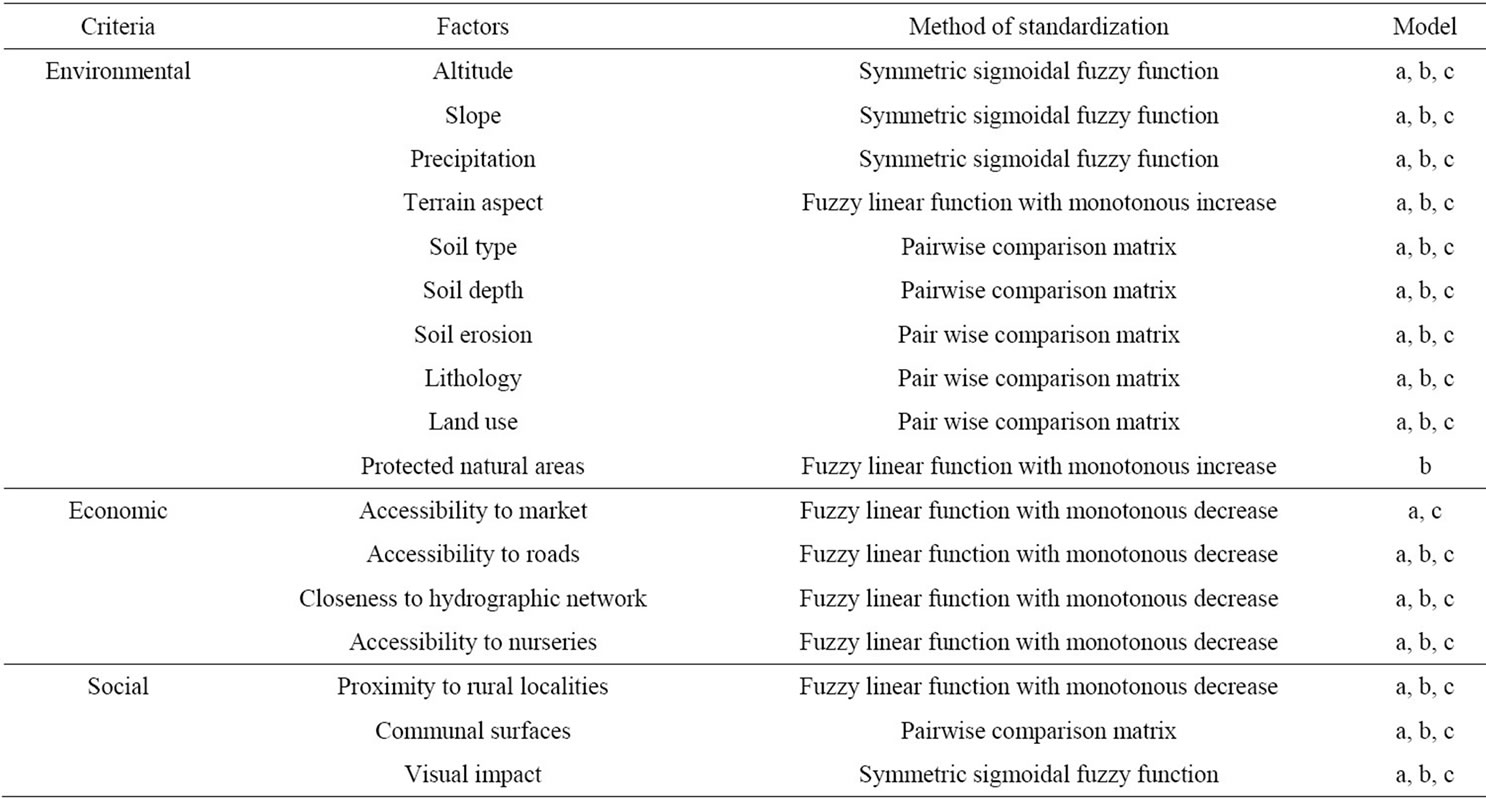
Table 3. Criteria and factors used in the normative models.
Finally, we weighted the criteria and factors using the AHP method proposed by Saaty; firstly, the hierarchy, and the environmental, economic and social criteria were weighed (Table 4). In the case of restoration and protecttion plantations the environmental aspects are those with the most importance, followed by social and economic factors. In the case of commercial plantations, the most important criteria are the economic, so maximizing the economic benefit was sought without disregarding the environmental and social criteria of this activity. In agro-forest plantations the three criteria were balanced. Finally in Table 5 the final weights for each of the factors of the second category are shown.
3.3. Prospective Simulation of Forest Plantations for 2025
As in many cases, the models are only approximations to the optimal zones that the three types of forest plantations should have in the future. The surfaces to be planted have already been defined by the Government of the State of Mexico in its 2005-2025 Program of Sustainable Forest Development (PDFS). This program is based on the principles of sustainable development, and has as an objective the restoration, protection and rational use of forest areas in the State. It also supplies necessary information to help decision-making in the short, mid and long term. The future location of these areas cannot be checked; however, the graphic and numerical overlapping of the maps obtained in the modeling can indeed supply some impressions on the obtained results.
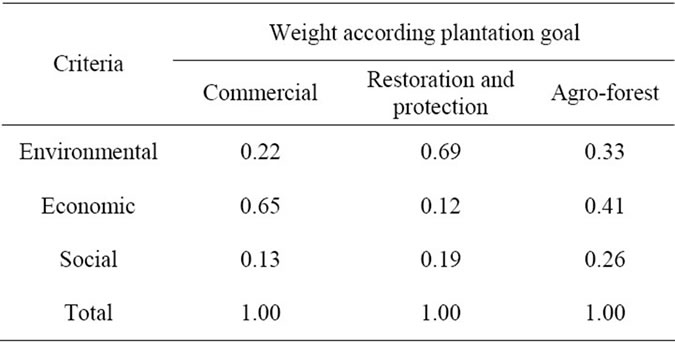
Table 4. Weight of the criteria regarding plantation goal.
In the first place we developed a “single model” considering current land use in 2000, besides with this information plus the surfaces marked to be planted, as well as the aforementioned environmental, economic and social factors, the optimal assignation was calculated for 2025. Additionally intermediate models were developed for the years 2006, 2011, 2016, 2021 and 2025. These models were executed under two perspectives: first, assuming that there is no conflict for territory between the goals; and second, applying multi-objective assignation to solve conflicts for territory between goals.
To develop a solid model for 2025, the constraints and factors, such as protected natural areas, accessibility to main roads, accessibility to plant nurseries, accessibility to markets, proximity to rural localities and visual impact were updated with information for the year 2000. Besides, areas that were selected as suitable in a previous analysis operated as constraints in the following.
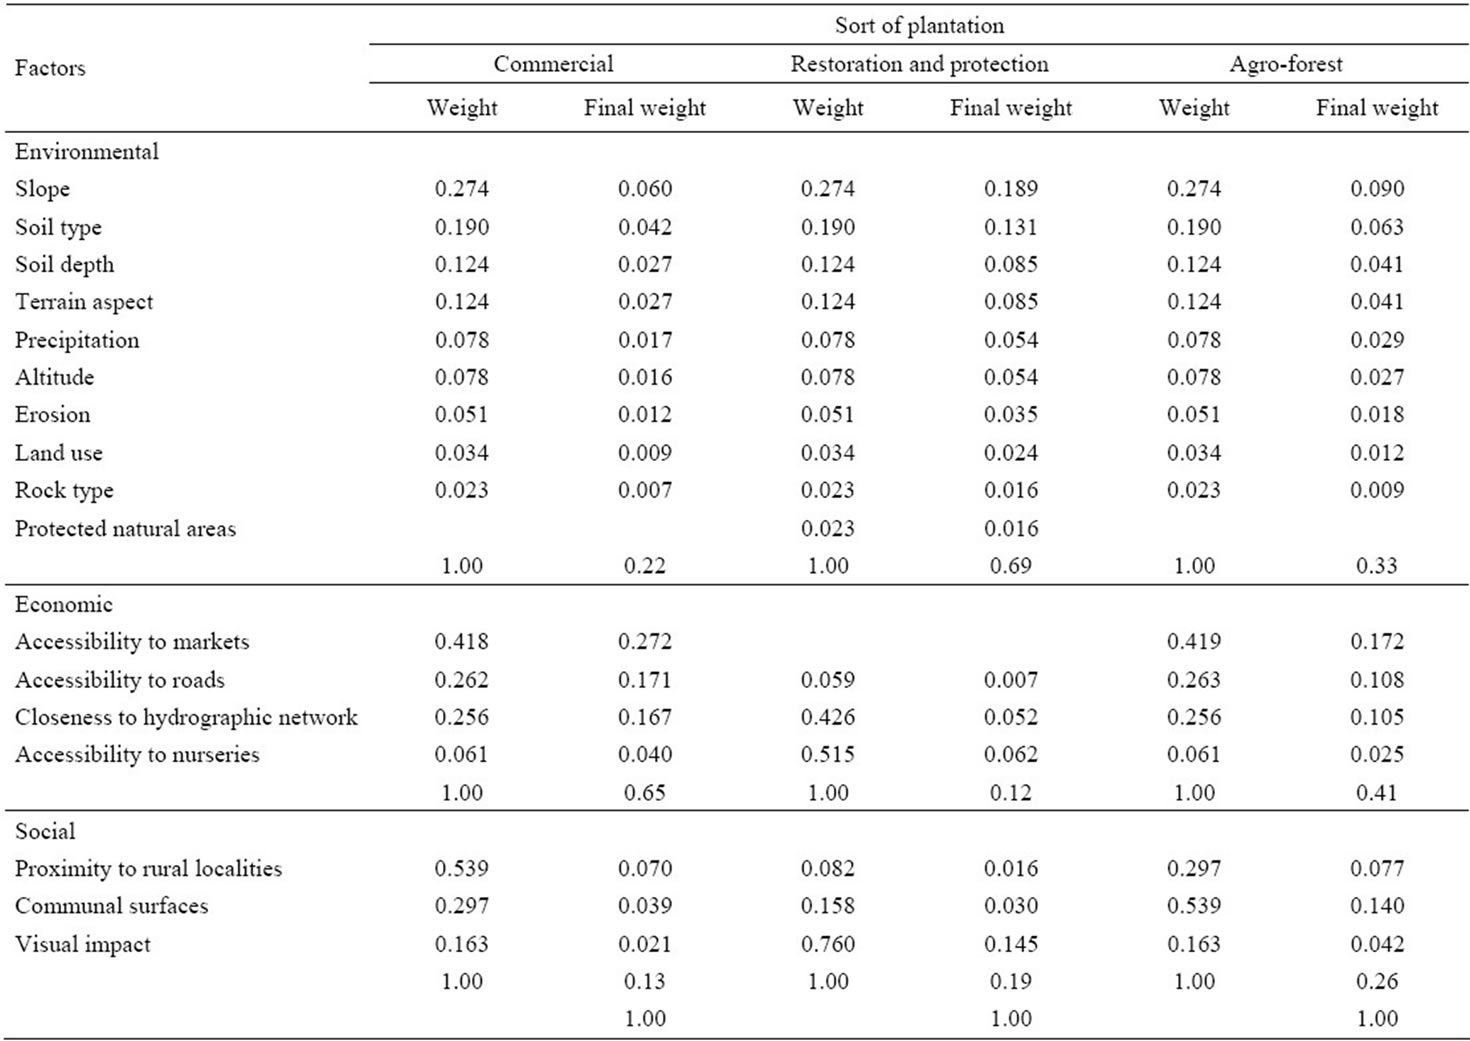
Table 5. Final weights of the second hierarchy.
The surface goals utilized in the intermediate models were taken from 2005-2025 PDFS. This plan describes the activities to be performed from 2006 to 2025, the targeted areas to be planted and the type of forest plantation type under the program of forest restoration and promotion (Table 6).
4. Results
4.1. Optimal Suitability Maps for Each Forest Plantation Goal (1993-2000)
Results obtained from the suitability map for commercial plantations yields the following hectares available for each suitability level: very high, 38.728 ha; high, 525.059 ha; mid, 485.773 ha; low, 42.784 ha; and very low 1.093 ha. Areas with a very high suitability are located in the municipalities of Toluca, Tenango del Valle, Zinacantepec, Lerma, Amanalco, Tianguistenco, Huixquilucán, Tenancingo, Ocoyoacán and Xalatlaco. Areas with high suitability for these plantations are mainly located in the municipalities of San Felipe del Progreso, Villa Victoria, Almoloya de Juárez, Temascalapa, Villa de Allende, Jiquipilco and Toluca (Figure 5).
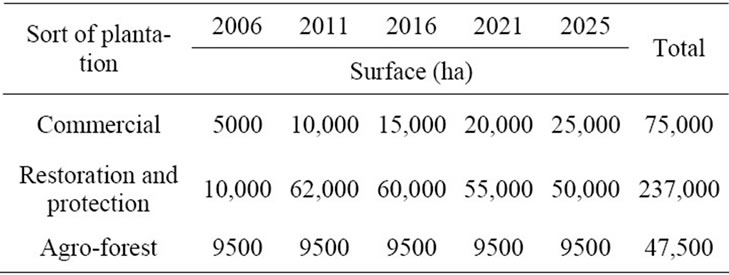
Table 6. Target areas to be planted in short, mid and long term as used for the models (Source: [21] GEM, (2006b)).
The suitability map for plantations for restoration and protection yields the following hectares available for each suitability level: very high, 20,885 ha; high, 82,185 ha; mid, 169,468 ha; low, 200,701 ha; and very low, 221,607 ha. The areas with a very high suitability are located in the municipalities of Ocuilan, Jiquipilco, Temoaya, Jilotzingo, Coatepec Harinas and Tenancingo; whereas the zones with high suitability are in the municipalities of Valle de Bravo, Tamascaltepec, Aculco and Almoloya de Alquisiras (Figure 6).
The suitability map for agroforestry plantations yields the following hectares available for each suitability level: very high, 34,257 ha; high, 4712 ha; mid, 12,478 ha; low,
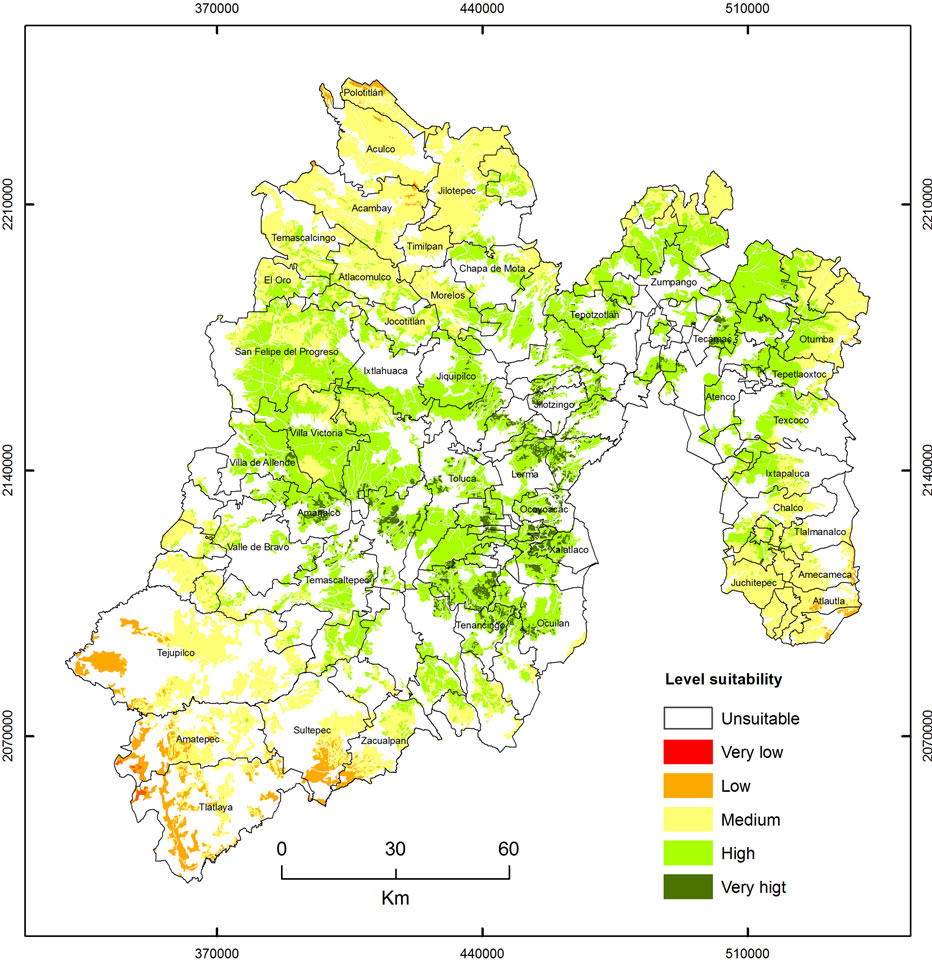
Figure 5. Map of suitability levels for commercial plantations (1993-2000).
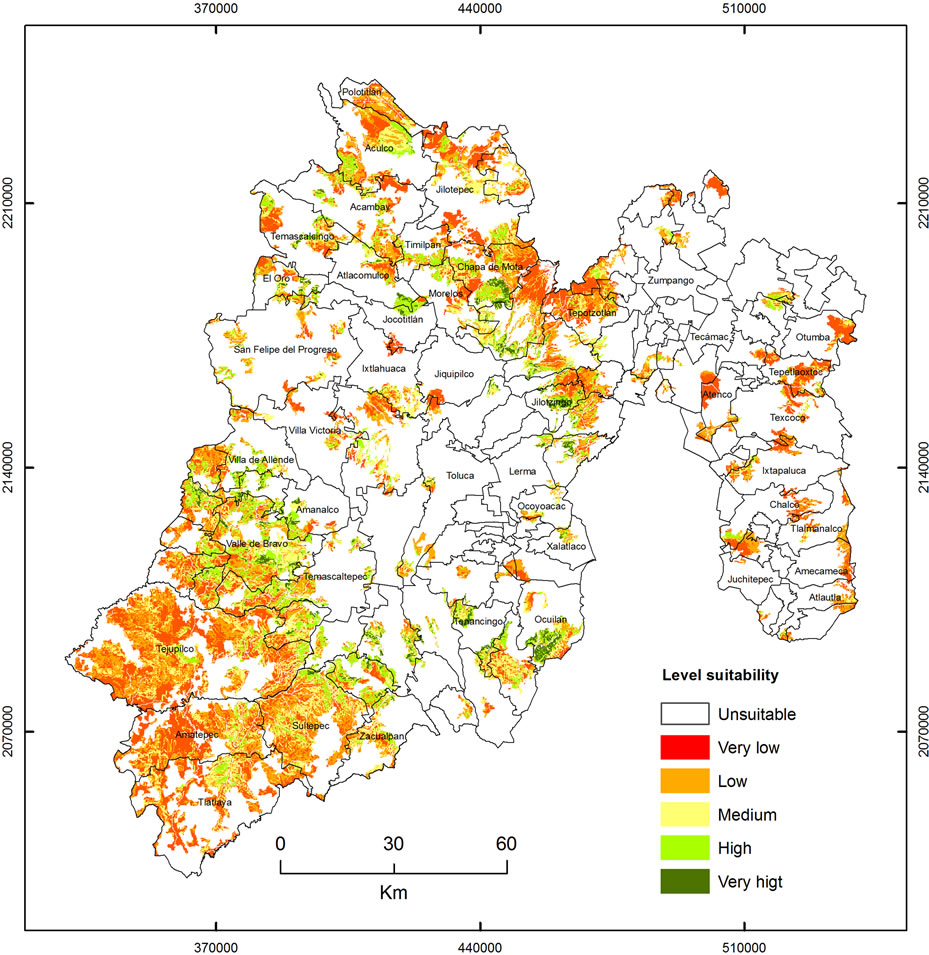
Figure 6. Map of suitability levels for restoration and protection plantations (1993-2000).
42,492 ha; and very low, 68,151 ha. The zones with very high suitability for agro-forest plantations are mainly in the municipalities of Tlatlaya, Sultepec, Amatepec and Otzoloapan. The surfaces with high suitability are located in the municipalities of Amatepec, Sultepec and Tonatico. The areas with mid suitability level are mainly located in Tejupilco, Ixtapan de la Sal, Amatepec and Zacualpan (Figure 7).
4.2. Suitability for 2025
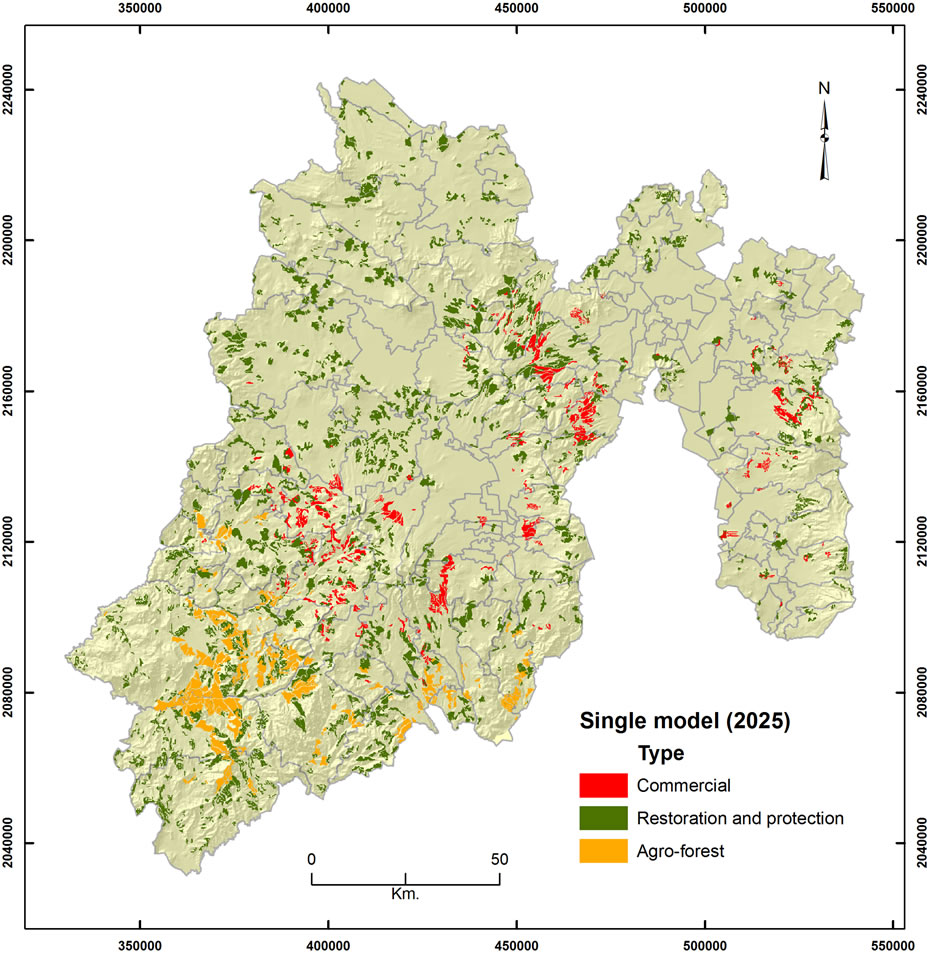
The spatial modeling of the single model (2000-2025) shows a more fragmented distribution with diverse areas in conflict, which are slightly more than 40000 ha in the state. For example, in the north there are commercial plantations that are in conflict for territory with the restoration and protection plantations, while in the south the latter compete with agro-forest plantations (Figure 8). This can be troublesome when seeking to clearly distinguish the optimal zones for each objective.
In order to solve the conflicts between areas we applied a multi-objective procedure in which it is assumed that the objectives are equally important; hence, the three types of forest plantation and surface goals are given similar weights to those in the previous procedure. In this case the spatial modeling reveals a more compact and homogeneous distribution, as it is seen in the plots of agro-forest plantations in the southern part of the State (Figure 9). Using this procedure, the targeted surface goals are accomplished.
Nonetheless, obtaining the optimal areas for the long term by means of a single model causes the overlooking of the most adequate areas in the intermediate periods; in order to resolve this problem we proposed individual models every five years after 2006 and following the established goals of surface to be reforested, which makes forest planning more reasonable, and it was additionally used for somehow validating the single model previously performed.
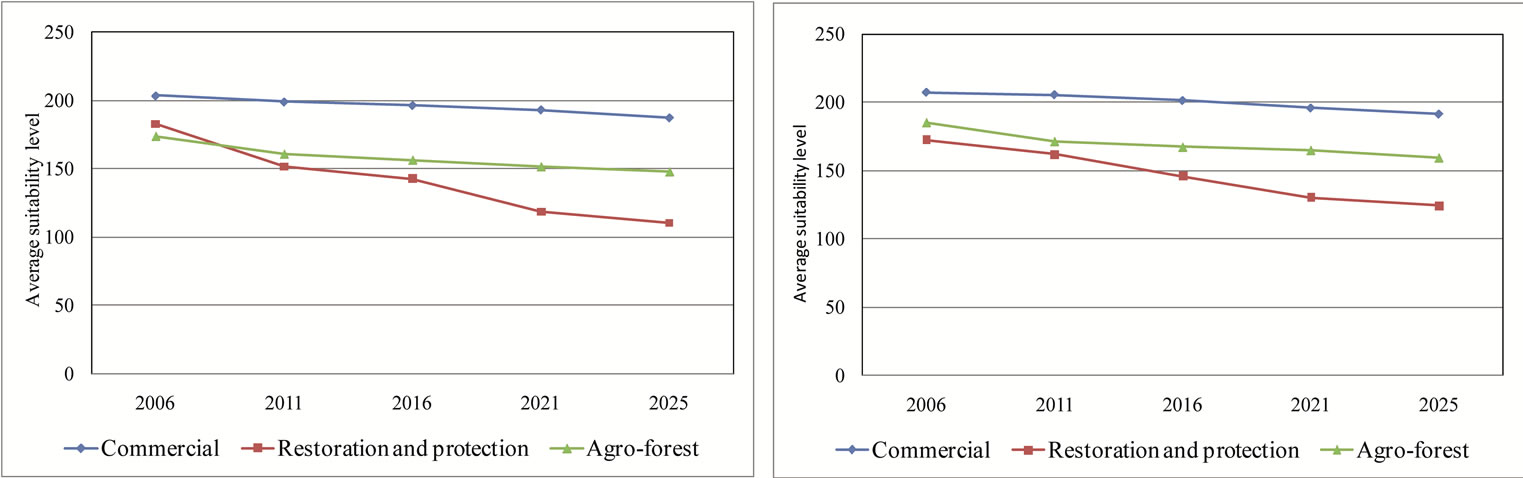
We also carried out an optimal assignation applying MOLA module and other assignation without this algorithm, similarly to the single model. The results show that the values of mean suitability of the plots are very similar in both models, however the one with MOLA tends to slightly improve the suitability level, mainly in restoring and protection and agro-forest plantations (Figure 10).
Considering such variations on suitability and to solve the conflicts of territory between plantations, we applied the MOLA tool to model the processes of forest reforestation undertaken every five years; the results are shown
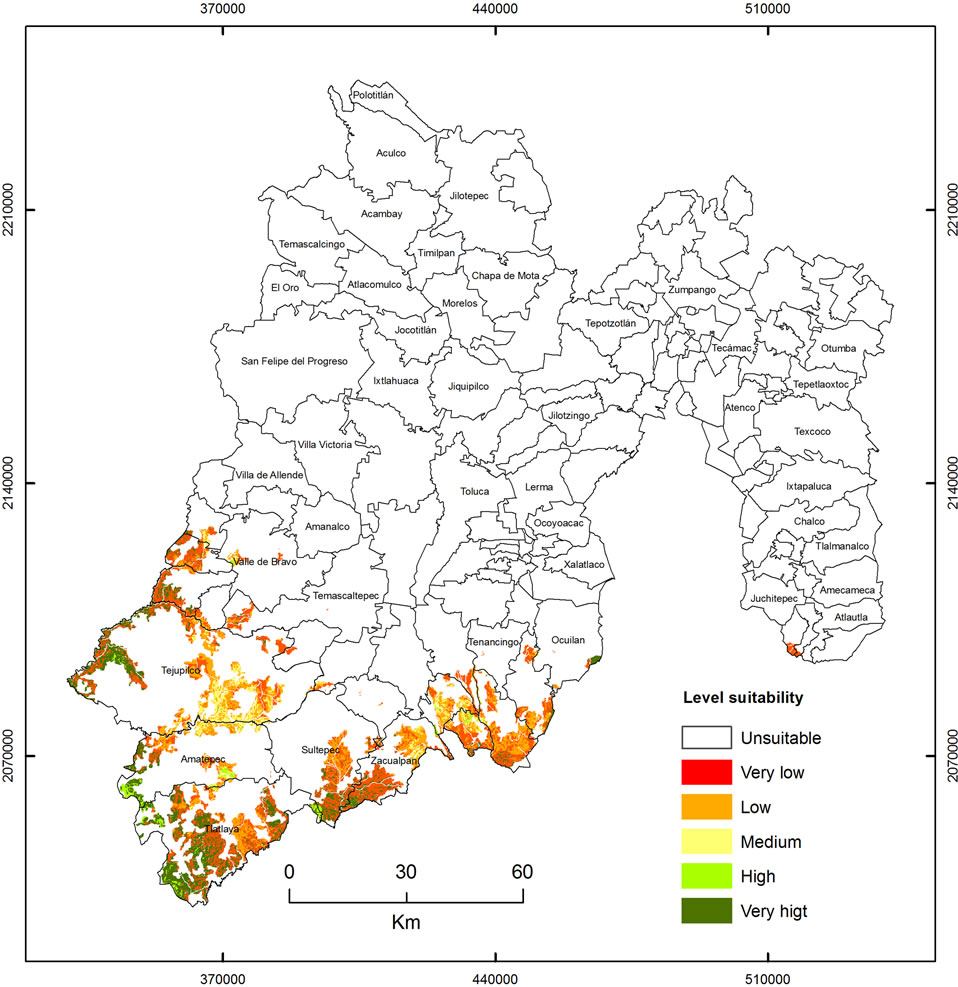
Figure 7. Map of suitability levels for agro-forest plantations (1993-2000).
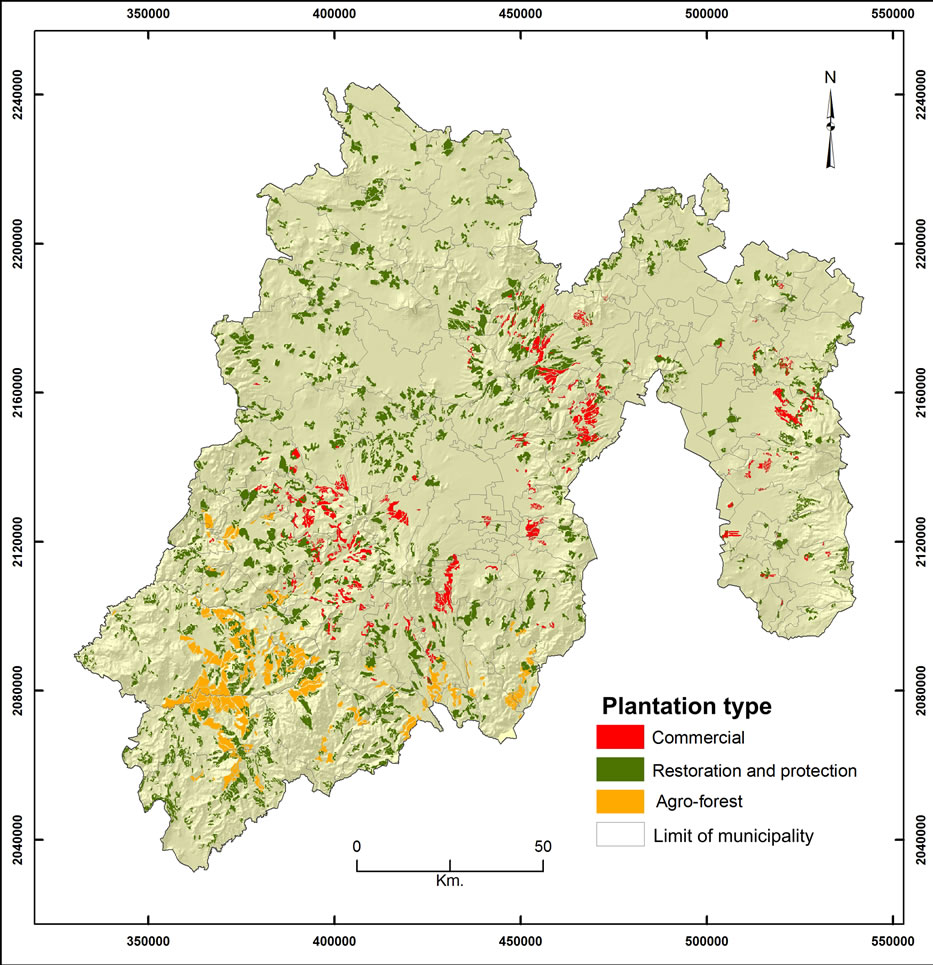
Figure 8. Single model applying multi-objective assignation.

Figure 9. Single model without applying multi-objective assignation.
 (a) (b)
Figure 10. Suitability levels of the single model (a) With multi-objective assignation; and (b) Without multi-objective assignation.
in Figure 11. The spatial distribution of the three plantation types is homogenous almost all years showing scarcely disperse spatial patterns and there are no conflicts between the objectives.
A visual analysis of the previous maps shows interesting aspects of the simulated models. For instance, in 2006 most of the commercial plantations are located in mountainsides, however by 2016 some of the zones with better aptitude are located at the edges of valleys, and by 2021 and 2025 these areas “invade” part of the valley of Toluca (Figures 12(a) and 12(b)); it is likely that this distribution is related to the accessibility to roads and proximity to markets.
On the other side, plantations of restoration and protection are those with more dispersed spatial patterns. Perhaps this is due to the fact that they have the smallest minimal surface of the three goals, moreover this sort of plantations are the ones with the largest surface goals in each of the modeled years (Figure 12(c)). In the case of agro-forest plantations, the plots tend to be more homogeneous than other models and located near roads and waterways (Figure 12(d)).
The results of the comparison between the single model (Figure 13(a)) and the individual one (Figure 13(b)) reveal that the percentage of pixels that coincide in both maps is 77.71%, whilst the percentage of noncoinciding pixels is 22.29%. This somehow worked as a validation for the model, and despite that carrying out a modeling in a single step from 2000 to 2025 is technically possible, simulation by shorter periods is useful to perform a more realistic forest planning, covering the goals established in 205-2025 PDFS.
5. Conclusions
The obtained results show how these studies can contribute to decision making processes, since the generated information can be useful for planners to analyze and optimally manage the forest ecosystems of the region; likewise, the results provide information on the current state of the forest coverage and the future reforestation scenarios that might work. The methods utilized here helped us to generate valuable information to solve problems of assignation of activities and forest management. In this sense, it may be said that WLC and AHP are some of the most used MCE methods nowadays. Some authors, nevertheless, report that the subjectivity employed to assign the weights of preferences is a flaw of this procedure ([22] Hahn, 2003; [23] Hahn, 2006; [24] Prakash, 2003; [25] Barzilai, 2007). In this respect [26] Lamelas Gracia, (2009) thinks there are no fully objective procedures; but from the point of view of this author the use of quantitative methods imply lessening the subjectivity degree.
Notwithstanding, MCE was fundamental to develop the models, as it contributed to systematize complex processes, which will allow assigning functions with few difficulties. MCE methodology supplied sufficient reliability in obtaining information, because by means of the use of software and computing packages the process was optimized; besides, with their use integrated to GIS it is possible to handle a large amount of geographic information. Separately, the implementation of the method of Plot Interval Designation (PID) and multi-objective assignation incorporated into BuildSceneries was very useful in the assignation of optimal areas for the three sorts of forest plantations.
The complexity of evaluating situations where there are multiple objectives and multiple criteria, as in this case, allows stating that exercise might be helpful to respond to the triangle of sustainability. Through this type of methods legal, social, environmental and economic variables can be integrated, keeping us from falling into arbitrary stances with no scientific grounds. Albeit, given the amplitude and variability of the territory we consid-
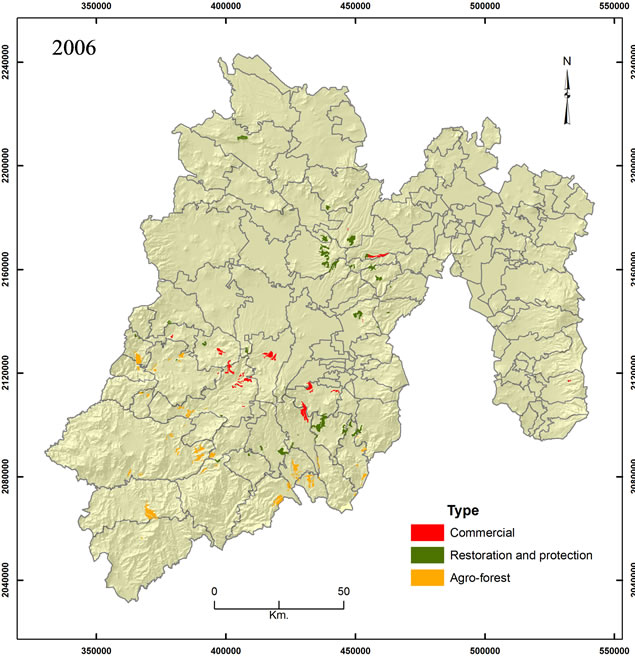
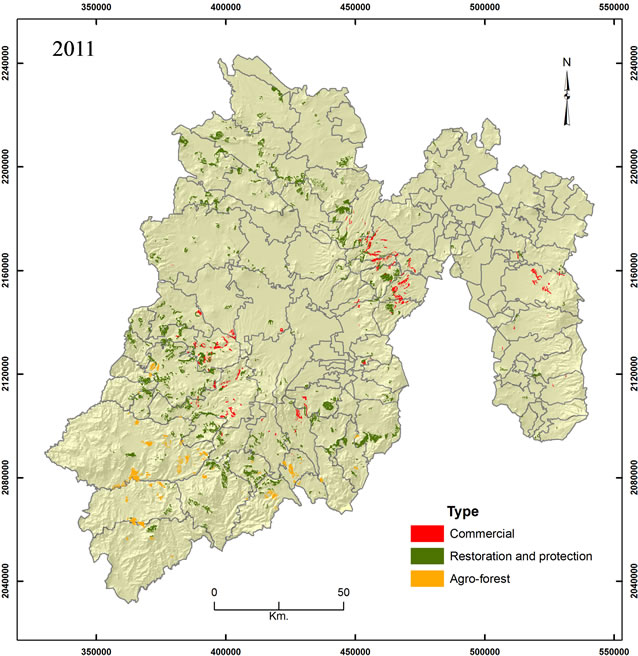
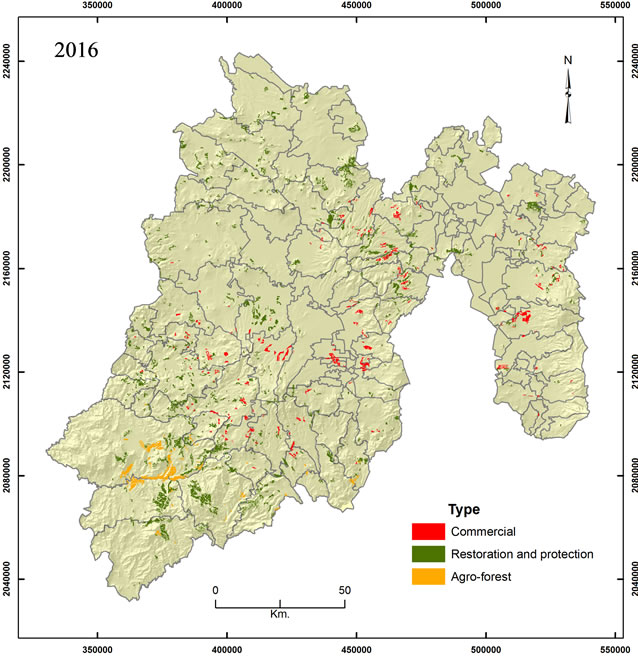

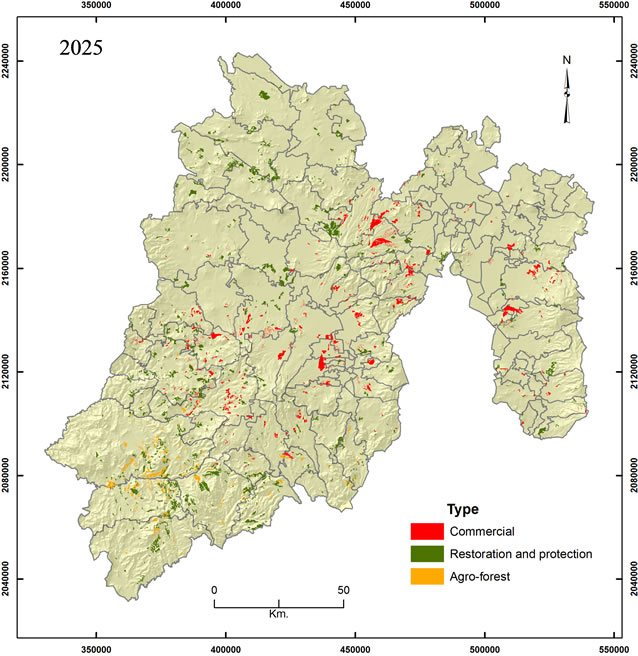
Figure 11. Suitable areas for forest plantations in 2006, 2011, 2016, 2021 and 2025.
 (a)
(a)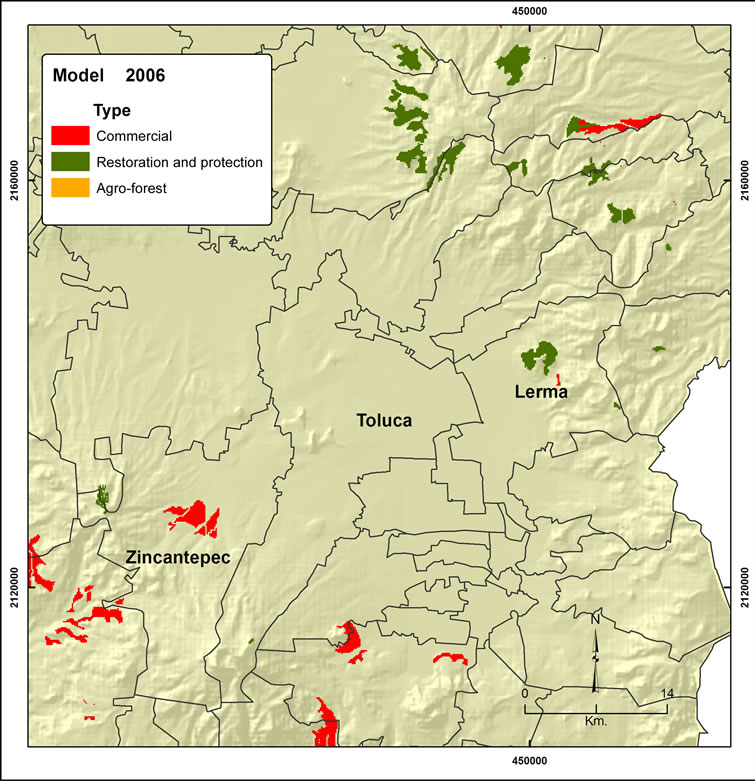 (b)
(b)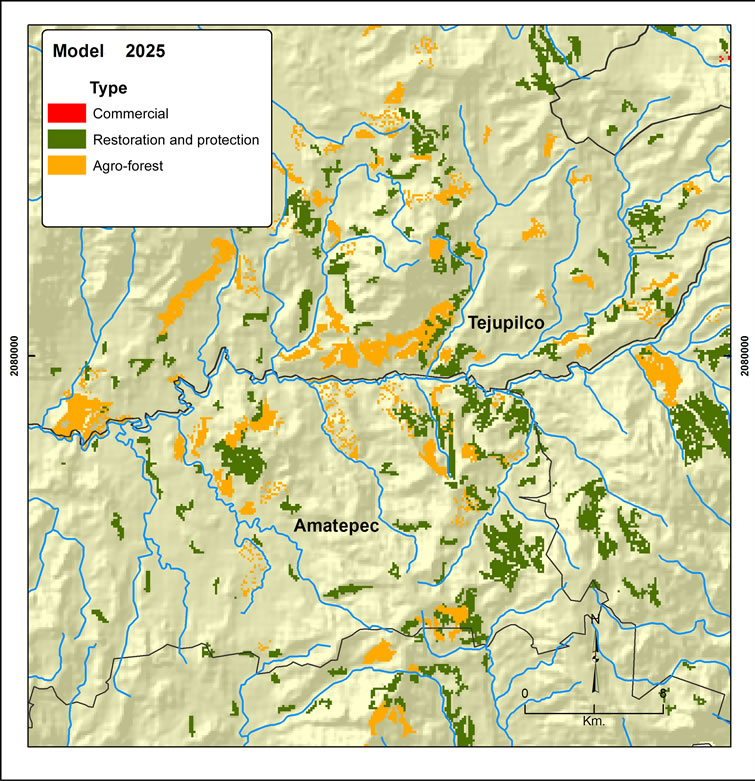 (c)
(c)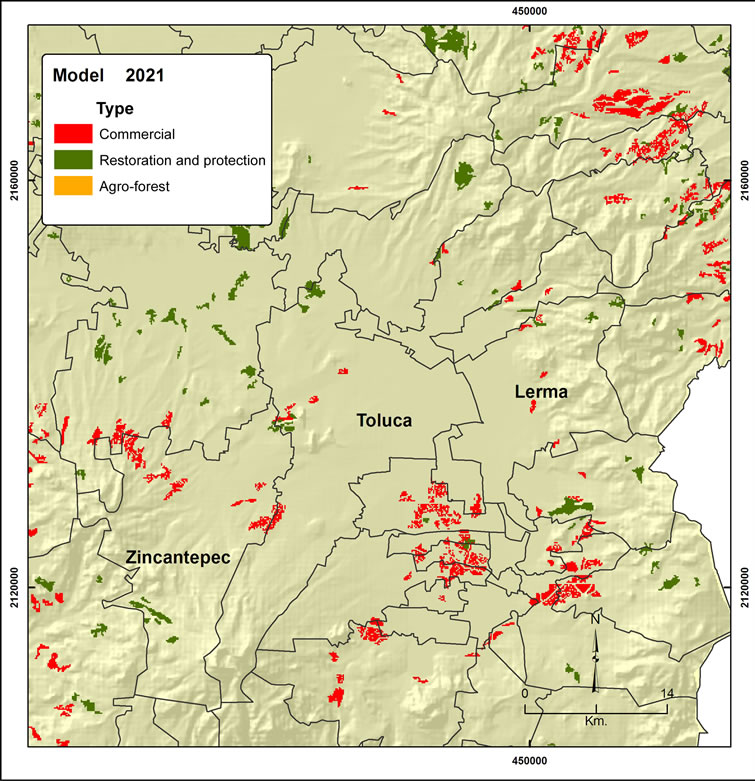 (d)
(d)
Figure 12. Details of simulations for the years 2006, 2016, 2021 and 2025.
ered that the results must be evaluated with complementtary studies and infield verification by the experts of the Government of the State linked to forest plantation programs.
As the tendencies in forest activity in Mexico show an uncertain future, both for the productive apparatus dependent on this activity and the sustainability of the forests in the country, it is important to undertake simulation works in which several scenarios of forest activity are considered, such as those of natural tendency, sustainable forest management and intensive logging management.
Finally, it is important to distinguish that the stated methodology might be extrapolated to other States and scenarios, including new variables that enrich the obtained results. However, it is vital that those in charge of making
 (a)
(a)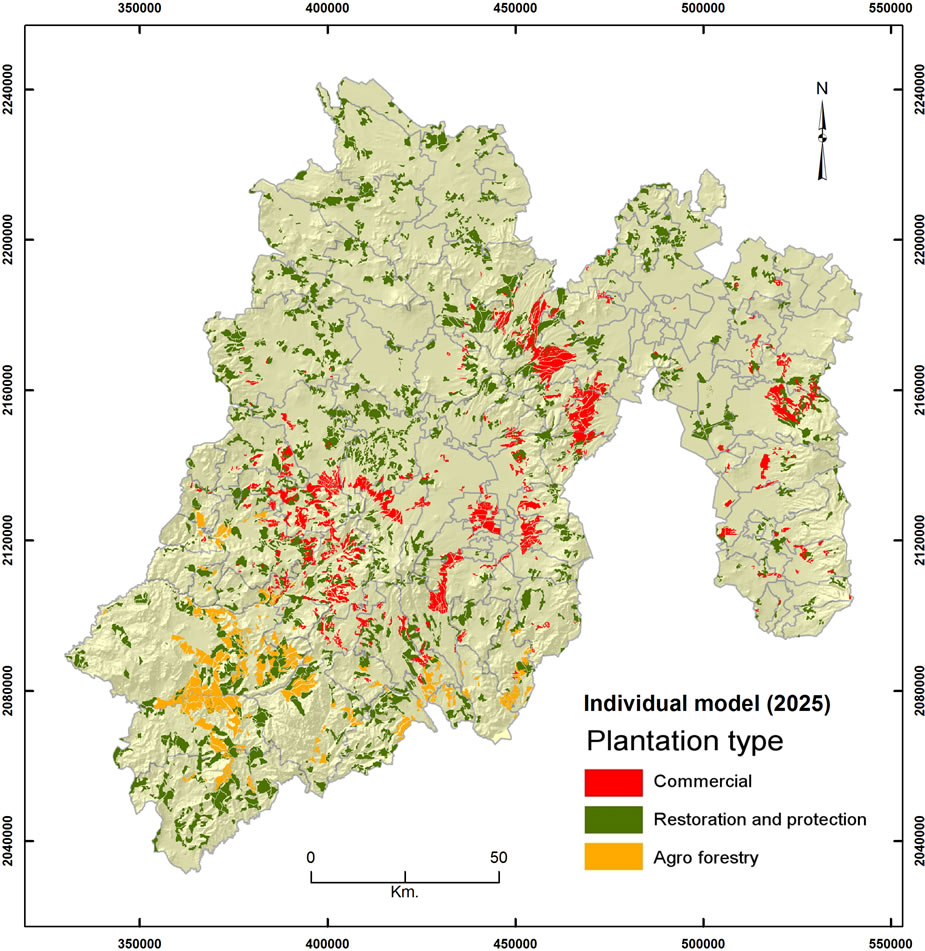 (b)
(b)
Figure 13. Comparison between the single model adding individual models.
territorial decisions become aware of and knowledgeable about the integrated use of GIS and MCE as a technical-scientific base of great value for studies on territorial management and planning.
REFERENCES
- IPCC, “Climate Change 2001: Synthesis Report,” Intergovermental Panel on Climate Change, Cambridge University Press, Cambridge, 2001.
- O. R. Masera, “Carbon Mitigation Scenarios for Mexican Forests: Methodological Considerations and Results,” Interciencia, Vol. 20, No. 6, 1995, pp. 388-395.
- C. Romero, “Modelos de Planificación Forestal: Una Aproximación desde el Análisis Multicriterio,” Revista de estudios Agro-Sociales, No. 147, 1989, pp. 71-92.
- J. R. Eastman, P. A. Kyem, J. Toledano and W. Jin, “GIS and Decision Making, United Nations Institute for Training and Research (UNITAR),” Geneva, Switzerland, 1993.
- C. J. Barredo and J. Bosque Sendra, “Multicriteria Evaluation Methods for Ordinal Data in a GIS Environment,” Geographical Systems, No. 5, 1999, pp. 313-332.
- J. Malczewski, “A GIS-Based Approach to Multiple Criteria Group Decision Making,” International Journal of Geographical Information System, Vol. 10, No. 8, 1996, pp. 955-971.
- J. Malczewski, “GIS and Multicriteria Decision Analysis,” New York, John Wiley & Sons, Inc., 1999.
- J. Bosque Sendra, D. M. Gómez, E. V. Rodríguez, M. M. Díaz, D. A. Rodríguez and G. A. Vela, “Localización de Centros de Tratamientos de Residuos: Una Propuesta Metodológica Basada en SIG,” Anales de Geografía de la Universidad Complutense, Vol. 19, 1999, pp. 295-323.
- P. Jankowski, “Integrating Geographical Information Systems and Multiple Criteria Decision-Making Methods,” International Journal of Geographical Information Science, Vol. 11, No. 6, 1995, pp. 577-602. doi:10.1080/136588197242202
- C. J. Barredo, “Sistemas de Información Geográfica y Evaluación Multicriterio en la Ordenación de Territorio,” Madrid, Ra-Ma, 1996.
- M. Gómez Delgado and J. Barredo, “Sistemas de Información Geografía y Evaluación Multicriterio Aplicados al Ordenamiento del Territorio,” Ra-Ma, Madrid, 2005, 276 p.
- FAO, “Ordenación Responsable de los Bosques Plantados: Directrices Voluntarias,” Documento de Trabajo Sobre los Bosques y Árboles Plantados No. 37/S, Rome, 2006.
- D. Reygadas, J. Rodriguez and C. López, “La Reforestación Rural en México,” Biodiversitas, Boletín bimestral de la Conabio, Year 3, No. 11, 1997, pp. 8-10.
- GEM, “Atlas General del Estado de México,” Secretaría de Finanzas y Planeación, Instituto de Información e Investigación Geográfica, Estadística y Catastral Toluca, Mexico, 1993.
- N. Pineda, J. Bosque Sendra, M. Gómez Delgado and W. Plata, “Análisis de Cambio del uso del Suelo en el Estado de México Mediante Sistemas de Información Geográfica y Técnicas de Regresión Multivariantes,” Una Aproximación a los Procesos de Deforestación Investigaciones Geográficas, Boletín del Instituto de Geografía, UNAM, No. 69, 2009, pp. 33-52.
- L. L. García, “Aplicación de Análisis Multicriterio en la Evaluación de Impactos Ambientales,” Doctorate Thesis, Universidad Politécnica de Cataluña, Barcelona, 2004.
- T. Saaty, “The Analytic Hierarchy Process Planning, Priority Setting, Resource Allocation,” McGrawHill, 1980, 287 p.
- M. S. Franco and J. Bosque Sendra, “Procedimiento Para la Obtención de Parcelas de Adecuación en Imágenes Raster,” I Reunión de Usuarios Españoles de Idrisi, Alcalá de Henares Spain, 1997, Accessed on 25 May 2010. http://www.sigte.udg.es/idrisi/recursos/secundari/reunion1/inidice.htm
- A. Y. Rodríguez, R. W. Plata, M. J. Salado García, M. Gómez Delgado and J. Bosque Sendra, “Herramienta Para la Asignación Óptima de Usos del Suelo,” II Congreso Internacional de Medida y Modelización de la Sostenibilidad, Terrassa, Spain, 2009.
- GEM, “Manual de reforestación. Protectora de Bosques del Estado de México (ProBOSQUE),” 2006, Accessed on 25 May 2010. http://www.edomex.gob.mx/portal/page/portal/probosque
- GEM “Programa de Desarrollo Forestal Sustentable del Estado de México 2005-2025,” 2006, Accessed on 25 May 2010. http://www.edomex.gob.mx/portal/page/portal/probosque
- E. D. Hahn, “Decision Making with Uncertain Judgments: A Stochastic Formulation of the Analytic Hierarchy Process,” Decision Sciences, Vol. 34, No. 3, 2003, pp. 443- 466. doi:10.1111/j.1540-5414.2003.02274.x
- E. D. Hahn, “Link Function Selection in Stochastic Multicriteria Decision Making Models,” European Journal of Operational Research, Vol. 172, No. 1, 2006, pp. 86-100. doi:10.1016/j.ejor.2004.09.041
- T. N. Prakash, “Land Adequacy Analysis for Agricultural Crops: A Fuzzy Multicriteria Decision Making Approach,” Thesis for the Degree of Master of Science in Geoinformatics, International Institute for Geoinformation Science and Earth Observation Enschede, the Netherlands, 2003.
- J. Barzilai, “MCDA2 Evaluation, Preference, and Decisions,” Annual Conference of the Canadian Operational Research Society, Final Program, Ontario, Canada, 2007, 31 p.
- M. T. Lamelas Gracia, “Esquema Metodológico Para la Toma de Decisiones Sobre el uso Sostenible del Suelo: Aplicación a la Localización de Suelo Industrial,” GeoFocus (Articles), No. 9, 2009, pp. 28-66.