Journal of Geographic Information System
Vol.4 No.2(2012), Article ID:18755,10 pages DOI:10.4236/jgis.2012.42012
Morphometric, Hydrogeologic and Hydrochemical Analyses of Solar Saltwork Pond Region, in Meha Area, Northwest Sharqat City, Iraq
1Natural Resources Research Center, University of Tikrit, Tikrit, Iraq
2Department of Applied Geology, College of Science, University of Tikrit, Tikrit, Iraq
3Research Center for Dams & Water Resources, Mosul University, Mosul, Iraq
Email: alialjubory@yahoo.com, aligeo2010@yahoo.co.uk
Received October 19, 2011; revised December 10, 2011; accepted January 6, 2012
Keywords: Morphometry; Hydrogeology; Hydrogeochemistry; Salt Pond; Iraq
ABSTRACT
The study determines the shape, area, and discharge properties and other factors of morphometric analysis and drainage pattern to characterize the optimum location for salt harvesting in the salt ponds in Meha area, northwest Sharqat city, Iraq. The morphometric analysis confirms the idea of the upward leakage of salt rich water from the deep ground water along the surface of deep fault. The hydrogeological data of groundwater leakage encourage the method of harvesting salt by evaporation ponds. Also, the relationship between hydrochemical parameters, their variation with the period of evaporation, increasing of Na+ and Cl– percentages, and decreasing of other component support the salt production in the area.
1. Introduction
Sodium chloride (Halite) is a cheaply produced commodity extracted either from mines or saltpans. There are about 14,000 reported usages of halite [1]. Salt’s main uses are as a preservation and as a much required for additive to flavor the foodstuffs [2].
The salt bearing formations in Iraq can be roughly grouped under bedded salt deposits from the early and middle Miocene (Dhiban and Fath’a formations) and piercing salt bodies in the southern parts of Iraq during the upper Jurassic.
Several salt ponds are found in Sharqat area, south of Mosul City within Salahaddin province. These ponds are distributed in area of about 4 km long and 1 km width. Salt is produced in good quantities, but with primitive manners that reduce the quality of the produced salts. The location of the study area is between 35˚32′N to 35˚35′N and 43˚06′E to 43˚08′E.
Geologically, most of salt springs and leakage flow from the outcrops of Fath’a Formation. This formation is one of the most extensive and economically important formations [3], it consists of cyclic alternations of gypsum, anhydrite, marl, limestone as well as the clastic rocks which are dominated at the upper parts of the formation. The formation consists of salt layers at depth [4], the rock salt layers (or domes) in Fa’ha represent the source of salt in Meha slattern.
The Fath’a Formation yields economically significant deposits of sulphur as well as sulphate and salt [5].
There are no previous studies on the salt ponds in the area. Yet, there are some publications including sedimentological and geochemical studies of geological formations [6], as well as hydrogeochemical studies for other saline ponds from eastern and southern of Iraq (AlKhalifah slattern; [7]) and (Samawa slattern; [8]).
The geology of salt and salt bearing formations in Iraq were studied in detail [9], out of 33 known salt locations, only ten are actually producing from playa ponds, brines and sea water sources (Figure 1).
The climate is a control factor in salt production by evaporation manner. The data of climate are collected (Al-Jubori, [10] and [11]) for the period of 1970-1998.
Maximum average temperature is recorded in summer (July) 44˚C, whereas, it decreases to 13˚C in winter (January). The minimum average temperature is recorded in summer (July) 25.4˚C, whereas, it decreases to 2.9˚C in winter (January). The wide range between maximum and minimum averages of temperature as well as between summer and winter seasons reflects extreme climate which is typical of semi-arid one.
Winds mostly are north-westerly directed, dry and hot in summer and rainy and cold in winter. The mean of
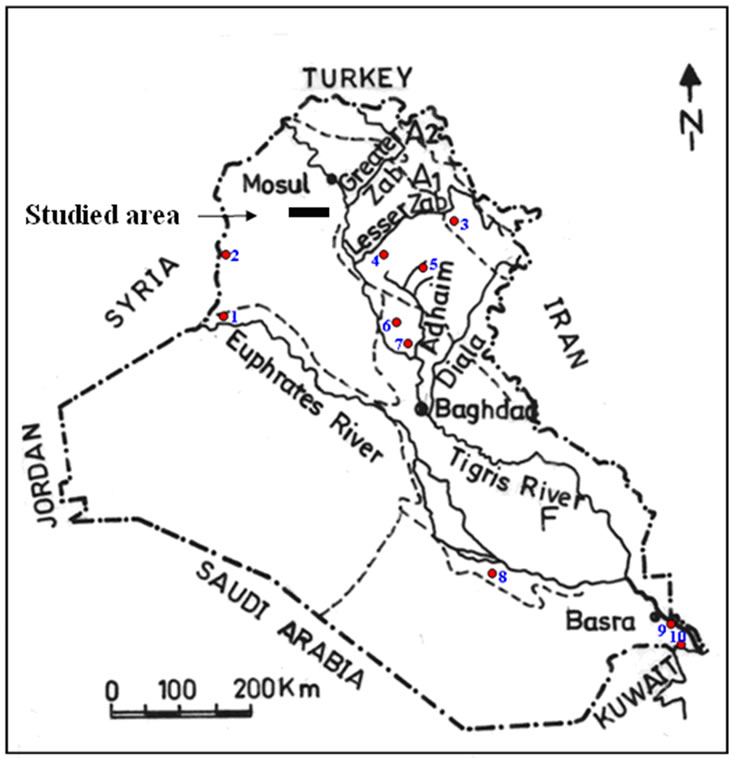
Figure 1. The locations of studied salt ponds and other main ten salt sites in Iraq, after (Al-Sinawi and Saadallah, 1974; 1: Al-Tawil, 2: Boara, 3: Chamchemal, 4: Hawija, 5: Tuz Khurmatu, 6: Al-Khalifa, 7: Shari, 8: Samawa, 9: Sanam, 10: Fao) [8].
wind velocity reaches to 2.7 m/sec in June and July whereas; it is about 1.0 m/sec in January.
Rainfall is dominated in winter and spring. The area is also characterized by complete dryness in summer season. The area lies between the rain lines (200 - 300 mm).
Evaporation is one of the main factors affecting the water [12], and it depends on other climatologic condition of the area as temperature, winds, relative humidity and the topographic nature. Maximum evaporation took placein summer (June-August), with mean annual evaporation of 2584.3 mm.
The crystallization of salt starts in the months of water shortage at the end of spring, therefore; the salt production starts at the beginning of summer and continues along the water shortage period which is characterized by high evaporation.
Figure 2 illustrates the harvesting of salts by a primitive way by the people in the area of Meha slattern. The harvested salt is contaminated with different pollutants, such as salt resistant bacteria.
The work presented in this paper aims to:
1) Study the effects of hydrologic al parameters on the source and accumulation of sodium chloride salt solutions in the depressions of the area.
2) Offer a detailed description of the salt ponds in Meha salt ponds as one of the important salt ponds and give an idea about exploiting of other saline ponds in the area.
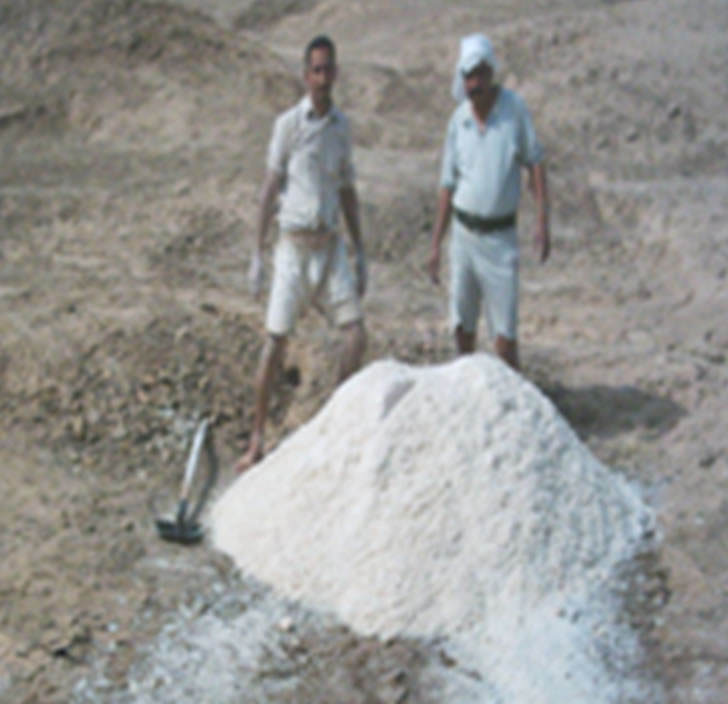
Figure 2. The primitive way of isolating water and accumulating of salts in Meha slattern, Sharqat area, summer, 2005.
3) Use the morphometric parameters to indicate the main structural and geological features which contribute in the upward leakage of salty water along the valleys in the area.
4) Select the best location for the construction of the concrete pond for saline water accumulation for salt production.
2. Geomorphology and Morphometry
Geomorphologically, the area under study situated at the transition area between the southwestern part of the foot hill zone and unfolded zone on the physiographical classifications of Iraq [13], it seems to be at the boundary of the western limb of Khanuqa Anticline.
The slattern area represented by Meha valley which drain from northwest to southeast, the elevation of the area ranged between 164 - 206 m asl, while the optimum area for salt production lays in the central part of the bottom of the valley with elevation between 164 to 174 meters, it is connected with small perpendicular valleys from the two sides (Figures 3 and 4).
The depression covers an area about 90 km2 which represent the total area of salt accumulation, while the area of salt production is represented by 4 km2, (Figure 3).
The 3D model, Figure 4, reveals to that the gradient of the valleys on the southwestern side has gently slop more than the northeastern side, this phenomenon may be reflects the effect of the geological structures of the area.
The main valley for salt accumulation and its nature is shown in Figure 5. Water is accumulated in this valley and other valleys in the rainy seasons (winter and spring)
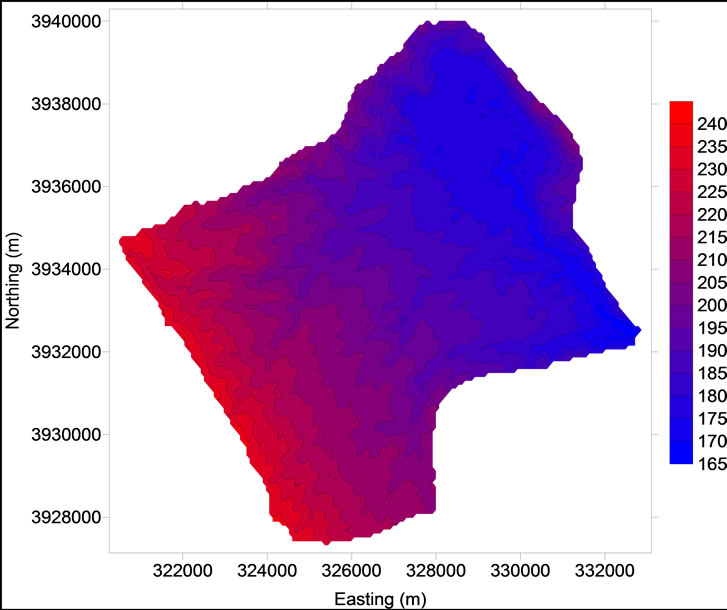
Figure 3. 2D elevation model of the area of salt ponds, typical area for salt product marked by blue color, (extracted by Global Mapper v10 from N35-E43-hgt file, and exported as grid file to SURFER-8).

Figure 4. 3D model explain the topography of the area, extracted by Global Mapper v10 from N35-E43-hgt file, the bright-dark blue area represent the salt ponds.
 (a) (b)
Figure 5. The nature of the main salt valley in Meha slattern. (a) Water accumulated in the main valley in spring season, note the salt crust at the side of valley (arrows) and grass growth; (b) Nature of the secondary valleys that cut the main valley, note also the salt crust along the valley side (arrow).
mostly saline water as shown by the salt crusts accumulated at the sides of the valley.
The studies of salty water basins have hydrological indicators, such as drainage properties, hydrology of streams and sedimentation [14]. The morphometry play a main role in the flow, leakage and accumulation of salty water.
Morphometric analysis is used to study the properties of the basin. The basics of this technique was suggested by [15] and developed by [16]. The morphometric properties of the basins related directly with physiographic factors, especially the geological structures, climate, plant cover and any other changes [17].
The topographic map of scale (1:50000) was used to extract the drainage system of Meha basin (Figure 6). The number and length of stream orders were determined, the circumference, area and length of the basins were measured and used for the mophometric analysis (Table 1). The drainage basin represents the basic unit for the morphometric analysis [18], therefore, the morphometric analysis was used to predict the relation between the geomorphologic properties and the characters of the stream.
The determination of the area of the basin is very important because of the effect on the volume of the discharge. The area consistency ratio (ACR) represent the convergence of the shape of the basin to the shape circle, this ratio was calculated from the relation ACR=Ab/a [19] in [20], when, ACR = area consistency ratio, Ab = area of the basin (km2), and a = area of circle which has the

Figure 6. Drainage system of Meha Basin.

Table 1. The morphometric factors of Meha Valley.
same circumference of the basin.
The value of ACR was less than or equal to (1), [21]. If the value of a ACR approach to (1) that reveals the convergence of the shape of basin to the circle which was characterized by high discharge. While the decreasing of the ratio reveal an elongated shape of the basin, which causes the elongation of the stream and the delay of flooding wave. The area of basin determined by the squares method, and the circumference measured by the ArcGIS-v9.2.
The low area consistency ratio of the studied case (0.65) indicates the elongated shape of the basin, that causes the delay of flooding wave which decreases the effect of the washing on the salt deposits in the valley. The delay of flooding wave increases the opportunity of trapping the suspended sediment to prevent the effect of these sediments on the salt deposits.
The circumference consistency ratio (CCR) was calculated from the relation  [22], when, CCR = circumference consistency ratio, ACR = area consistency ratio.
The high value of CCR (1.24) confirms the above conclusion about the delay of flooding wave and decreases the washing of salt deposits from the bottom of the valley.
The increasing of this value reveals divergence of the shape of basin from the circle. When highest ACR then lowest CCR, The value of this ratio always more than (1).
The basin form factor (BFF), reflects the convergence and divergence of the shape of the basin from the triangle shape, the increasing of this value reveals convergence to the triangle shape, it is very important to determine the velocity of flooding wave and the annual flow system [14]. The value of this factor ranged between (0-1) the increasing of value reveals triangular shape of high discharge. The basin form factor was determined by the relation BFF= Ab/L2 [22], when BFF = Basin Form Factor, Ab = area of the basin (km2), L = basin length (km)
The low value of BFF (0.34) indicates the decreasing of sedimentation in the bottom valley, which prevents the crystalline salt from the pollution by fine sediments.
Morphometric studies deal with the study of hydrologic basin and determines the factors which affect the velocity and amount of discharge and its ability to transport and the volume of discharge, as well as to apply this results in the hydrological study of the valley.
The determination of stream order of the basins is very important to study the amount of water discharge of all valleys [19]. The stream order of the basins reflects the ability of erosion and sedimentation to avoid the effect of erosion on the land, as well as the effect of flooding.
There are many methods to determine the stream orders as in [19]; and [15], but the most common and simple method is Strahler one [22]. In this method, the first order represented by the valley which haven’t branches, 2nd order produced when two branches of 1st order connected together. This method was used in the present study.
The stream orders of the area were determined, the maximum stream order is 5th, maximum number of valleys and the length of valleys in every order were measured by ArcGis and tabulated in (Table 1).
Bifurcation ratio was represented by the ratio between the number of the branches in any stream order to the number of branches of the next order (for example, branches of 1st/branches of 2nd), the minimum theoretical value of this ratio is (2), it is always ranged between (3 - 5), [15], it is one of important factors that control the discharge [23]. The Bifurcation ratio of the studied area was tabulated in (Table 1), this ratio equals to 4.7, 3.38, 4.3 and 3 for the 1st, 2nd, 3rd, and 4th orders respectively. The high ratios of 1st and 3rd orders reflect that the valleys of these orders are located in the zone of weathering, while the 2nd and 4th orders represent transition areas between erosion and sedimentation zones. The zone of sedimentation located out of the area of study to the direction of downstream. The area of salt production is located in the area of 5th stream order, there is no sedimentation in this area, but the rain water dissolves the salt and leach it downstream, therefore the crystallized salt transported out side of the valleys before the flooding.
The drainage density is an important factor related with geomorphology and hydrology, it reflects the flow method of surface water which effected by geology, gradient, plant cover, quantity and intensity of precipitation [21]. This factor represent indirect indicator to the length of the valleys, it is ranged between 600 m/Km2 for the basins of low discharge to more than 3 km/km2 for the basins of high discharge [24].
In the case of high drainage density, the drainage peak is high, and vice versa [25]. There are two types of drainage density:
Longitudinal drainage density (LDD) represents the ratio between the summations of the valleys lengths in the basin (SL) to the area of the basin (Ab), LDD = SL/Ab.
While the numerical drainage density (NDD) represents the ratio between the number of the valleys in the watershed (SN) to the area of the watershed (Ab), LDD= SN/Ab. The number of valleys in each order and the length of these valleys are tabulated in (Table 1).
The value of the two types of drainage density reached to more than 3, which reveals that the drainage of the basin, is high.
The reflecting factor (RF) is an important factor to determine the meandering that has negative effect on the flow in the valley, RF = TL/StL [22], when, Rf = reflecting factor, TL = the true length of the valley (Km), StL = the straight length of the valley watershed (km)
The maximum straight length and maximum true length in the valley are tabulated in (Table 1), and the reflecting factor of the area is 1.25, this high value is interpreted by the intense deviation of the valleys of 4th orders in the connection points with the valley of 5th order which represents the valley of salt production. The intense deviation in this valley may be interpreted by the effect of structural settings such as the existence of fault, which confirms the idea of leakage of salty water from the deep ground water reservoir in the bottom of this valley.
The drainage pattern means the shape of the drainage channels on the earth surface, it is a reflection of geological structures, rock hardness, and geomorphology of the basin [26]. The drainage pattern was traced from the topographic map of scale 1/100,000, (Figure 6), [27]. The dendritic drainage pattern was recognized in the studied basin, this pattern occur in the areas of homogeneous hardness, it is characterized by non systematic branches. It also appears in flat areas because the variety of rock hardness is very low and not affects the drainage directions.
The branching density of valleys vary depending on precipitation, it increases with the increasing of precipitation, and vice versa [28].
The drainage map (Figure 6) clarifies that the dendritic drainage pattern clearly appears in the western part of the studied area which covers the main part of the area on the west side of the 5th order valley which named Meha valley.
The parallel pattern coexists in the areas of high gradient, and when the existence of structural barriers. The distance between the parallel valleys was controlled by structures and the topography of the area [29].
This type of drainage pattern clearly appear in the eastern part of the area as a narrow zone on the east bank of Meha valley which represent the structural boundary of the area. So, the drained water from the west bank is more than that of east bank, therefore; the locations of evaporation pans were selected on the east bank. The parallel pattern is changed to dendritic in the distal areas from high slopes to flat areas [11].
The stream order is very important to predict the discharge and the ability of erosion and deposition of the valleys. Figure 7 reflects the relation between the stream order and the number of valleys. The number of valleys of the first order is very high with respect to the number of valleys of last order, because the first one covers a wide area with respect to the last.
The length of the valleys decreases from the low to the high orders (Figure 8). The relation between the length of valleys and stream orders control the capacity of discharge of the area. The figure reflects that the valleys of 1st and 2nd orders represent the main percentage of the length of valleys. The relation indicates the high discharge efficiency, which leads to wash the salt deposits from the bottom of valleys during the rainy seasons.
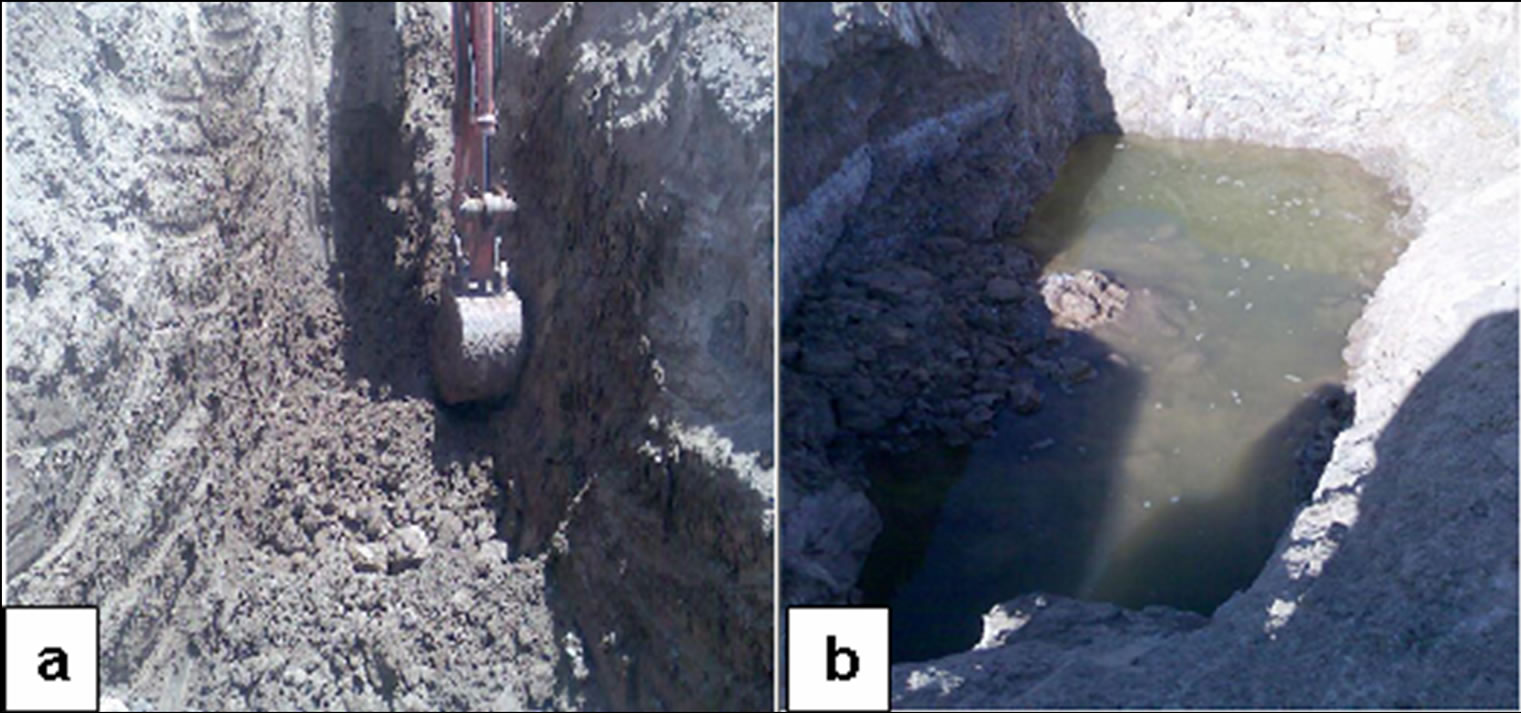
The depth of groundwater is ranged between 0.5 - 1 m, and leaked to the surface of the depressions in the bottom of the valley. The leaked water has very high concentrations of salt. Shallow well (hole), to be digged near the constructed pond in order to accumulate water. The stages for this digging are illustrated in (Figure 9). The digged hole has 4 m width and 5 m length and digged for 4 m depth. It is at 4 m away from the constructed basin.
The hole was selected as rough cone shape with margins slightly sloped to prevent any collapsing due to the muddy nature of the base of the hole.
After one day of digging, water accumulate, in the hole. Water accumulated in the hole will be pumped mechanically to the basin and monitored regularly. The pictures show the concentration of salt in the water that will be evaporated during June-August for salt.
3. Harvesting and Analysis
3.1. Harvesting
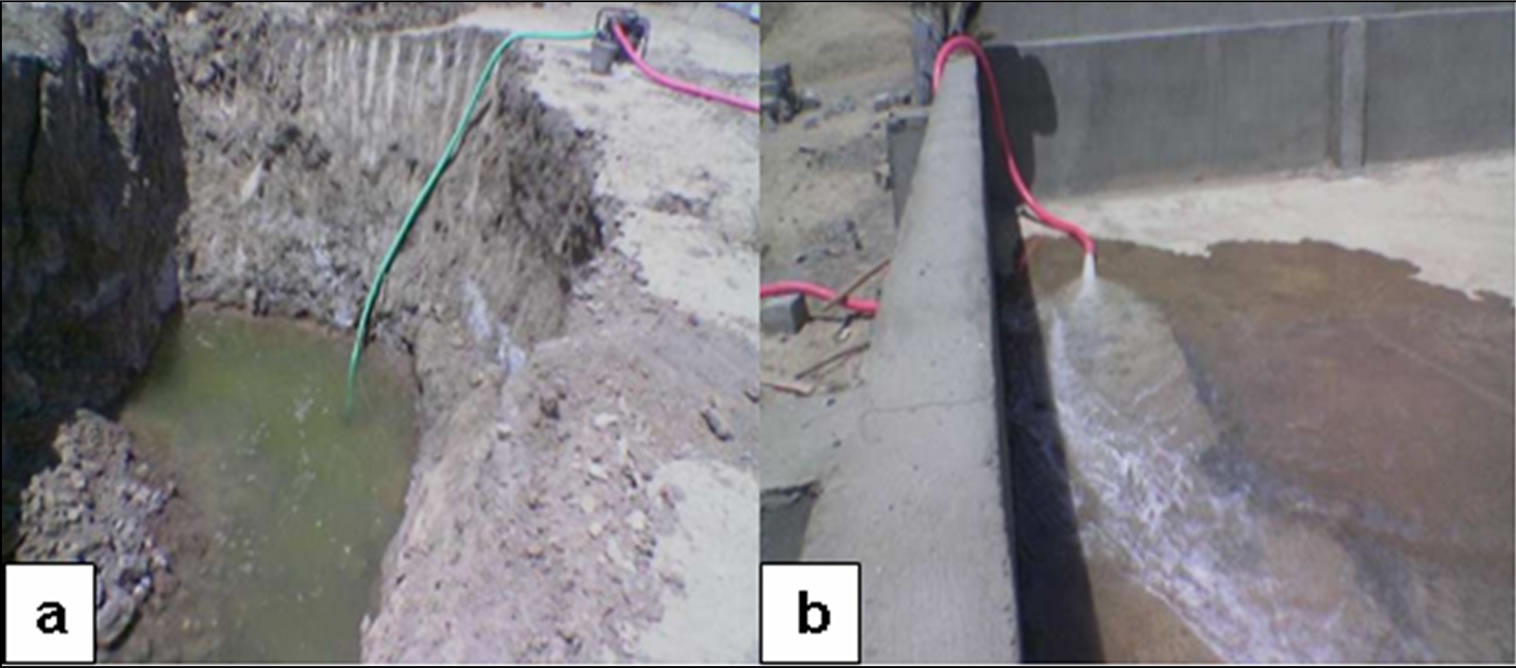
Salt harvesting after evaporation of the accumulated water in the constructed evaporation ponds starts at mid of July after a month of water accumulation and evaporation. Stages of water accumulation, evaporation and harvesting of salt are illustrated in Figure 10.
Shallow wells were digged in order to accumulate water (Figure 10), water accumulated in these wells are continuously pumped into the ponds (Figure 10), accumulated water was left for evaporation for a month and salt are accumulated at the floor of the pond. Several water samples were taken from the wells and the pond during evaporation for analysis.
Salt crusts first precipitated on the floor as upwardgrowing cubic or chevrons crystals. This nature of precipitation is common for halite precipitation [1].
3.2. Hydrochemistry
Different chemical and physical methods of analyses were done to determine the quality of salty water after different periods of evaporation, and classified the quantity of the produced salt. Water samples are collected from the accumulated water. These samples were analyzed to determine their geochemical & some physical characteristics. The variation of various cations Ca++, Mg++, Na+,
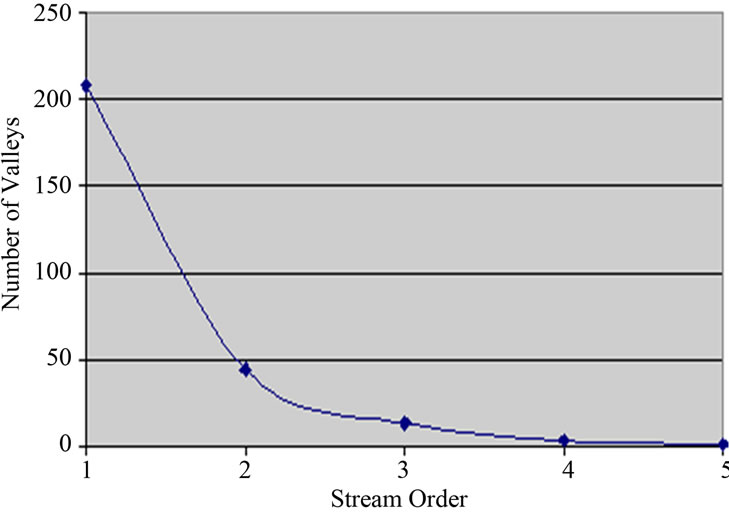
Figure 7. Relationship between number of valleys and the stream order of the study area.

Figure 8. Relationship between length of valley and stream order of the study area.
 (a) (b)
Figure 9. (a) Hole digging and (b) Water accumulation in the digged hole.
 (a) (b)
Figure 10. Illustration of (a) the nature of digging shallow wells excavated in the area near the constructed pond; and (b) the water pumped into the pond and water accumulated in the pond for evaporation.
and K+ with the three weeks of evaporation is illustrated in (Figure 11).
The above variation of cations shows that concentration of Ca2+ and Mg2+ decreases with the precipitation cycle (i.e. firstly precipitated), while concentration of Na+ and K+ increases. This means that CaCO3 and MgSO4 are firstly precipitated from solution followed by NaCl and finally KCl. The variation of anions ( , Cl– and
 ) with evaporation cycle is illustrated in (Figure 12).
It is clear from the above figure that bicarbonates and sulphates concentration is decreased with evaporation period while those of chlorine increases. This also means that CaCO3, MgCO3 and MgSO4 are firstly precipitated from solution followed by NaCl and finally KCl.
4. Recommendations
1) Detailed survey for the use of clay deposits in the area as raw materials for paints manufacture, since most of this clay is used by citizens in the region in painting their houses and marking their sheep.
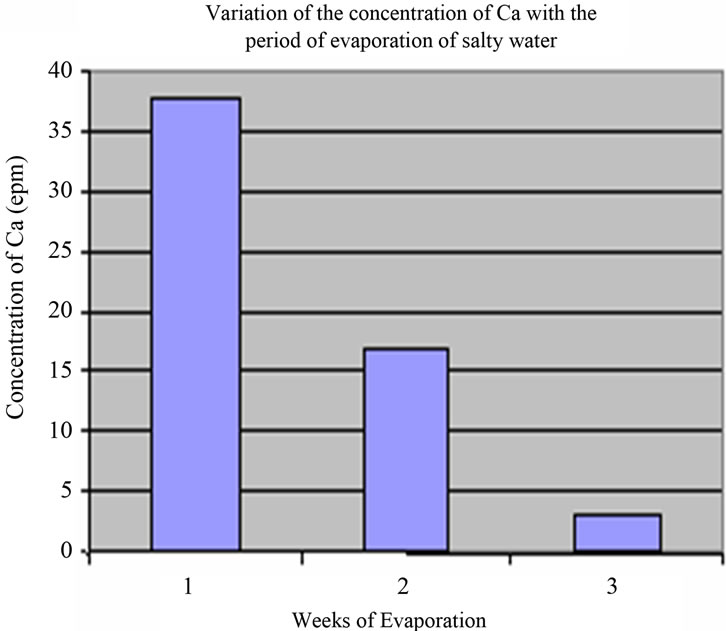
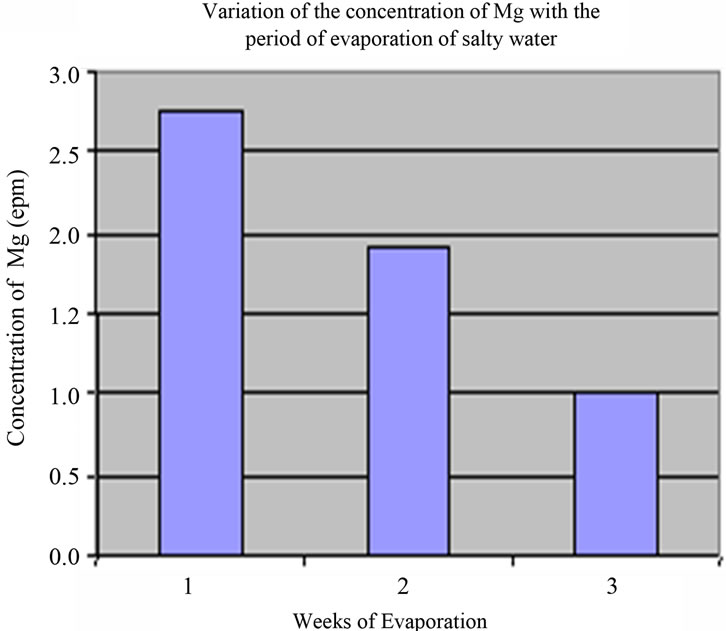

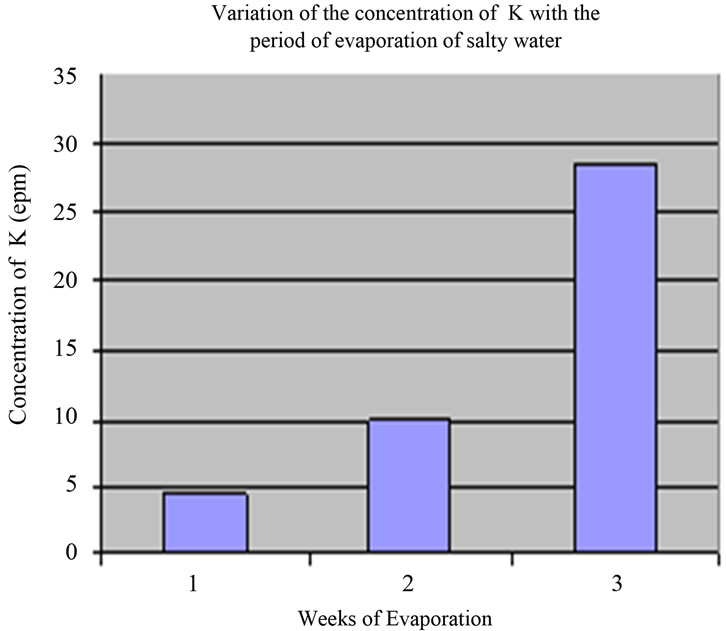
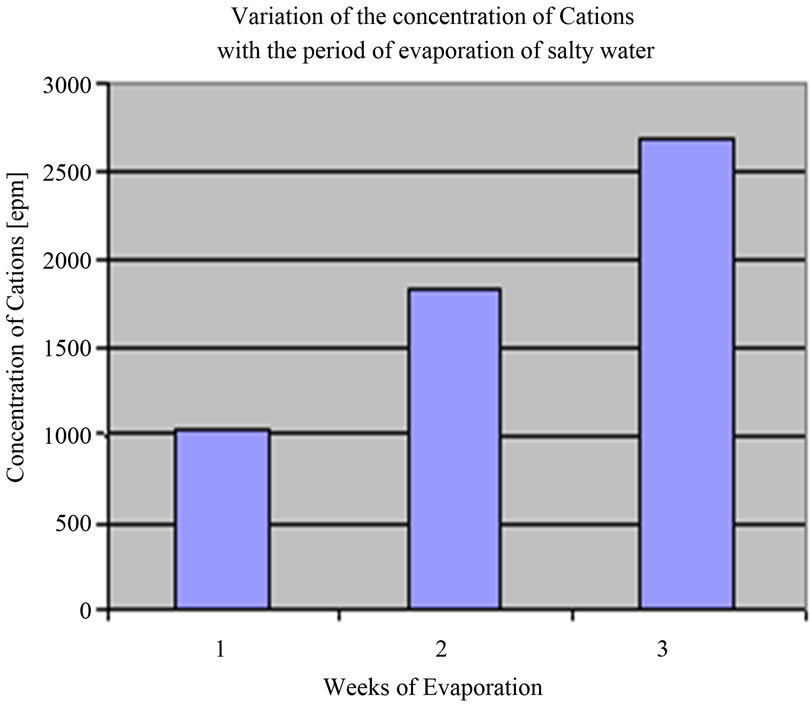
Figure 11. Variation of cations with evaporation period.
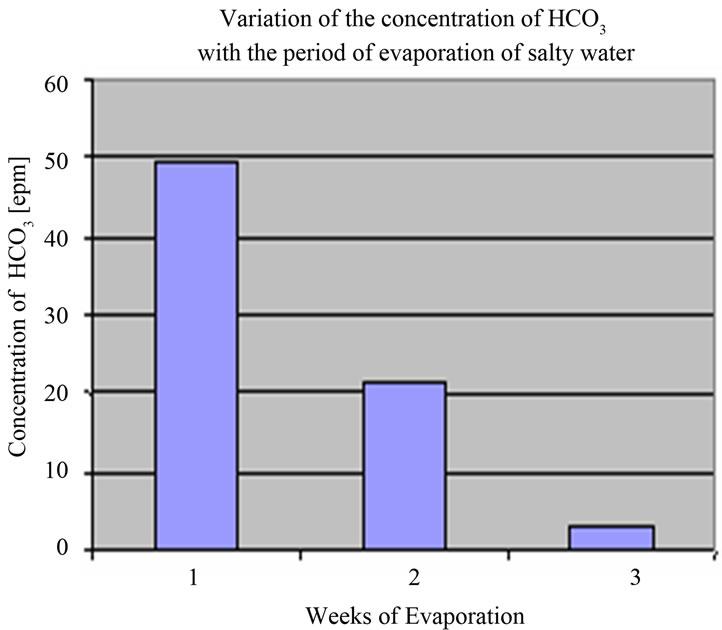
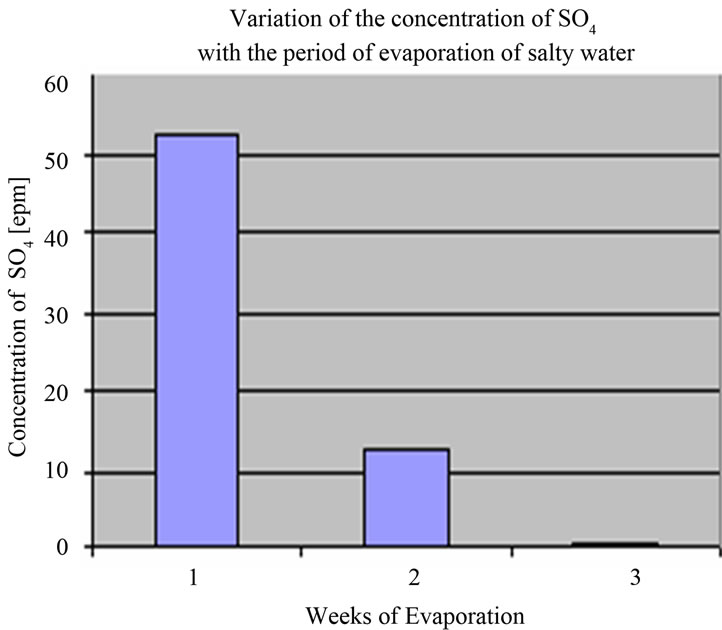
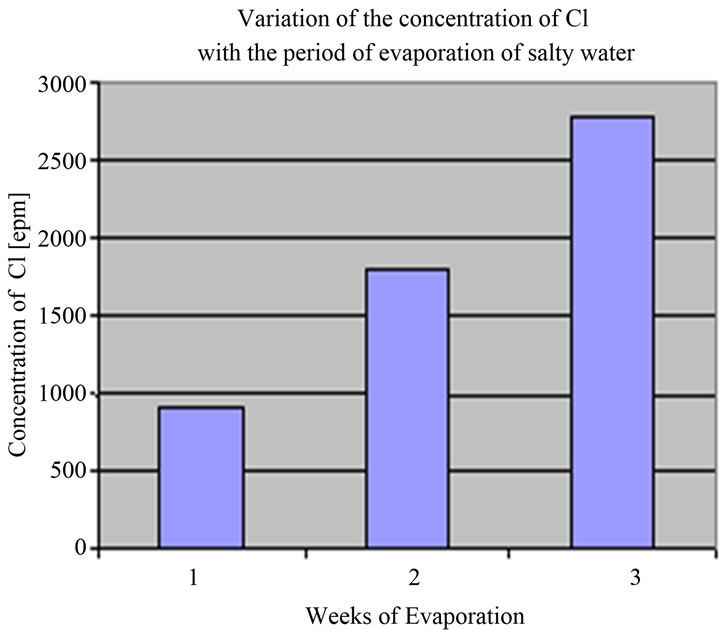

Figure 12. Variations of anions with evaporation period.
2) Using the same method of construction in other areas of the region (for example Ajareb and Sarray areas) that are already been used in producing salt by primitive ways.
5. Conclusions
1) The study identifies the best location for the construction of concrete ponds to accumulate water for salt production that forms the main purpose of the project.
2) Comparison with the salt accumulated by primitive ways during last year shows that the old harvested salts are contaminated with mud and other unwanted materials and of pink colors.
3) Salt harvesting shows that good quantities with higher purity of salt could be obtained from the water which evaporated in the constructed pond.
4) The analyzed salt which harvested in the year of study is a pure one as compared with that accumulated and harvested by traditional way of harvesting.
The chemical investigations reveal that the harvested salt during the year of the study from the current project contains more halite and less sylvite. In general, the salt is good for domestic uses and of course for various industrial uses.
REFERENCES
- J. K. Warren, “Evaporites, Sediments, Resources and Hydrocarbons,” Springer, Berlin, 2006. doi:10.1007/3-540-32344-9
- M. Kurlansky, “Salt: A World History,” Walker & Company, Mount Sterling, 2002.
- A. I. Al-Juboury, S. Q. Al-Naqib and A. M. S. Al-Juboury, “Sedimentology, Mineralogy and Depositional Environments of the Clastic Units, Fath’a Formation, (Middle Miocene), South of Mosul, Iraq,” Dirasat, Pure Sciences, Vol. 28, No. 1, 2001, pp. 80-106.
- A. Al-Sayyab, F. S. Al-Omari, D. Al-Rawi, Z. D. Al-Sheikh, N. Al-Ansari and J.A. Al-Jassim, “Geology of Iraq,” Dar Al-Kutib Publication House, Mosul, 1983.
- S. Z. Jassim, R. Raiswell and S. H. Bottrell, “Genesis of the Middle Miocene Stratabound Sulphur Deposits of Northern Iraq,” Journal of the Geological Society, Vol. 156, No. 1, 1999, pp. 25-39. doi:10.1144/gsjgs.156.1.0025
- M. Al-Mubarak and R. Youkhana, “The Regional Geological Mapping of Al-Fatha-Mosul Area,” State Organization for Minerals (SOM) Library Reports, Baghdad, 1977.
- S. A. Salih, J. H. Alaiwi and I. H. Abdulkarim, “Hydrochemistry of Spring Water in Al-Khalifa Slattern, North of Iraq and Optimum Method to Produce Salt,” Tikrit Journal for Pure Science, Vol. 8, No. 1, 2002, pp. 278- 293.
- S. Y. Samaan, “Geochemistry and Mineralogy of Samawa Salttern, South of Iraq,” M.Sc. Thesis, Baghdad University, Baghdad, 1985.
- S. A. Al-Sinawi and A. A. Saadallah, “Geology of Salt and Salt Bearing Formations in Iraq,” In: A. H. Coogan, Ed., 4th Symposium on Salt, Northern Ohio Geological Society, Cleveland, 1974, pp. 147-151.
- M. A. M. Al-Jubori, “Sharqat City, Study in Urban Geography,” M.Sc. Thesis, Mosul University, Mosul, 1989.
- M. A. M. Al-Jubori, “Watercourse Flow Pattern of the Tigris River between the Two Zabs,” Ph.D. Thesis, Mosul University, Mosul, 1998.
- S. M. Abu Saada, “Hydrology of Arid and Semiarid Regions,” Kuwait, 1983.
- T. Buday and S. Z. Jassim, “The Regional Geology of Iraq, Vol. 2: Tectonism, Magmatism and Metamorphism,” Pub- lication of the Geological Survey of Iraq, Baghdad, 1987.
- M. M. A. Al-Sahhaf and K. M. Al-Hassan, “Hydromophometry of Al-Khawsar Basin, Study of Applied Geomorphology,” Al-Ani Press, Baghdad, 1990.
- R. E. Horton, “Erosional, Development of Streams and Their Drainage Basins, Hydrophysical Approach to Morphology,” Geological Society of American Bulletin, Vol. 56, No. 3, 1945, pp. 275-370. doi:10.1130/0016-7606(1945)56[275:EDOSAT]2.0.CO;2
- A. N. Strahler, “Quantitative Analysis of Water Shed, Geomorphology Traps,” American Geophysical Union, Vol. 38, No. 6, 1954, pp. 912-920.
- H. R. Sallama, “Geomorphological Analysis of Morphometric Properties of Water Basins in Jordan,” Dirasat Journal, Vol. 7, No.1, 1980, pp. 97-132.
- P. Macula, “Modern Idea in Geomorphology,” 6th Edition, University of Baghdad, Baghdad, 1986.
- A. N. Strahler, “Geomorphology,” Dar Al-Zaman Press, Baghdad, 1964.
- M. F. Al-Moula, “Morphometric Study for Specifying Location of Dam in Wadi Al-Tharthar Basin North of Hatra Using Remote Sensing Techniques,” M. Sc. Thesis, University of Mosul, Mosul, 2002.
- S. T. Jabbori, “Hydrology and Water Management,” Dar Al-Kutub press, University of Mosul, 1988.
- A. B. Al-Nakkash and M. A. Al-Sahhaf, “Geomorphology,” National Library in Baghdad, Baghdad, 1989.
- M. M. Ashor, “Morphometric Analysis Methods for Water Drainage Nets,” Qatar University, Doha, 1986.
- B. A. K. Al-Ghitaa, “Hydrology and Application,” Ministry of Higher Education, Organization of Technical Institutes, Baghdad, 1982.
- M. S. Hassan, B. Kh. Dawood and S. M. Al-Rawi, “Engineering Hydrology,” Dar Al-Kutub Press, Mosul, 1992.
- W. D. Thorenbery, “Principles of Geomorphology,” Dar Al-Kutub Press, Mosul, 1975.
- “Base Map of Sharqat Area,” 1-38-B-02, Scale: 1:50000, Directorate of Military Survey, 1983.
- A. A. Al-Babwati, “Geomorphology of Al-Tharthar Valley,” M.Sc. Thesis, University of Baghdad, Baghdad, Unpublished, 1991.
- R. A. Zuidam and F. I. Zuidam, “Terrain Analysis and Classification Using Aerial Photographs,” ITC Textbook of Photo Interpretation, Vol. 7, Enschede, 1979.